How AI Decision-Making is Improving Enterprise Outcomes
Blog
Share 
No-Code, Low-Cost Data Automation with Alteryx Designer Cloud
 13 January 2025
  Sumi S
 User-friendly Experience
The user-friendly interface enables cross-functional collaboration and creates analytical solutions that improve productivity and efficiency. The award-winning drag-and-drop capabilities of the designer cloud speed up the analytic process with AI/ML-based suggestions that guide users through their data transformations.Smart Processing
Alteryx Cloud Designer empowers users to perform responsive data transformations that can be scaled to any size. With smart data samples, you can access the entire dataset and utilize pushdown processing effectively.Enterprise-grade Platform
A flexible and scalable enterprise-grade platform can help teams as it integrates effortlessly into the existing data and analytics architecture with best-in-class security and governance.Built-in Connectors
Easily connect and transform your data from various sources with built-in connectivity to over 60 sources. This feature is designed for enterprise-grade governance, scalability, and security.All-access Reporting
The new Reporting feature for Designer Cloud offers a drag-and-drop report preview canvas, allowing you to configure report elements and build reports more quickly in the cloud.A Unified Platform
An end-to-end unified analytics platform can be fundamental in building an analytics culture, allowing every user to convert data into business insights with the help of cloud-native data engineering, analytics, and data science.Accessibility
Alteryx cloud designers can easily access and analyze data even by non-technical users without depending on IT or analytics, democratizing data across your organization.Real-time Update
You can make changes to your data in real time using the new Interactive Results Grid, which lets you see and make as you build your workflows and the quality of any dataset using a quality bar and visual data profiling.Private Data Handling
Alteryx Cloud provides customers greater flexibility in the management and storage of their data. The new split-plane solution enables private storage and processing options.Cloud Data Preparation for the Modern Enterprise
Alteryx Designer Cloud allows organizations to streamline their data operations and gain insights more rapidly. Reduce data preparation timelines from hours to minutes while ensuring data quality, accuracy, and governance.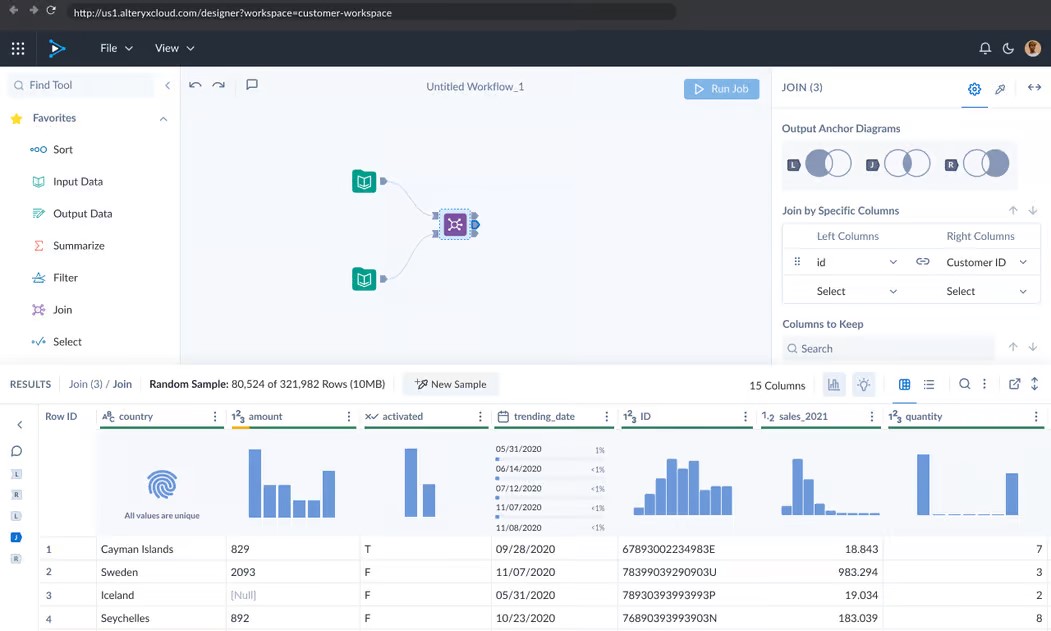
Cleanse, Prepare, and Blend Data Effortlessly
Make data preparation simple for everyone. Designer Cloud enables users to quickly cleanse, profile, prepare, blend, and analyze data without coding knowledge. With user-friendly drag-and-drop tools, individuals can efficiently execute data transformations. To enhance the efficiency of data preparation, AI and machine learning-based suggestions guide users throughout the process. Empower everyone in your organization to make data-driven decisions and achieve insights up to 90% faster.Collaborate in Real Time with Interactive Data Samples
Leverage the collective intelligence of your teams with collaborative workflows that can be easily shared across your organization. Teams can work together in real time, observing and iterating on workflow changes as they happen. Alteryx Designer clouds automatically document each step of the workflow process, ensuring transparency. Users can also leave notes and annotations within workflows. Interactive workflows make this possible while pulling a subset of data, allowing teams to develop without pulling the entire dataset, thereby saving time and resources.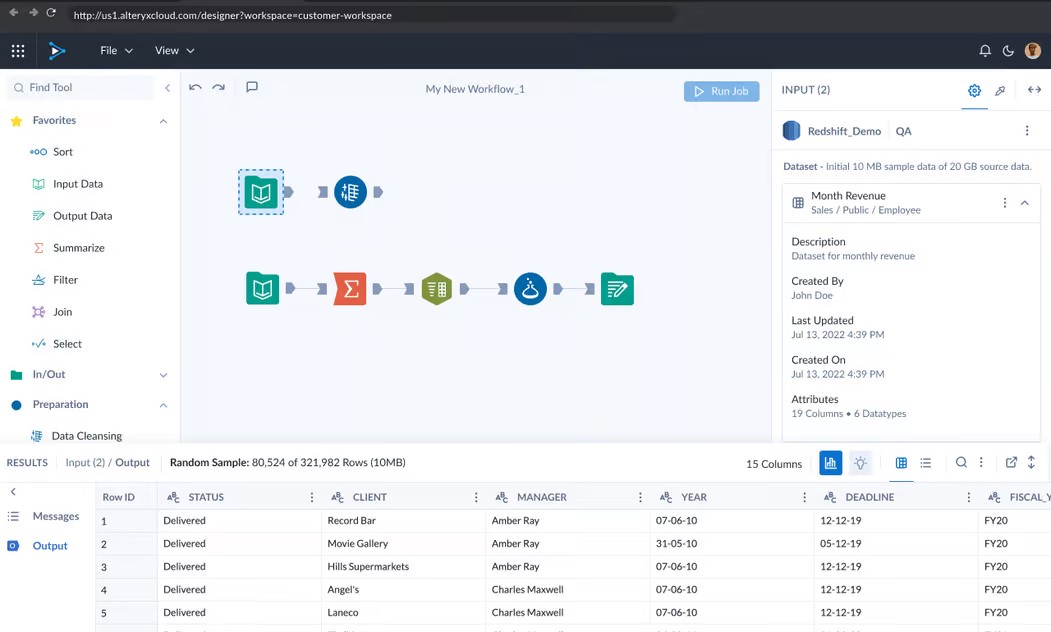 Source: https://www.alteryx.com/products/designer-cloud
Satisfy the Needs of the Enterprise
Designer Cloud is built for the world’s most demanding modern enterprises. Alteryx empowers hundreds of well-known brands across all industries to enable analytics across their organizations with robust security, governance, and scalability. Plus, you can deploy in the cloud environment of your choice, with support for AWS, GCP, Snowflake, and more. With pushdown processing and built-in connectivity to over 60 data sources, you can easily scale your data operations and transform your data from anywhere. No more installations, permissions, machine limitations, or hassle.Alteryx + Beinex Partnership
Being the premier partner of Alteryx, Beinex demonstrates excellence in delivering end-to-end analytics transformation services that revolutionized multiple industries in the Middle East. Experience Alteryx now: Free Alteryx trialAlteryx has joined the league of cloud services providers with its Alteryx Designer Cloud. It offers a suite of user-friendly cloud products to bring automated analytics to every user. From IT engineers to business users, they can easily access insights with a simple click. In short, anyone can prepare cloud data.
Let’s dig into the main features:
Related Articles

Master Data Visualization with Tableau Public: A Guide to Success
Tableau Public Login
1. Sign Up for an Account Head over to Tableau Public and create a free account. After signing in, you’ll have access to your profile hub, where you can manage and create new visualizations, also known as vizzes in the Tableau Community. 2. Create a Visualization Click on “Create a Viz” from your profile hub, and you’ll be taken to Tableau’s interface, where you can connect to data sources, build your visualizations, and customize them as needed. 3. Publish Your Work Once your visualization is ready, click “Publish As” to share it. This step ensures that your work is stored in the Tableau Public free data visualization software, making it accessible to a global audience.
How to Download Tableau Public: Free & User-friendly
If you’re eager to start, Tableau Public download is free. Here’s how to get started: • Visit the official Tableau Public download page. • Click on the “Download” button to get the latest version. • Install the software and sign in using your Tableau Public login credentials. • Start exploring data visualization with Tableau Public free download. With Tableau Public tutorial resources available online, you can quickly learn how to leverage its features for impactful storytelling.Master Data Visualization: Best Practices for Creating Visualizations on Tableau Public
1. Craft Clear and Informative Titles A well-thought-out title is crucial for any visualization. It should succinctly describe the content while giving viewers a clear understanding of what to expect. A good title helps set the context for your data story. 2. Choose the Right Visual Encodings The effectiveness of your visualization relies heavily on selecting appropriate chart types and encodings. Whether it’s position, length, or color, choosing the right visual elements ensures that your data is represented accurately and clearly. 3. Ensure Effective Labeling Labels make your visualization easier to interpret. Be sure to label axes clearly and add data labels where necessary, so your audience doesn’t need to guess or spend extra time understanding the data. 4. Select the Most Suitable Chart Types Not all charts are created equal—each has its strengths for different types of data. Bar charts are ideal for category comparisons, while scatter plots are great for showing relationships between variables. Picking the right chart type is crucial for delivering your message effectively. 5. Use Reader-Friendly Formatting Well-formatted visualizations are more likely to resonate with viewers. Use appropriate font sizes, colors, and layout elements to ensure that your visualization is not only aesthetically pleasing but also easy to read and comprehend. 6. Incorporate Filters and Parameters Tableau Public’s interactive features, such as filters and parameters, allow users to engage more deeply with your visualization by customizing their view. Thoughtful use of these tools can enhance the user experience. 7. Limit Annotations Annotations can add helpful context or clarification, but they should be used sparingly to avoid overcrowding your visualization. Only include annotations when they provide meaningful insights or explanations. 8. Utilize Tableau’s Built-in Formatting Tools Tableau Public provides a variety of formatting options that help polish your visualizations. Take advantage of these tools to make your work look professional and visually appealing. 9. Share Your Visualizations Publicly Once you’ve completed your work, sharing it on Tableau Public allows you to contribute to the larger data community. You can also embed your visualizations on websites or blogs, helping you build your personal portfolio.
Building a Strong Tableau Public Portfolio
To stand out in the Tableau Public community, it’s important to curate a portfolio that reflects your skills and versatility. Here are a few tips: 1. Highlight Your Best Work Showcase the visualizations that demonstrate your strongest skills and align with your career interests. These projects should reflect the kind of work you excel at and wish to pursue. 2. Maintain a Clean, Organized Layout A well-organized portfolio enhances the viewing experience. Ensure that your visualizations are easy to navigate, and avoid cluttered or confusing layouts. 3. Use High-Quality Visuals Always use high-resolution images or graphics when showcasing your work. Poor-quality visuals can give a negative impression and may not reflect your actual abilities. 4. Provide Clear Descriptions Accompany your visualizations with concise descriptions. Explain the purpose of each project, the data source, the analytical methods used, and any challenges you encountered. 5. Show a Variety of Work Include a diverse range of projects in your portfolio to highlight your versatility. This demonstrates your ability to adapt to different data sets and visualization types. 6. Keep Your Portfolio Updated Regularly update your portfolio with your latest work to show your ongoing development and progress in data visualization. 7. Seek Constructive Feedback Asking for feedback from peers or mentors can help you identify areas for improvement and refine your portfolio for better presentation. 8. Engage with the Tableau Community Tableau Public isn’t just a tool—it's a thriving community. Engage with other users by liking, commenting, and participating in forums and challenges. It’s a great way to learn, share, and grow alongside other data enthusiasts.
Conclusion
Tableau Public is a powerful platform that offers more than just free data visualization tools, it’s a gateway to learning, growth, and professional opportunities. By following these best practices, you can create compelling and impactful visualizations while engaging with a vibrant community of data professionals. Whether you’re looking to advance your career or simply improve your data skills, Tableau Public provides the perfect platform to explore, create, and share. Connect with us a for a free demo: https://beinex.com/free-tableau-software/

Top 6 AMS Best Practices to Boost AWS Cloud Security in 2025
What is AWS Managed Services (AMS)?
AWS Managed Services (AMS) is a fully managed service that helps businesses run AWS environments at scale. It adheres to industry best practices for operational excellence, security, and compliance.
• Key Benefit of AWS: AMS enables your company to spend less time managing the complexities of cloud operations and more time focusing on business outcomes.
AMS handles:
• Infrastructure Management: Includes continuous monitoring, patching, and lifecycle management of your AWS resources.
• Security & Compliance: Generates automated compliance checks against NIST, PCI-DSS, GDPR, and HIPAA frameworks.
• Operational Support: 24×7 incident response, backup, disaster recovery, and governance.
• Automation & Optimization: Uses custom runbooks and built-in AWS features to reduce manual labor.
Why AMS Matters in 2025
Cloud adoption is growing, but so is the risk associated with it. Even though many businesses:
• Lack 24/7 monitoring.
• Struggle with regulatory audits.
• Depend on manual vulnerability patching.
AMS offers solutions to mitigate the risks associated with cloud adoption. It resolves the issue by utilizing automation, continuous monitoring, and best practices from AWS. You can implement AMS at scale, without overloading internal teams.
Top 6 AMS Cloud Security Best Practices
1. Prevention: Stop Threats Before They Happen
• Identity & Access Management (IAM): AMS provides real-time validation of modifications, enforces least-privilege policies, and automatically corrects deviations.
• Network Security: AMS configures AWS WAF, Firewall Manager, and Network Firewall to block malicious traffic.
• Patch & Vulnerability Management: AMS automates scanning and patching, including zero-day threats, with Systems Manager + Inspector.
• Backup & Disaster Recovery: With recovery testing and ransomware prevention, AMS fortifies AWS Backup & DRS.
2. Detection: Spot Threats in Real Time
• GuardDuty & Macie: Sensitive data is protected, and anomalous activity is detected.
• Security Hub: Assists with noise reduction, alert aggregation, and issue prioritization.
3. Monitoring & Incident Response
• 24×7 global monitoring with NIST-aligned runbooks.
• Automated incident response using Systems Manager + CloudWatch.
• Integrations with ServiceNow, Jira, Slack, and Teams for faster collaboration.
4. Compliance Made Simple
Adhering to compliance frameworks such as HIPAA, PCI-DSS, SOC, GDPR, and NIST is complex for all companies. AMS embeds compliance controls from day one.
• Continuous Compliance Monitoring: Automated checks via AWS Config rules.
• Audit Trails: CloudTrail & Athena queries for reporting.
• Certified Services: AMS itself is compliant with major frameworks.
5. Governance & Reporting
• Resource Tagging: For governance, cost allocation, and reporting.
• Self-Service Dashboards: Patch compliance, backup coverage, and incident stats.
• Monthly Business Reviews: Joint sessions with Beinex + AWS experts.
6. Security On-Demand: Flexibility When You Need It
AMS Operations on Demand (OOD) lets you scale support instantly for:
• Emergency vulnerability remediation.
• Legacy OS upgrades.
• Firewall operations.
Why You Should Opt for AMS Security?
AWS provides the platform. AMS provides the tools. It ensures:
• Faster ROI → measurable security improvements within 6–12 months.
• Local + Global Expertise → deep knowledge of GCC regulations + AWS global best practices.
• End-to-End Ownership → from planning to monitoring, audits, and response.
Secure Your AWS Cloud with Beinex
Beinex’s Cloud Engineering Services help organizations maximize their AWS investments through robust security frameworks and modernization strategies.
Our Core Offerings Include:
• Cloud Security
• Security Assessment
• Strategy & Implementation
• Well-Architected Review
• Migration & Modernization
• Cloud Migration
• Cloud Automation & DevOps
• Infrastructure Modernization
Whether you are in the early stages of cloud adoption or looking to optimize your existing AWS, we help you achieve your cloud goals.
Connect with us: https://beinex.com/cloud-engineering
Top Cybersecurity Trends 2025: The Key Shifts Every Business Must Know
Top Cybersecurity Trends
The cybersecurity measures are uncompromising, and leaders should be informed about the changing trends and update frequently. Here are some important cybersecurity trends that are going to help you:
1. The Rise of Cybersecurity Threats in the Automotive Industry
Sophisticated software in modern cars provides smooth communication and cutting-edge functions, including driver assistance systems, engine timing, and cruise control. However, cars are also vulnerable to potential hacking threats due to their reliance on automation and the internet. Strict cybersecurity safeguards are required, especially for self-driving or autonomous vehicles, as these dangers are predicted to increase with the growing use of automated vehicles.
2. Blockchain
Although blockchain technology is most commonly associated with cryptocurrency, it could also revolutionize cybersecurity. Blockchain can offer safe storage for private data by establishing a decentralized database. It is far more difficult for hackers to obtain illegal access because there is no central authority in charge of the data.
3. Quantum Computing
This technology processes data by utilizing the principles of quantum mechanics. Compared to conventional computers, it may potentially tackle complicated problems far more quickly. Despite its early stages, this technology has the potential to completely transform cybersecurity by enabling more secure encryption.
4. Leveraging Artificial Intelligence's Potential in Cybersecurity
Artificial intelligence (AI) has emerged as a vital element for enhancing cybersecurity in various industries. AI has enabled the creation of automated security systems that can perform tasks such as danger identification, facial detection, and natural language processing through machine learning algorithms. Fraudsters, however, also utilize this same technology to create sophisticated attacks designed to circumvent security measures. Despite these difficulties, threat detection systems powered by AI can react quickly to new threats, which is crucial assistance for cybersecurity experts.
5. Mobile Devices: A Common Cyberattack Target
Due to their widespread use, mobile devices have become easy targets for cybercriminals, as proved by the sharp rise in malware and attacks that target personal information and mobile banking services. The risks associated with such breaches are increased by the widespread use of smartphones for various purposes, including communication and financial transactions. With predicted trends indicating an increase in malware and viruses specific to smartphones, mobile security has become a key concern for cybersecurity experts.
6. Improving Cloud Security Protocols
As more businesses adopt cloud services, it is crucial to have robust security measures in place for both data operations and storage. Even with strong security measures in place, cloud providers can still face vulnerabilities due to phishing scams, malicious software, and user error.
Organizations must have robust security measures in place to protect against data breaches and cyber threats. Effective cloud security methods must include encryption, authentication, and regular patching to ensure the confidentiality and integrity of cloud-based data and applications.
7. Data Breach: A Recurring Issue
Even minor software errors can lead to significant risks, which is why data breaches remain a major concern for individuals and organizations worldwide. Regulations such as the CCPA and GDPR emphasize the importance of robust security measures in enhancing data protection and privacy rights. To mitigate the risks of data breaches, it is crucial to ensure compliance with regulations and implement proactive security measures.
8. IoT Safety
The spread of 5G networks has ushered in a new era of connectivity, particularly with the Internet of Things (IoT). IoT devices are vulnerable to external threats and software defects, despite providing previously unheard-of communication capabilities. 5G design is still in its infancy, so identifying and addressing any security flaws will require extensive research. The creation of reliable hardware and software solutions must be a top priority for manufacturers to mitigate the risk of network attacks and data breaches.
9. Using Automation to Improve Cybersecurity
To handle the constantly growing amount of data and simplify security procedures, automation is essential. Security professionals can respond quickly and effectively to new threats due to automation, which provides invaluable assistance in the face of high workloads. For large and complex applications, incorporating security measures into agile development methods ensures the production of more secure software solutions.
10. Targeted Attacks Using Ransomware
Industries that rely on specific software systems are at significant risk from targeted ransomware attacks, which can have devastating consequences. Strong cybersecurity measures are crucial, as pointed out by many recent events. To successfully mitigate risks, organizations must be vigilant for ransomware threats and implement preventive measures.
11. Increasing Cyberwarfare
Cyberwarfare and cyberattacks are increasingly targeting sensitive data and vital infrastructure. Elections and other high-profile events are susceptible to cyberattacks. Thus, extra security is required. A spike in data breaches and the exploitation of political and industrial secrets can be anticipated.
12. Mitigating Insider Threats Through Awareness
Mistakes made by individuals continue to play a significant role in data breaches, particularly in cases involving insider threats within organizations. To address this risk, it's vital to enhance awareness and provide thorough training programs for employees. By empowering staff to recognize and address potential vulnerabilities, companies can foster a strong culture of cybersecurity awareness. This approach is crucial for safeguarding sensitive data and minimizing the impact of insider threats effectively.
13. Resolving Issues with Cybersecurity in Remote Work Settings
As employees transition to remote work, they navigate less secure network configurations, creating new cybersecurity challenges. Companies must prioritize implementing robust security measures, such as multi-factor authentication and secure virtual private networks, to effectively protect remote workers from online attacks.
14. Countering Attacks via Social Engineering
Social engineering assaults, such as phishing and identity theft, continue to pose a serious threat to enterprises by taking advantage of human weaknesses to get private data illegally. Proactive security measures and personnel training are crucial in mitigating the risks associated with social engineering attacks.
15. Using Multi-Factor Authentication (MFA) to Increase Security
By requiring users to submit multiple authentication forms before gaining access to accounts or systems, MFA adds an extra layer of security. This proactive strategy strengthens the entire cybersecurity posture and reduces the likelihood of unauthorized access. Adopting multi-factor authentication (MFA) must be a top priority for organizations to properly defend against cyber threats.
16. Preventing International Attacks
Because they target sensitive data and vital infrastructure, sophisticated state-sponsored attackers pose a serious threat to enterprises. Multi-factor authentication and real-time monitoring are two proactive security techniques that are crucial for preventing these sophisticated attacks.
17. Improving Management of Identity and Access
Organizations can monitor and regulate access to networks and sensitive data by utilizing identity and access management (IAM) policies. To protect against unauthorized access and data breaches, robust authentication, authorization, and access control procedures must be implemented.
18. Monitoring Data in Real Time to Identify Threats Early
By enabling enterprises to identify and react quickly to suspicious activities, real-time data monitoring lowers the risk of cyberattacks and data breaches. To detect such risks and mitigate their effects, automated alerts and log monitoring are crucial.
19. Securing Connected Vehicles Against Cyber Threats
The increasing connectivity of vehicles exposes them to cyber threats, necessitating robust security measures to protect against potential attacks. Encryption, authentication, and real-time monitoring are essential to safeguarding connected vehicles against automotive hacking.
20. Ensuring IoT Device Security
Ensuring robust security measures becomes increasingly crucial as the number of Internet of Things (IoT) devices continues to grow. To guard against potential vulnerabilities, organizations must prioritize the security of their IoT devices and implement regular updates and safeguards.
Summing Up
The future of cybersecurity will see advancements in trends focused on enhancing digital fortifications. AI-driven threat detection, zero-trust platforms, and other automated security measures have immense potential in helping mitigate emerging threats.
With remote working environments on the rise, the focus is likely to shift towards securing endpoints while also increasing data encryption measures. Moreover, continuous monitoring, holistic user training, and proactive threat intelligence will become integral in maintaining robust cloud security.
In short, a collective effort involving industry collaboration, the latest solutions, and adaptive strategies will become increasingly important in ensuring a resilient and well-protected cloud security system.

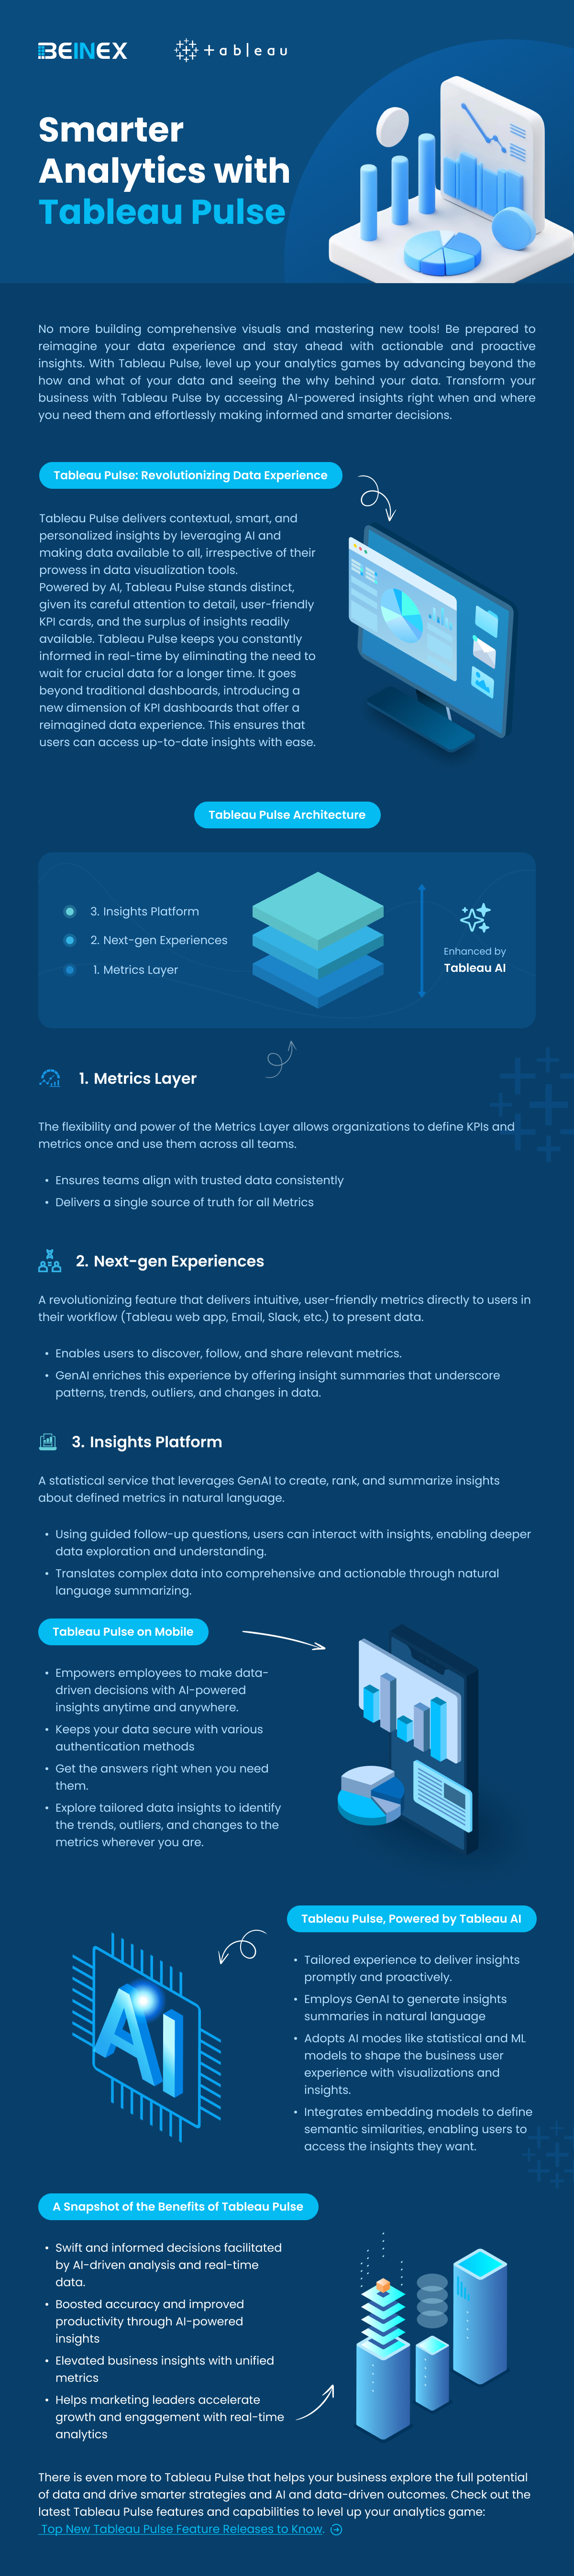
Smarter Analytics with Tableau Pulse (Infographic)

Predictive Analytics in Tableau: A Crystal Ball for Business Success
What is Predictive Analytics?
Predictive analytics is a branch of advanced analytics that uses historical data, statistical algorithms, and machine learning techniques to identify the likelihood of future outcomes based on historical data. The primary goal is to go beyond knowing what has happened to provide the best assessment of what will happen in the future.
Benefits of Predictive Analytics
- Enhanced Decision Making: Make informed decisions based on data-driven insights rather than gut feelings.
- Cost Savings: Optimize resources and reduce waste by predicting demand and managing inventory effectively.
- Risk Management: Identify potential risks and take preventive measures to mitigate them.
- Improved Customer Satisfaction: Anticipate customer needs and preferences, leading to better products and services.
Predictive Analytics Techniques
Predictive analytics techniques offer a wide range of applications powered by various types of models that generate valuable insights. To determine the best predictive analytics techniques for your organization, start with a clearly defined objective. Once you know the specific question you want to answer, you can select the most suitable model.
List of Predictive Analytics Models
- Regression Models: Used to predict continuous outcomes.
- Classification Models: These models categorize data into predefined classes.
- Clustering Models: Group similar data points together based on defined criteria.
- Time Series Models: Analyze data points collected or recorded at specific time intervals to forecast future values.
1. Regression Models in Predictive Analytics
Regression models estimate the relationship between variables, tracking how independent variables impact dependent variables to predict future outcomes. These models range from simple (one independent and one dependent variable) to multiple linear regression (multiple independent variables). Various regression techniques can be applied based on the specific use case.
By defining variable relationships, organizations can conduct scenario or 'what-if' analysis, testing how changes in independent variables affect outcomes.
Application of Regression Models
For example, a company might use a regression model to analyze how product qualities influence purchase likelihood, such as identifying a correlation between blue shirts and higher sales. These insights help refine marketing strategies and product development, optimizing future performance.
2. Classification Models in Predictive Analytics
Classification models categorize data based on historical knowledge. Using a labeled training dataset, the classification algorithm learns correlations between data and labels and then categorizes new data. Popular techniques include decision trees, random forests, and text analytics.
These models are highly adaptable and can be retrained with new data, making them useful across various industries.
Application of Classification Models
For example, banks use classification models to detect fraudulent transactions. By analyzing millions of past transactions, the algorithm identifies patterns indicative of fraud and alerts customers to suspicious activity.
3. Clustering Models in Predictive Analytics
Clustering models group data based on similar attributes. Using a data matrix that associates items with relevant features, the algorithm clusters items with shared features, uncovering hidden patterns. Organizations use clustering models to group customers for personalized targeting strategies.
Application of Clustering Models
A restaurant might cluster customers by location and mail flyers only to those within a certain driving distance of a new location.
4. Time-series Models in Predictive Analytics
Time series models analyze data points in relation to time, making time one of the most common variables in predictive analytics. These models use historical data to predict future metrics. For example, analyzing data from the past year can help forecast the upcoming weeks.
Time series analyses are versatile, used for applications like seasonality analysis (predicting how assets are affected by certain times of the year) and trend analysis (determining asset movements over time).
Application of Time-series Models
Forecasting sales for the next quarter, predicting store visitor numbers, or even determining peak flu seasons.
Predictive Analytics with Tableau
Tableau empowers users to not only visualize their data but also to gain actionable insights through advanced predictive capabilities. Whether you're looking to forecast sales, predict customer behavior, or optimize business operations, Tableau is the right choice.
3 Ways to do Predictive Analytics in Tableau
1. Forecasting in Tableau Desktop
Tableau Desktop offers robust forecasting features that allow users to make data-driven predictions effortlessly. Using exponential smoothing models, Tableau enables you to forecast future data points based on historical trends. Here’s what you can do: Let’s explore the ways to forecast data in Tableau Desktop: • Creating a Forecast: Users can add a forecast to a view by simply dragging a time dimension to the Columns shelf and a measure to the Rows shelf. By right-clicking on the view and selecting "Show Forecast," Tableau generates a forecast based on the selected model. • Customizing Forecasts: Forecast settings can be customized to adjust the prediction length, forecast model, and season length. Users can access these settings through the "Forecast Options" dialog box. • Evaluating Forecasts: Tableau provides a forecast description that includes details about the model, prediction intervals, and underlying statistics. This helps users understand the reliability and accuracy of their forecasts. • Visualizing Forecasts: Forecasts are visualized as shaded areas or lines on the chart, making it easy to compare predicted values with actual data.
2. Bringing R/Python Calculations into Tableau
Integrating R and Python into Tableau Desktop enhances its analytical capabilities, allowing users to perform complex statistical analysis and machine learning tasks. Users can create calculated fields using MODEL calculations, or by using SCRIPT functions that include R or Python scripts to perform custom calculations. These scripts can be used for various purposes, such as regression analysis, clustering, and predictive modeling. Tableau connects to R using Rserve and to Python using TabPy.
3. How to Do Predictive Analytics with Tableau Prep
Tableau Prep enhances your data preparation process by integrating with Einstein Discovery, Salesforce's AI-powered analytics tool. This integration allows you to infuse your data workflows with advanced predictive capabilities. • Einstein Discovery in Tableau Einstein Discovery, part of Salesforce's suite of AI (Artificial Intelligence) tools, is integrated into Tableau to provide advanced predictive analytics capabilities. In Tableau Prep, Einstein Discovery can be used to build and integrate predictive models directly within the data preparation workflow. This feature is available in Tableau Desktop as well. • Generate predicted values by integrating R/Python in Tableau Prep Tableau Prep allows for the integration of R and Python to perform advanced data transformations and generate predicted values.
Here's how you can do it: • Script Steps:
- Tableau Prep includes a "Script" step that lets users run R or Python scripts as part of their data flow.
- This step can be used to perform complex transformations, calculations, and predictions.
- Similar to Tableau Desktop, Tableau Prep connects to R using Rserve and to Python using TabPy.
- Users need to set up these servers and connect them to Tableau Prep to execute scripts.
- Users can import trained models from R or Python into Tableau Prep.
- The "Script" step allows these models to be applied to the data, generating predicted values as part of the data preparation process.
- Using R and Python, users can create dynamic and flexible data preparation workflows that include predictive analytics.
- This enhances the overall data preparation process by integrating advanced analytical techniques.
Real-life Scenarios/ Use cases of Predictive Analytics
Predictive analytics can be applied in numerous business scenarios to enhance decision-making, efficiency, and customer satisfaction. Here are some real-life examples:
- Customer Churn Prediction: • Scenario: A telecom company wants to reduce the number of customers leaving for competitors. • Application: By analyzing customer usage patterns, support interactions, and billing history, the company can predict which customers are at risk of churning and take proactive measures, such as targeted promotions or personalized outreach.
- Fraud Detection: • Scenario: A financial institution wants to identify fraudulent transactions. • Application: By examining transaction histories, user behavior, and other data points, predictive models can flag suspicious activities in real-time, allowing for immediate investigation and action.
- Sales Forecasting: • Scenario: A manufacturing company needs to predict future sales to plan production and manage resources. • Application: Leveraging past sales data, market trends, and economic indicators, the company can generate accurate sales forecasts to inform production schedules and supply chain management.
- Marketing Campaign Optimization: • Scenario: A marketing team wants to improve the effectiveness of their campaigns. • Application: Predictive analytics can help segment customers based on their likelihood to respond to different types of campaigns, enabling more targeted and effective marketing efforts.
- Risk Management: • Scenario: An insurance company needs to assess risk for new policy applicants. • Application: By analyzing historical claims data and applicant information, the company can predict the likelihood of future claims and set premiums accordingly.
Tableau offers a powerful platform for integrating predictive analytics into your data strategy. With its robust forecasting capabilities, seamless integration with R and Python, and advanced features in both Tableau Desktop and Tableau Prep, you can transform raw data into actionable insights. Whether you are aiming to predict future trends, optimize operations, or make data-driven decisions, Tableau equips you with the tools needed to gain the full potential of your data. To know more, connect with us: https://www.beinex.com/tableau-beinex