How AI Decision-Making is Improving Enterprise Outcomes
Blog
Share 
Understanding Data Clean Rooms
 27 February 2024
  Team Beinex
 Uncovering Data Sharing
Traditional data-sharing methods involve copying files via FTP/cloud, employing ETL pipelines, or utilising APIs. While these methods facilitate data exchange, they come with inherent limitations. Security vulnerabilities, data inaccuracies, and high maintenance costs are just a few of the challenges organisations face. Snowflake's Secure Data Sharing offers a standard shift by enabling seamless, governed access to data within the Snowflake platform.
Secure Data Sharing
Secure data sharing is ideal for granting raw data access across business units or to trusted partners for analysis. It fosters informed decision-making and facilitates data monetisation by providing secure, revocable access to valuable datasets.
Snowflake's Role in Secure Data Sharing
Snowflake's Cloud Data Platform empowers organisations to collaborate securely, driving cost savings and uncovering new insights. With Snowflake Secure Data Sharing, businesses can:
Introducing Data Clean Rooms
In the era of heightened data privacy concerns, data clean rooms emerge as a game-changer. Unlike traditional clean rooms, modern data clean rooms go beyond physical boundaries. They operate as a framework, eliminating the need to relocate data. In essence, a data clean room allows providers to dictate query rules without granting access to underlying data.
When to Opt for Data Clean Rooms
While secure data sharing suffices for many collaborations, data clean rooms shine in scenarios involving sensitive or regulated data. Regulations like CCPA and GDPR mandate stringent privacy adherence, making data clean rooms indispensable for privacy-preserving collaboration. For industries like media and advertising, data clean rooms enable personalised insights without compromising consumer privacy.
Snowflake Global Data Clean Room
Snowflake Global Data Clean Room revolutionises multi-party collaboration by safeguarding data privacy. Leveraging Snowflake's robust collaboration and governance features, it facilitates secure analysis across clouds and regions, mitigating the risk of data exposure or re-identification.
Choosing the Right Approach
In navigating data collaboration, enterprises must prioritise security and compliance. While Snowflake Secure Data Sharing suits low-risk collaborations, data clean rooms are indispensable for handling sensitive or regulated data. By embracing these innovative solutions, businesses can foster a culture of secure collaboration, driving insights and innovation while safeguarding data privacy.
Amidst the digital revolution, the proliferation of sensitive and regulated data poses a formidable challenge to traditional data-sharing methodologies and often falls short in terms of security and compliance. Enter data clean rooms - a cutting-edge solution revolutionising secure data collaboration. Representing a paradigm shift in secure data collaboration, data clean rooms are poised to redefine the boundaries of innovation in the modern era
Related Articles

The AI Powered Surge in Corporate Performance Management
We need to do more than what corporate performance management has traditionally enabled to move from strategy to strategic actions while forecasting, monitoring, and managing performance.
What is Corporate Performance Management?
Undoubtedly not a new concept, corporate performance management is often referred to as business or enterprise performance management. Gartner defines corporate performance management or CPM as “an umbrella term that describes the methodologies, metrics, processes and systems used to monitor and manage the business performance of an enterprise”. And that is indeed a broad scope as business performance does touch several areas.
Corporate performance management isn't a matter of technologies or solutions or an isolated activity or strategy—the holistic perspective is crucial. Getting strategic, financial, analytical, and business knowledge is just one aspect of the equation that will help you make better business decisions.
The four crucial techniques linked to effective performance management are listed below:
- Analysis of the chance and choose the high-impact use cases to benefit from artificial intelligence
- Automation of tasks and establishing a long-term strategy to find quick wins for an all-encompassing change with automation
- Capturing of the value by streamlining jobs to manage organisational transformation and adopt an end-to-end process view.
- Integrating Artificial Intelligence (AI) into an operational model to make a transformational impact, analyse data to make wise decisions, and develop the capacity for ongoing improvement
- The past corporate performance management only partially made it possible to foresee the future. But the present AI advancements help in real-time analysis, predictions, and future-oriented decision-making.
- With the help of artificial intelligence, pattern recognition, statistical forecasting, the analysis of vast amounts of market intelligence, decision-making can be made outside the traditional realm of historical information. When AI tracks KPIs and makes more data-based decisions, performance management can improve significantly.
- Immediate feedback Intelligent dashboards built into performance management software offer all the quantifiable metrics a management team could need to make decisions. The benefit, though, is not in the variety. It lies in the capacity to interpret and use data as changes occur in real-time throughout the entire organisation.
- Data consolidation for easy management The tools have the intelligence to gather, group, and combine data from multiple sources, be it departments, spreadsheets, or even companies.
- Make risk management simple The incorporation of tools like what-if models is a crucial benefit of CPM. By simulating the best- and worst-case situations, for example, the model equips managers to reduce risks and make wise decisions.
- Offer primary data access and feedback Managers may easily access information through performance management systems, promoting accuracy and quality.
- Ease of collaboration CPM tools are locally integrated and cloud-connected for all users to keep in sync across all departments.
- Boost the standard of talent management Recruiters and business leaders are now concentrating on employing AI-driven performance management to enhance the caliber of their hiring. It assists them in finding the appropriate talent pool and selecting the best candidates.
- Effective data analytics for problem-solving AI is a real game-changer in performance management systems and helps leaders and stakeholders make data-driven decisions and solve current challenges.
- Developing a collaborative environment Finally, businesses succeed when they concentrate on developing a collaborative environment where there is no place for hierarchy, bias, or inconsistent behaviour. AI in performance management systems will enable executives to spend more time on their employees and provide brilliant ideas.
How has AI impacted CPM?
The face of corporate performance management is changing due to artificial intelligence, among other things, in monitoring, reporting, analysis, forecasting, and analytical intelligence (as provided by analytical applications).
Historically speaking, leveraging data has improved over time, opening more opportunities to learn from the past and present and, most importantly, to comprehend and plan using the proper KPIs. This is true within the broader context of strategy and planning in a corporate performance monitoring, reporting, and analysis environment.
To enable analysis, produce measurements, and changes, AI is integrated into the performance management process. Better performance management procedures can be sped up with artificial intelligence, increasing transparency and sustaining employee interest. Furthermore, corporate performance management enables better leverage of all data in the organisation’s ecosystem and helps to achieve its strategic objectives.
Advantages of a CPM Software
Corporations must adopt process automation in the age of business management intelligence. Here are a few advantages of using a CPM system.
What does Beinex offer?
STRACT by Beinex is an indisputably efficient tool that helps it deliver optimised business performance. It allows businesses to forecast, track, assess, and identify areas for improvement across all operations. Companies can thoroughly and comprehensively analyse all relevant financial and operational metrics across various levels of the business by consolidating data and performance metrics into one centralised database and then measuring this against their strategic goals.
STRACT is a comprehensive solution with features that allow you to create much more accurate and flexible budgets, enhancing your current business and resource planning and forecasting.
Top 4 Enterprise Data Visualization Tools: A Complete Guide
What is Data Visualization?
Data visualization is the process of representing data in a graphical or spatial format, allowing for easy visual analysis without technical jargon. Unlike raw numerical data, visual representations like charts, graphs, and maps help quickly identify patterns, trends, and anomalies, facilitating faster and more accurate insights.
Benefits of Data Visualization
Understanding raw data can be challenging due to its complexity. Data visualization addresses this by:
- Simplify Data Interpretation: Converting raw data into charts and graphs makes it easier to understand underlying patterns and relationships.
- Identify Trends and Anomalies: Visual formats highlight trends and anomalies that might be missed in numerical data.
- Improve Accessibility: Data visualization makes information accessible to a broader audience, including those without strong analytical skills, thus improving data-driven decision-making across departments.
- Advanced Data Storytelling: Effective visualization techniques turn data into compelling stories that facilitate better communication and understanding.
What Are Data Visualization Tools?
Data visualization tools provide designers with an efficient way to create visual representations of large data sets. When dealing with data sets that include hundreds of thousands or millions of data points, automating the visualization process simplifies the designer's job considerably.
Key Benefits of Data Visualisation Tools
- Dashboards: To monitor and analyze key performance indicators (KPIs) and metrics in real-time.
- Annual Reports: To present data-driven insights to stakeholders in a clear and engaging manner.
- Sales and Marketing Materials: To showcase trends, performance, and forecasts to potential clients and customers.
- Investor Slide Decks: To communicate financial health and growth prospects effectively.
- General Information Interpretation: To make complex data understandable for decision-making processes in virtually any context where quick interpretation of information is necessary.
A Compact List of Top Data Visualization Tools
Here are the top enterprise data visualization tools for creating compelling visualizations:
- Tableau
- Google Charts
- Zoho Analytics
- Data Wrapper
Tableau
Tableau is a top-tier platform recognized for its user-friendly interface. It adeptly integrates data from multiple sources to create dynamic and visualisations.
Its comprehensive suite of products spans desktop applications, robust server solutions, and flexible web-hosted environments, empowering organizations to drive informed decision-making and achieve actionable insights across their operations.
Connect with us for a free demo: https://www.beinex.com/free-tableau-software
Who Should Use Tableau?
Data scientists and analysts who need to create custom dashboards and advanced visualizations will benefit from Tableau.Key Features of Tableau
• User-Friendly Interface: Easy to learn and navigate, making it accessible for all skill levels. • Mobile-Friendly: Create reports and dashboards optimised for mobile devices, allowing you to access and analyse data on the go. • High Performance: Efficiently handles large datasets, ensuring seamless analysis without performance issues. • Interactive Visualizations: Build interactive and dynamic visualisations, allowing deeper data exploration. • Integration Capabilities: Integrates well with various data sources and other business applications, enhancing data connectivity. • Real-Time Data Updates: Provides real-time data updates, ensuring you have the most current insights. • Collaboration Tools: Facilitates easy sharing and collaboration on reports and dashboards within teams. • Customizable Dashboards: Offers highly customisable dashboards to meet specific business needs and preferences. • Advanced Analytics: Supports advanced analytics features, including trend analysis, forecasting, and statistical summaries. • Security: Ensures data security with robust access controls and permissions.
Learn more: https://www.beinex.com/tableau-partnership-and-consulting-services/Google Charts
Google Charts is a free tool for creating interactive data visualisations, accessible through most web browsers. It supports various data sources, including spreadsheets and databases.
Who Should Use Google Charts?
Students, universities, and businesses needing fundamental charts will find Google Charts useful.Key Features of Google Charts
• User-Friendly Interface: Easy to use with a straightforward setup process. • Wide Range of Chart Types: Supports various chart types, including line, bar, pie, scatter, and more. • Customizable: Offers extensive customization options to tailor charts to specific needs, including colors, fonts, and annotations. • Interactive Charts: Allows for interactive elements such as tooltips, zooming, and panning. • Cross-Platform Compatibility: Ensures charts work seamlessly across different browsers and devices. • Dynamic Data Updates: Supports real-time data updates, keeping charts current with live data feeds. • Integration with Google Services: Easily integrates with other Google services such as Google Sheets and Google Analytics. • Embedding Capabilities: Simple embedding in websites and applications with a few lines of code. • Data Export Options: Provides options to export charts in various formats, including PNG, SVG, and PDF. • Open Source: Free and open source, allowing for extensive customization and community support. • Support for Multiple Data Formats: Works with various data formats, including JSON, CSV, and Google Spreadsheets. • Accessibility Features: These include features to make charts accessible to all users, including screen reader support. • Responsive Design: Ensures charts are responsive and adapt to different screen sizes and resolutions. • Powerful API: Provides a robust API for developers to create complex visualisations and integrate them into applications.
Zoho Analytics
Zoho Analytics combines business intelligence and reporting services, allowing for swift data visualisation. It is user-friendly and integrates well with other Zoho products.Who Should Use Zoho Analytics?
Analytics and sales teams, marketing teams, project managers, and more can benefit from Zoho Analytics.Key Features of Zoho Analytics
• User-Friendly Interface: Intuitive design that simplifies data analysis and visualisation. • Wide Range of Data Sources: Connects to various data sources, including databases, cloud storage, spreadsheets, and other business applications. • Advanced Analytics: Offers features such as predictive analytics, AI-powered insights, and what-if analysis. • Interactive Dashboards: Create and customise interactive dashboards with drag-and-drop ease. • Collaboration Tools: Facilitate sharing and collaboration on reports and dashboards within teams. • Embedded Analytics: Embed reports and dashboards into websites, applications, and portals. • Automated Data Sync: Schedule data imports and synchronise data regularly. • Customizable Visualizations: Provides a variety of chart types and extensive customisation options for data visualisations. • Data Blending: Combine data from multiple sources for comprehensive analysis. • AI-Driven Insights: Leverages AI to offer advanced analytical insights and pattern detection. • Real-Time Data Access: Supports real-time data integration and live dashboards. • Mobile Access: Access and interact with reports and dashboards on mobile devices. • Data Security: Ensures robust security features, including role-based access control, encryption, and compliance with industry standards. • Report Scheduling: Automate the distribution of reports through scheduled emails. • Integrations with Other Zoho Apps: Seamlessly integrate with other Zoho applications for enhanced functionality. • API Support: Provides APIs for developers to integrate analytics capabilities into custom applications. • Data Preparation Tools: These include tools for data cleaning, transformation, and enrichment.
Data Wrapper
Data Wrapper is ideal for media enterprises and allows for the quick creation of charts, maps, and plots. It is completely web-based and easy to use.Who Should Use Data Wrapper?
Data Wrapper can benefit media, news publications, government institutions and finance companies. It is especially useful for creating visually appealing and easily understandable visualisations.Key Features of Data Wrapper
• User-Friendly Interface: Intuitive and easy to use, requiring no coding skills to create professional charts and maps. • Wide Range of Chart Types: Supports a variety of chart types, including bar, line, pie, scatter plots, and maps. • Customisable Visualizations: Offers extensive customisation options for colors, labels, and annotations to match branding and presentation needs. • Responsive Design: Ensures charts and maps are responsive and adapt to different screen sizes and devices. • Interactive Elements: Allows for adding interactive elements like tooltips, hover effects, and clickable legends. • Real-Time Data Integration: Supports live data updates, enabling real-time visualisation. • Embedding Capabilities: Easily embed charts and maps into websites and blogs with simple code snippets. • Export Options: This option lets users download visualisations in various formats, including PNG, PDF, and SVG. • Accessibility: Committed to creating accessible visualisations with features that support screen readers and keyboard navigation. • Data Security: Ensures data security with robust privacy policies and compliance with industry standards. • Collaboration Tools: Allows for team collaboration with shared projects and editing capabilities. • Support for Multiple Languages: Offers multi-language support for creating visualisations in different languages. • Easy Data Import: Supports importing data from various sources, including CSV files, spreadsheets, and web links. • API Integration: Provides APIs for integrating Data wrapper with other applications and services. • Customizable Templates: Use and modify templates to maintain consistency in visualisations. • Annotation Features: Add rich text annotations directly to charts and maps to provide additional context and information.
Always Go for the Best Tool
By choosing the right data visualisation tool, organizations can discover the full potential of their data, making complex information accessible and actionable for everyone. This empowers businesses to make data-driven decisions that drive growth and innovation.
Strategic Insights with Tableau Pulse: Real-Time Insights for Every Team
Setting Up Metrics Is a Breeze
Configuring metrics in Tableau Pulse takes just minutes. Whether it’s setting up your own custom metrics or utilizing pre-defined ones, the process is straightforward and user-friendly. And once set up, the visuals, descriptions, and insights are generated automatically, enabling team members to stay updated on performance with ease.
Pro Tip: You can also customize existing metrics to meet specific goals. For example, a custom metric was developed to track interactions generated by teams in the field, with a target of reaching a high engagement level within a set timeframe. This tailored approach has streamlined the process of monitoring performance and recognizing accomplishments.
Integrating Data into the Flow of Work
Tableau Pulse effortlessly integrates data into the tools you use daily, like Slack or email, allowing you to stay informed without disrupting your workflow. Each morning, you can start your day by reviewing the Pulse Digest in Slack, which provides a snapshot of key metrics, trends, and insights.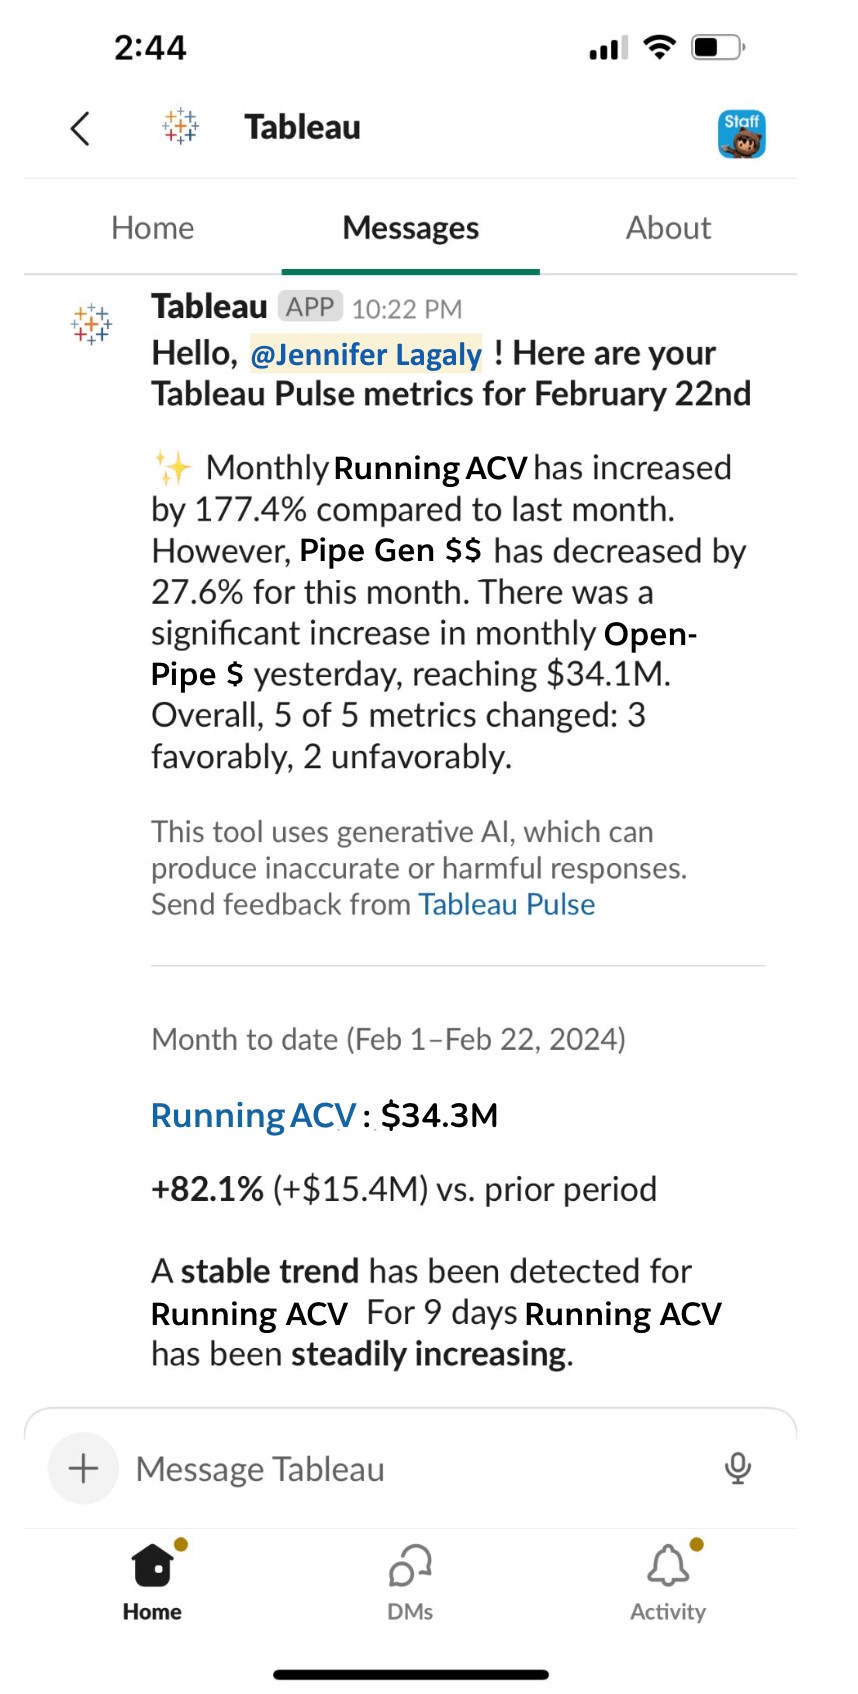 Source:https://www.tableau.com/blog/how-tableau-chief-revenue-officer-uses-tableau-pulse
Decipher Trends with Intelligent Metrics
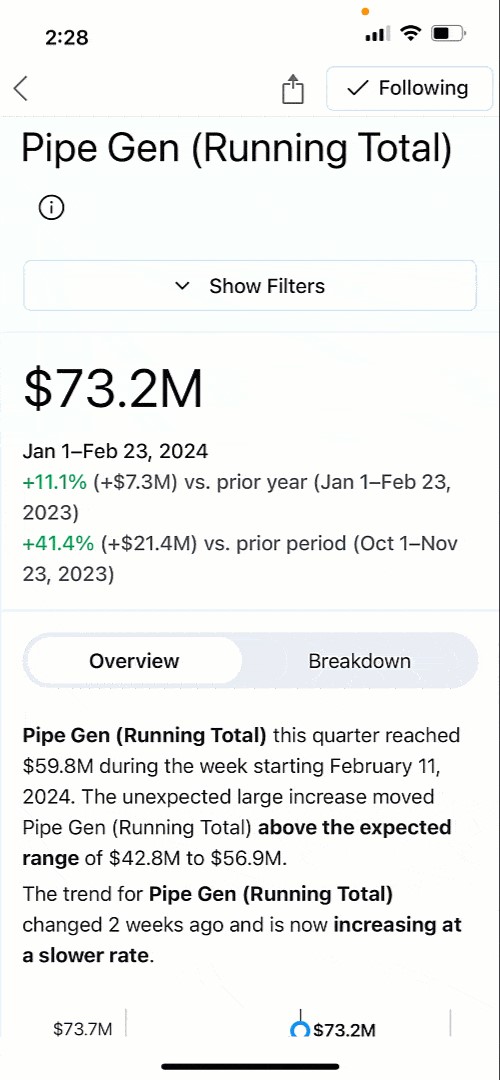
Monitoring metrics is not solely focused on tracking numbers; it also involves identifying opportunities and addressing challenges. With AI-generated summaries of key metrics like Annual Contract Value (ACV) and Pipeline Generation, Tableau Pulse helps you understand the context behind the data. The live updates ensure that any changes are reflected immediately, providing real-time insights that are always up-to-date.
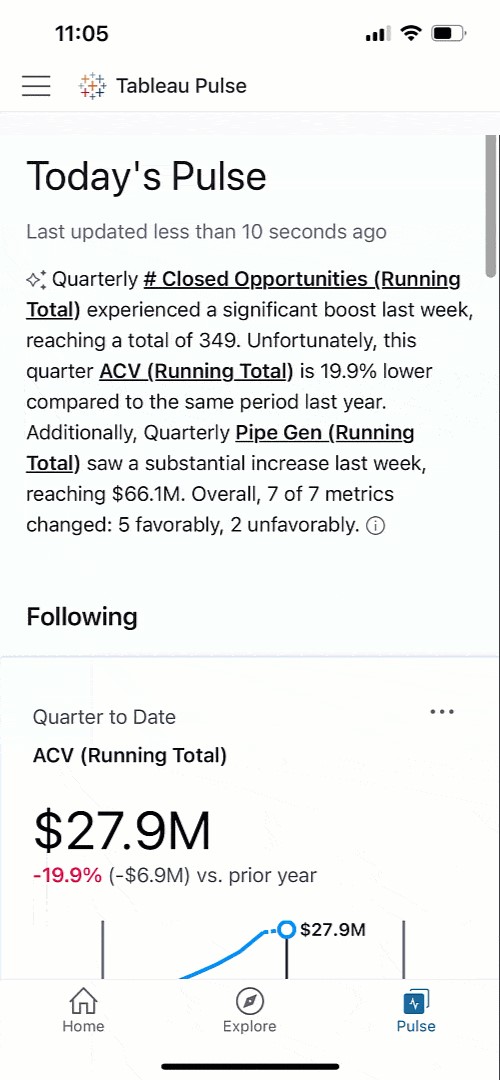
Get a Clear View of Business Performance
Tableau Pulse’s intuitive visualizations and natural language summaries make it easy to compare current and past performance, helping you identify areas that may need closer attention. For instance, if Pipeline Generation is up 10.9% year over year but showing signs of slowing, Pulse allows you to dig deeper, understand the cause, and take timely action to keep growth on track.
Tableau Pulse is available on mobile, and these insights are accessible wherever you are, making it easy to stay connected to your data on the go.
Analyze Business Segments with Precision
Tableau Pulse enables detailed analysis of various business segments, offering a clear view of how different teams and departments contribute to overall success. With just a click, you can explore revenue trends, track team performance, and understand the impact of different strategies across the organization.This level of analysis, which once required hours of manual work, is now at your fingertips. You can easily filter by segment, product, or deal size to gain nuanced insights that drive better decision-making.
Ask Smart, Data-Driven Questions
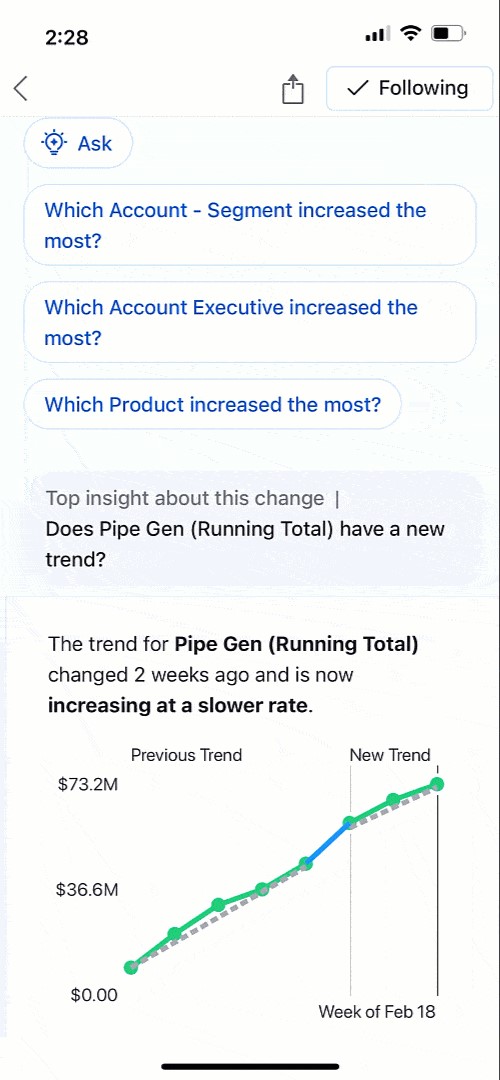
Powered by AI, Tableau Pulse does more than just report numbers. It actively helps you explore trends by suggesting relevant questions and providing insights in clear, understandable language. Whether it’s identifying which sales regions are thriving or where potential issues may arise, Pulse empowers you to make data-driven decisions with confidence.
Foster a Data-Driven Culture
Tableau Pulse is designed to be accessible to everyone, regardless of their level of data expertise. By integrating insights into tools like Slack, Pulse ensures that critical information is always at hand, promoting a culture of informed decision-making across the organization. This democratization of data means that every team member can contribute meaningfully to achieving our shared goals.
Tableau Pulse has truly transformed how we approach strategic decisions, placing personalized, contextually relevant insights directly in our workflow. It empowers everyone to be data-driven, aligning efforts towards achieving your company objectives and navigating the dynamic challenges of business with agility and insight.
Want to Transform Your Business?
Watch our demo to see how Tableau Pulse, powered by Tableau AI, can elevate your business strategy, and start your free Tableau Pulse trial today: https://www.beinex.com/free-tableau-software/
Beinex: A Great Place to Work for the Second Consecutive Time!
At Beinex, we cultivate an exceptional atmosphere for work, learning, and professional growth. Our ethos revolves around a positive culture infused with passion, creating a self-sustaining cycle of success. This unique blend makes working at Beinex both meaningful and enjoyable. The atmosphere exudes a cool vibe, where supporting and respecting each other's individuality is ingrained in our cultural fabric.
Great Place to Work Survey Scores
Our recent Trust Index© results are in, revealing an impressive score of 83! This score reflects the percentage of employees who shared positive responses (rated 4 or 5 on a 5-point scale) to the 59 statements in the survey. It serves as a testament to the trust and positivity within our workplace, showcasing the strength of our team and organizational culture.
Notably, our Trust Index© Feedback on the Credibility of Management stands tall at 85, highlighting the high level of trust and confidence our employees have in the leadership team.
The active participation and honest feedback during the survey were instrumental in achieving these outstanding scores. It's inspiring to witness the alignment of our values and the positive impact it has on the overall trust within our organization.
Here's a brief overview of the key dimensions that contributed to our success:
Respect for People:
Fairness at the Workplace:
Pride:
Camaraderie Between People:
We would also like to express our gratitude to the Great Place to Work® Institute for their rigorous assessment, helping us understand and enhance our workplace culture.
Our Journey Onwards!
Moving forward, we will continue working together to maintain and build upon this foundation of trust. Your dedication, commitment, and contributions have been instrumental in cultivating a positive workplace environment, and we are grateful for each one of you.
Let's continue our journey of success and maintain Beinex as not just a workplace but a great place to work!
About the Great Place to Work Institute
The Great Place to Work® Institute stands as a prominent global management research and consulting firm committed to empowering organisations to achieve their business objectives through the establishment of superior workplaces. Collaborating with over 10,000 organisations worldwide annually, they specialize in assisting companies in creating and sustaining High-Trust, High-PerformanceTM cultures.
During the assessment process, the institute gauged the perceptions of Beinex's employees using the Great Place to Work® Trust Index© Employee Survey. Additionally, they delved into the distinctive culture of our organisation through the Culture Brief© and Culture Audit©, offering invaluable insights that contribute to the continuous enhancement of our workplace environment.

Best Cloud Data Management Tools Fit for Businesses of All Sizes
What is Cloud Data Management?
Cloud data management refers to the framework that allows businesses to store, manage, and access their data using cloud-based services and applications. It encompasses the entire data lifecycle, from collection and storage to processing and analysis, while ensuring that data remains secure and compliant with regulatory standards. The flexibility of cloud data management allows organizations to scale up or down based on their needs and optimize data operations, which in turn leads to better decision-making and actionable business insights.
The Importance and Benefits of Cloud Data Management
Cloud data management has become a necessity in the data-centric world. Organizations are immersed with vast amounts of data, which must be efficiently stored, processed, and analyzed. Here are the key benefits:
- Scalability and Flexibility: One of the biggest advantages of cloud data management is its ability to scale as needed. Traditional data management systems often require substantial infrastructure investment, but cloud solutions allow businesses to pay only for the resources they use, making it cost-effective.
- Enhanced Data Security: With stricter regulations on data privacy (such as GDPR and HIPAA), cloud data management ensures that data is securely stored and compliant with global standards. Cloud service providers offer tools to protect data from unauthorized access and breaches.
- Improved Collaboration and Accessibility: Cloud data management allows users to access data from anywhere at any time, enabling remote work and collaboration across geographically dispersed teams.
- Disaster Recovery and Business Continuity: Cloud-based data management systems offer advanced disaster recovery options. By replicating data across multiple locations, organizations can ensure that their data is safe and accessible, even in the event of hardware failure or a catastrophe.
Cloud Data Management vs. Traditional Data Management
In contrast to traditional on-premises data management (TDM), cloud data management (CDM) provides enhanced flexibility and scalability. Traditional data management systems require a significant upfront investment in physical servers, storage, and IT staff, whereas CDM enables rapid scaling with minimal financial and physical overhead.
CDM also offers superior disaster recovery by distributing data across multiple locations, a benefit that is difficult to achieve with TDM’s centralized approach. Furthermore, CDM allows team members to access data remotely, enhancing collaboration—something that traditional systems often struggle to provide.
A Hybrid Approach to Data Management
For businesses looking to maintain control over sensitive data while leveraging cloud-based tools, a hybrid approach to data management combines the strengths of both cloud and traditional systems. A hybrid model allows organizations to store sensitive data on-premise while utilizing cloud resources for dynamic, less sensitive data. This approach offers scalability, cost-efficiency, and disaster recovery while keeping critical data secure and compliant with industry regulations.
Top Cloud Data Management Tools
Several leading cloud data management tools dominate the market, offering comprehensive solutions for businesses with various data needs. Here are the top three tools:
1. Amazon Web Services (AWS)
Amazon Web Services offers an extensive range of cloud-based tools and services that allow businesses to manage their data effectively. Notable AWS services include:
• Amazon S3: A scalable storage service designed for temporary and intermediate data storage.
• Amazon S3 Glacier: A low-cost cloud storage service ideal for long-term data archiving.
• Amazon Redshift: A fully managed data warehouse that makes analyzing large datasets using SQL simple.
• Amazon Athena: An interactive query service that allows users to analyze data in Amazon S3 using SQL.
• Amazon QuickSight: A scalable, serverless business intelligence service for building interactive dashboards.
AWS Pricing: AWS follows a pay-as-you-go pricing model, making it highly flexible for businesses of all sizes.
2. Microsoft Azure
Microsoft Azure provides a wide range of cloud-based tools for data management, making it a popular choice for enterprises. Key Azure services include:
• Azure Blob Storage: A massively scalable object storage solution for unstructured data.
• SQL Databases: Managed SQL database services that simplify data management without the need for complex infrastructure.
• Azure Data Explorer: A real-time data analytics service that can handle large datasets with minimal preprocessing.
• Private Cloud Deployments: For businesses looking for more control over their infrastructure.
Azure Pricing: Like AWS, Microsoft Azure also offers flexible pricing based on the services and resources used.
3. Google Cloud Platform (GCP)
Google Cloud Platform offers a range of cloud-based data management services, known for their strong integration with Google’s ecosystem and ease of use. Prominent services include:
• Google Cloud Storage: A fully managed service for storing unstructured data.
• Google BigQuery: A fully managed data warehouse that allows users to run SQL queries on large datasets.
• Cloud BigTable: A NoSQL database service designed for large-scale workloads.
• Google Data Studio: A business intelligence platform for building intuitive dashboards and visualizing data.
• Cloud Datalab: A powerful tool for machine learning and data science projects.
• Cloud Pub/Sub: A messaging service designed for real-time data ingestion and processing.
GCP Pricing: Google Cloud Platform offers competitive pricing with a flexible pay-as-you-go model that caters to various business needs.
Conclusion
Cloud data management is essential for modern businesses looking to stay competitive in the digital era. By offering scalability, enhanced security, improved collaboration, and disaster recovery, cloud data management tools like AWS, Microsoft Azure, and Google Cloud Platform provide a comprehensive solution to managing data efficiently and effectively. As data grows in volume and complexity, leveraging these tools will be key to driving innovation and maintaining a competitive edge.