Demo
Credits
Idea and Conceptualization: Mohamed Roshan Execution: Firdous Maqbool, Leo Mathew Voice Over: Darren EdwardTime series analysis involves examining data that changes over time or where time is a variable in the outcomes. Time isn't just a data point; it's the primary axis on which the data is based.

The main difference with time series analysis is that data is collected at regular time intervals. This helps identify patterns in the data, forming trends, cycles, or seasonal variations. With a consistent time frame of historical data, time series forecasting becomes a valuable tool for predicting future data. Time's crucial role as a variable in data across industries makes time series analysis widely applicable. Explore a few examples outlined below.
Example 1: Health Authority Enhances Patient Care
Problem: Inefficient resource use and rising costs of care and operations over time.
Solution: Utilizing data analytics, a prominent health authority conducted a comprehensive analysis of patient data. Examining historical data on patient stays, treatments, and conditions, they identified optimal times for administering medication, resulting in reduced average length of stay and cost savings for both patients and the system.
Insight: Time series analysis in healthcare extends beyond patient care to chronic disease research and epidemic-scale studies. Tracking chronic diseases over time and analyzing patient data using time series methods contribute to advancements in the field.
Example 2: Retail Giant Identifies Sales Opportunities
Problem: Slow data analysis affecting decision-making days before events.
Solution: A leading retail giant's front-office team integrated all data sources to gain a comprehensive view. Implementing time series analysis dashboards, they swiftly identified sales opportunities by forecasting against seasonal trends. Proactive measures were taken to increase ticket sales for upcoming events based on real-time insights.
Insight: Time series analysis aids retail giants in making data-driven decisions, predicting consumer trends, and strategizing marketing efforts, ensuring maximum impact.
Example 3: Manufacturing Company Improves Forecasting Accuracy
Problem: Inaccurate and time-consuming operations, manufacturing, and sales forecasting.
Solution: A manufacturing company revamped its forecasting process using time series analysis and modeling. By leveraging better data and faster analysis, they reduced analysis time from one day to one hour. Accurate forecasts in supply chain and manufacturing processes led to significant cost reductions in inventory, supply chain, labor, and capital equipment.
Insight: Time series analysis proves invaluable in optimizing forecasting models, enhancing accuracy, and streamlining operations in manufacturing.
Example 4: Marketing Analytics Scaling for Media Clients
Problem: Evolving marketing technologies making it challenging to quickly analyze information for media clients.
Solution: An analytics firm centralizes over 100 data sources using Tableau, allowing quick data retrieval and the creation of custom dashboards. Time series analysis aids in media forecasting, enabling the firm to develop insightful "what if" analyses. This empowers clients to make informed decisions about marketing investments.
Insight: Time series analysis combined with data centralization is crucial for scaling marketing analytics, providing clients with actionable insights.
Example 5: Streamlining IT Costs Through Self-Service Analytics
Problem: Business decisions based on static reports, consuming time and resources.
Solution: A retail group enables department staff with self-service analytics in Tableau, reducing IT costs by 20%. Time series analysis is applied for accurate forecasting of retail and IT trends, optimizing product orders and resource allocation.
Insight: Time series analysis aids in accurate forecasting for retail and IT trends, optimizing resource allocation, and reducing IT costs.
Example 6: Innovative Use of Data Analytics in Auditing Processes
Problem: Traditional audits were time-consuming and lacked value addition.
Solution: An organization in the energy sector used Tableau to analyze a year's worth of data, uncovering trends in financial processes. This data-driven approach revolutionized their auditing processes, providing deeper insights into the financial health of the organization.
Insight: Time series analysis proves instrumental in data-driven audits, providing a comprehensive view of historical data and uncovering trends for better decision-making.
These real-world examples showcase the versatility and impact of time series analysis across different industries, emphasizing its crucial role in data-driven decision-making and business optimization.
Understanding the role of time is crucial in data analysis, and this is where time series analysis becomes essential. Like many types of data analysis, grasping the concept of time series analysis can be challenging without a solid theoretical understanding or real-life examples. To help with this, we've compiled a list featuring real Tableau customers who have used our time series analysis tools to make tangible improvements in their organizations.
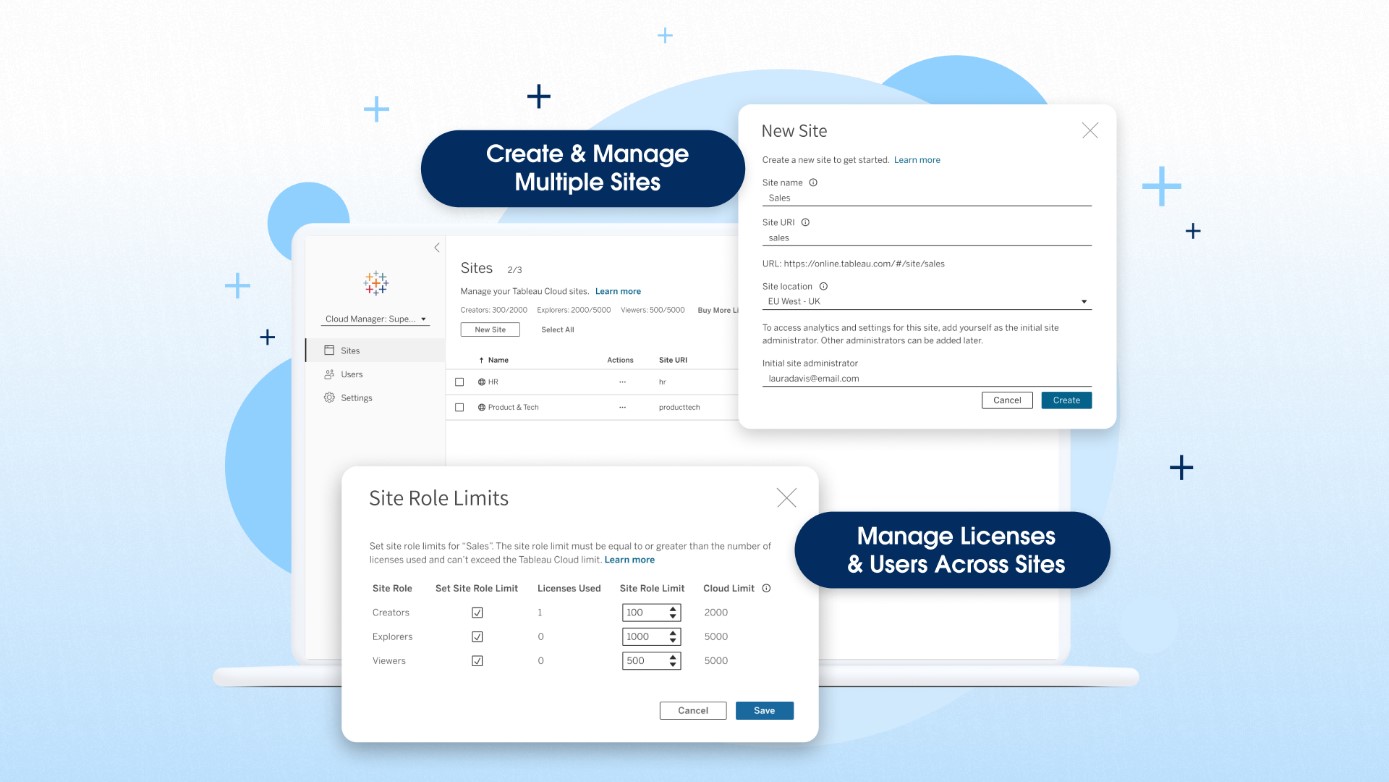
Tableau Cloud Manager is an enhancement to Tableau Cloud that allows customers to create and manage multiple Tableau sites with centralized management of licenses and users. Tableau Cloud Manager simplifies the expansion and administration of your cloud analytics environment, helps ensure you meet governance and data residency requirements and introduces new administrative efficiencies. The highlights of Tableau Cloud Manager are: 1. Expand analytics across your organization with multiple Tableau Cloud sites Tableau Cloud Manager enables Tableau Cloud customers to create and manage multiple sites in a single deployment. Additionally, Tableau Cloud Admins can deploy these sites in the regions of their choice. This functionality is particularly beneficial for global organizations with geographically dispersed teams. By allowing for the establishment of region-specific sites, Tableau Cloud Manager enables tailored analytics experiences that cater to the unique needs and compliance requirements of every team in your organization. Your Tableau Cloud edition determines site limits: • Tableau Cloud (standard): up to 3 sites • Tableau Cloud Enterprise: up to 10 sites • Tableau+: up to 50 sites 2. Effectively manage multi-site deployments Tableau Cloud Manager acts as a layer atop your Tableau Cloud sites, offering centralized management features that help you scale your analytics operations. Customers who deploy multiple sites can manage sites and license users in one place, including granting users access to multiple sites without requiring distinct licenses for each site. 3. Enhance governance with a new Cloud Admin role Tableau Cloud Manager also introduces a new Cloud Admin role, a level above the traditional Site Admin. This allows for more flexibility in how your organization manages and governs your analytics environment based on your unique needs. A smaller organization may employ the same person as a Cloud Admin and a Site Admin. For larger organizations, your Cloud Admin could be someone in IT using higher-level administrative capabilities to implement more control and coordination across your Tableau Cloud sites.
Image source: https://www.tableau.com/products/new-features
Beinex, a premier Tableau partner, offers sustainable analytics solutions to organizations and enhances their internal data visualization capabilities through customized training programs. Our team of Tableau-certified consultants consists of experienced Tableau business users who are passionate about the platform and committed to delivering an exceptional experience. Connect with us to embrace transformation: https://www.beinex.com/free-tableau-software/

Demo
Credits
Idea and Conceptualization: Mohamed Roshan Execution: Firdous Maqbool, Leo Mathew Voice Over: Darren Edward
Generative AI is a subfield of Artificial Intelligence that utilizes patterns found in vast databases to produce original content, including text, images, music, and videos. GenAI aims to provide creative and human-like outputs, in contrast to classical AI, which primarily makes predictions or classifies data. Generative AI models, such as OpenAI's ChatGPT and DALL-E, utilize sophisticated neural networks, specifically transformer architecture, to produce content that is logical and sensitive.
Industries are transforming with the help of generative AI, and its benefits are innumerable. Marketers are using it to automate campaigns and generate personalized content at scale, while writers and creators rely on it to spark ideas and accelerate production. In healthcare, it's being explored for diagnostics, treatment planning, and medical research. At its core, Generative AI isn't just a tool; it's a transformative force reshaping how we create, innovate, and solve complex problems across sectors.
The Generative AI market in the UAE is on an impressive growth trajectory. Currently, the market is estimated to have reached USD 220 million and is expected to surpass USD 1.3 billion by 2030, growing at a CAGR of over 35%. With the UAE's commitment to becoming an AI-driven economy, including initiatives such as the UAE National AI Strategy 2031, the region is emerging as a hub for AI adoption and innovation.
Generative AI is reshaping how businesses create, operate, and innovate. Here are the top ten key benefits of GenAI that you can leverage for your business:
Generative AI tools streamline content development, including blog posts, ad copy, social media content, and other types of content. Marketing teams use AI to generate drafts, brainstorm ideas, and iterate quickly. It speeds up production, improves quality through iterative feedback, and reduces the need for hiring additional staff. GenAI tools can craft landing page content or email campaigns that effectively highlight your brand's voice.
AI leverages customer and product data to generate personalized recommendations and messaging. In e-commerce, this can mean showing the right product to the right user at the right time. Personalized AI outputs enhance engagement and conversion rates.
To ensure ethical outcomes, businesses are auditing training datasets to prevent bias, which is particularly crucial in sensitive sectors such as healthcare, finance, and hiring.
AI models analyze market trends and customer behavior to guide product development. By processing vast datasets, they uncover unmet needs and help generate concepts that align with evolving consumer preferences. Many GenAI tools aid in rapid prototyping and idea testing.
Generative AI boosts threat detection by identifying anomalies in network traffic and alerting teams in real time. It excels at identifying phishing patterns, malware signatures, and unusual behaviors more quickly than manual reviews. As attackers also begin using AI, this defense becomes increasingly critical.
Generative AI is expediting drug discovery and diagnostics. AI also allows the generation of synthetic patient data, facilitating preclinical testing without privacy risks. It shortens development timelines and supports personalized medicine by analyzing genetic and clinical datasets. It can also predict diseases before they strike us.
Read Our AI in Healthcare Case Study on Cardiovascular Disease Prevention!
AI automates repetitive tasks such as summarizing reports, drafting emails, or analyzing PDFs. GenAI Tools allow teams to focus on strategic work rather than data wrangling. For example, HR teams can auto-generate job descriptions, and sales teams can craft personalized follow-up emails using AI.
Book a Free Demo of Our Document Chatbot
Generative AI chatbots offer 24/7 support, providing context-aware responses to resolve queries. Unlike traditional bots, these systems adapt in real time, understand tone, and escalate issues when necessary. Businesses utilize various tools to achieve faster resolution times and higher satisfaction scores.
By analyzing market signals, customer behavior, and industry shifts, AI uncovers opportunities for product, service, or business model innovation. It reduces risk and helps companies make data-backed decisions about where to invest. AI can forecast trends and simulate outcomes before committing resources, allowing for informed decision-making.
AI encourages traditional industries, like oil & gas, construction, logistics, and agriculture, to adopt technology by demonstrating clear ROI. Predictive maintenance, supply chain optimization, and workflow automation are just a few areas where AI proves valuable. It helps leaders make faster, more informed decisions, accelerating digital adoption.
Generative AI serves as a brainstorming partner. Designers utilize tools like Midjourney for rapid visual prototyping, while writers and product teams employ chatbots to refine their ideas. These tools provide novel starting points, enabling creators to break through mental blocks and explore new directions more quickly.
Beinex GenAI Solutions is at the forefront of transformation, helping organizations in the UAE explore the full potential of generative AI. As one of the recipients of the Dubai AI seal, Beinex is enabling businesses to innovate faster and operate smarter, from automating content generation to creating intelligent decision-making systems. Businesses that adopt it strategically are gaining a competitive edge, not just by saving time, but by reimagining what's possible.
To start, access the Superstore Dataset, available for download on Kaggle. Use Tableau Public to connect to this dataset and explore the rows and columns to understand the documented data related to the Superstore. This exploration sets the stage for the subsequent cohort retention analysis.
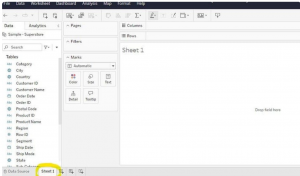
Move over to the Sheet 1 tab; this will serve as your dedicated workspace where you'll craft your visualizations. This area will be your canvas to build and design the subsequent analyses and visual representations.
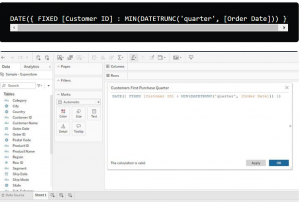
One crucial calculated field needed is the "Customers’ First Purchase Date (quarter)." Since the dataset doesn't contain the first purchase date field, a calculated field is essential. This field is derived from computations based on existing data in the dataset, enabling the identification of when each customer made their initial purchase. Calculated fields are instrumental in manipulating and analyzing data by performing calculations based on existing dataset information.

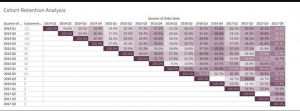
Assembling the cohort retention table involves using the calculated fields previously created to form a comprehensive table that illustrates cohort-based metrics, particularly the number of unique customers per first quarter and the retention rate.
This table allows for a clear visualization of how customer retention varies across different cohorts over subsequent periods, providing insights into the effectiveness of retaining customers acquired in specific quarters.
This step-by-step guide is incredibly detailed for constructing the cohort table in Tableau. It breaks down the process systematically, ensuring proper visualization of the cohort analysis.
In conclusion, creating calculated fields is an essential part of conducting cohort analysis in Tableau. It involves utilizing functions effectively. If you're new to Tableau functions, exploring articles or resources on Tableau functions could fill any knowledge gaps and provide a deeper understanding of their usage in data analysis and visualization. The provided Tableau article on functions might be particularly helpful for a more comprehensive understanding. 

Here is a list of a few popular business intelligence tools companies use to gain insights:
Sisense is one of those data analytics and business intelligence tools known for its efficiency and easy-to-use quality. It enables anyone within an organisation to manage massive and intricate datasets and analyse and visualise data without any outsourcing. It also combines data from various sources, such as Adwords, Google Analytics, and Salesforce. The in-chip technology helps it to process data faster than any other tool. Gartner, G2, and Dresner have recognised Sisense as a leading cloud analytics platform.
SAP Business Intelligence offers advanced analytics solutions such as machine learning, BI predictive analytics, and planning and analysis. This enterprise-level client/ server system application provides data visualisation and analytics applications, reporting and analysis, mobile analytics, and office integration.
The platform focuses heavily on Customer Experience (CX) and CRM, digital supply chain, ERP, etc. What's particularly appealing about this platform is the self-service, role-based dashboards, which allow users to create unique dashboards and applications. SAP is a robust software designed for all roles that provide many functionalities on a single platform. However, the product's complexity raises the price, so be equipped for it.
Datapine is a comprehensive business intelligence platform that makes the intricate process of data analytics accessible to non-technical users. Datapine's solution allows data analysts and business users to blend different data sources, perform advanced data analysis, build interactive business dashboards, and create actionable business insights by adopting a comprehensive self-service analytics approach.
Dundas BI is a browser-based business intelligence tool that enables users to access multiple data sources in real-time. It offers excellent visualisations in the form of tables, graphs, and charts that can be personalised and viewed on mobile devices and desktop computers. Users can easily create reports and extract specific performance metrics for analysis. Dundas aids all types of businesses and industries.
MicroStrategy is a business intelligence tool for enterprises that provides powerful and fast dashboarding and data analytics, cloud solutions, and hyperintelligence. Users can use this solution to identify trends, and new possibilities, increase productivity, etc. It can be accessed via desktop or mobile and can be connected to one or more sources.
Yellowfin BI is a business intelligence and analytics platform that combines visualisation, machine learning, and collaboration. It can quickly sort through massive amounts of data using intuitive filtering, and it is accessible from anywhere. This BI tool takes dashboards and visualisations to the next level by utilising a no-code/low code development environment.
A product of Qlik, QlikSense is a complete data analytics platform and business intelligence tool. QlikSense can be accessed from any device at any time. The user interface of QlikSense is optimised for touchscreen, which makes it a prevalent BI tool. It offers a one-of-a-kind associative analytics engine, sophisticated AI and a high-performance cloud platform, making it more attractive. An exciting feature of this platform is its Search & Conversational Analytics, enabling a faster and easier way to ask questions and discover new insights through natural language.
Zoho Analytics is an excellent BI tool for detailed reporting and data analysis. It supports automatic data syncing and can be scheduled regularly. It quickly creates a connector and formulates meaningful reports by blending and merging data from various sources using the integration APIs. It helps to quickly identify the essential details by creating ersonalized reports and dashboards with an easy editor. It also includes a distinct commenting section in the sharing options, ideal for collaboration.
Microsoft Power BI is a web-based tool that is one of the best for data visualisation. It enables users to identify trends in real-time and includes brand new connectors that allow businesses to step up marketing campaigns. Microsoft Power BI is accessible virtually from any location as it is web-based. This tool is designed to integrate apps and deliver reports in real-time dashboards.
Looker, a data discovery app, is another business intelligence tool to watch for! This unique platform is now part of Google Cloud and integrates with any SQL database or warehouse and is ideal for startups, midsize businesses, and enterprise-grade businesses. This tool's advantages include its ease of use, useful visualisations, powerful collaboration features such as easy integration with apps, flexible sharing of data and reports via email or USL, and a dependable support system.
Clear Analytics is an easy-to-use Excel-based software that can be utilised even by employees with just the essential Excel skills. It is a self-service Business Intelligence system with BI features like data creation, automation, analysis, and visualisation. Clear Analytics also functions with Microsoft Power BI, cleaning and modelling various datasets with Power Query and Power Pivot.
Tableau is a powerful BI tool that specialises in data discovery and visualisation. The software allows to quickly analyse, visualise, and share data without IT intervention. Tableau works with various data sources, including Microsoft Excel, Oracle, MS SQL, Google Analytics, and SalesForce. Users will have access to well-designed, user-friendly dashboards. Tableau also provides several products, such as Tableau Desktop (for anyone) and Tableau Server (analytics for organisations), both of which can be run locally, as well as Tableau Online (hosted analytics for organisations) and others.
Oracle BI is a business intelligence technology and application portfolio for enterprises. This technology provides nearly all business intelligence capabilities, including dashboards, proactive intelligence, ad hoc reporting, etc. Oracle is a reliable choice ideal for businesses that need to analyse large amounts of data from Oracle and non-Oracle sources. Data archiving, versioning, a self-service portal, and alerts/notifications are also essential features.
Domo is a fully cloud-based business intelligence platform that integrates spreadsheets, databases, and social media data. The platform provides visibility and analysis at the micro and macro levels, including predictive analysis powered by Mr Roboto, their AI engine. From cash balances and lists of your best-selling products by region to marketing ROI calculations for each channel, Domo has got you covered.
Cognos Analytics is a business intelligence platform powered by AI that supports the entire analytics cycle. It helps to visualise, analyse, and share actionable insights, from data discovery to data operationalisation. The data is interpreted and presented in a visually appealing report, and AI allows the discovery of hidden patterns in the data.
The use of advanced business intelligence reporting tools makes tasks simple and manageable. Business intelligence platforms are subject to change based on business needs and the advancement of technologies. Still, they have proven to be a great way to accomplish strategic goals effectively and efficiently.