How AI Decision-Making is Improving Enterprise Outcomes
Blog
Share 
The Second TUG Meetup in Cairo: The Next Step into the Realm of Tableau Users
Looking to up your game in Business Intelligence and Data Visualization? Want to explore the endless possibilities of Tableau, showcase your work, and get valuable feedback from like-minded peers? Then TUG Meetup is the right event.
The Second TUG Cairo Meetup
Beinex has sponsored the second Tableau User Group Meetup in Cairo, and we are glad to initiate a thriving community that promotes learning, growth, and networking. TUG provides the perfect platform to connect with others, exchange ideas, and gain inspiration whether you're a beginner or an expert in Tableau. At the second TUG Meetup Cairo, the participants got the opportunity to showcase their work, receive constructive feedback, and be part of a community that shares their passion for data visualisation.
Date: March 11, 2023Venue: MQR, The GrEEK Campus Downtown, Cairo Governorate 11513
Time: 2 PM to 5 PM GST.
We had a great discussion with the following eminent speakers on the topics enlisted below:
| # | Speakers | Designation | Topics |
|---|---|---|---|
| 1 | Khaled Hoza | Data Analyst Team Lead, Fawry | Analyse the performance of your customer retention strategy |
| 2 | Martina Ghali | Senior CRM Specialist, Cartona | Overview of digital marketing and get it visualised in Tableau |
| 3 | Ahmed Ismail | NLP Engineer, Agolo | Visualise your text analytics in numerous ways |
Abdelaziz Mahjoub, Data Analytics Lead Consultant, Beinex was the leader of the TUG Cairo Meetup. He is the first and only Tableau Public Ambassador in Egypt and MENA Region, Tableau public featured author, 1x #VOTD, and Tableau certified associate with practical and academic knowledge of Essential Design Principles techniques.
Initiating a New Tribe that Helps to Grow
[sc name="quote" quote="“Since my early days in the field, I struggled to get help on how to start, a lot. I know how hard it’s to fully understand a certain technology or a tool to a mastery level without proper guidance and mentoring. Here in Cairo TUG, I try my best to help other people not to find themselves in my position back then. That’s why I started Cairo TUG, to build a strong community that everyone can rely on to get help and find the proper guidance”" author="Abdelaziz Mahjoub, Lead Consultant, Analytics at Beinex Consulting,He is the master brain behind the Cairo TUG."][/sc]
The Second TUG Meetup in Cairo: The Next Step into the Realm of Tableau Users
“Since my early days in the field, I struggled to get help on how to start, a lot. I know how hard it’s to fully understand a certain technology or a tool to a mastery level without proper guidance and mentoring. Here in Cairo TUG, I try my best to help other people not to find themselves in my position back then. That’s why I started Cairo TUG, to build a strong community that everyone can rely on to get help and find the proper guidance”
“Since my early days in the field, I struggled to get help on how to start, a lot. I know how hard it’s to fully understand a certain technology or a tool to a mastery level without proper guidance and mentoring. Here in Cairo TUG, I try my best to help other people not to find themselves in my position back then. That’s why I started Cairo TUG, to build a strong community that everyone can rely on to get help and find the proper guidance”
Related Articles

Tableau AI and Tableau Pulse: Tableau's Dynamic Duo
Enter Tableau AI—the next evolutionary leap, simplifying data analysis to the point of asking a question. Powered by Einstein, Salesforce's AI, Tableau AI heralds a new frontier in effortless data exploration. Alongside this innovation comes Tableau Pulse, revolutionizing the data experience for all users within your organization, irrespective of their familiarity with data analytics.
Tableau AI
Tableau AI stands as a groundbreaking innovation, harnessing the advanced capabilities of generative AI to revolutionize and democratize the data analysis process. This next evolution of Tableau is grounded in the trusted and ethical foundations of Einstein, ensuring its reliability and safety for all users.
The true power of Tableau AI lies in its capacity to elevate every facet of the Tableau platform, driving performance, efficiency, and scalability to new heights.
Tableau AI empowers data analysts by automating analysis, preparation, and governance processes. It streamlines workflows, reduces technical barriers, and eliminates repetitive tasks. Using AI, it facilitates natural language calculations, suggests suitable visualizations, and generates data source descriptions.
Focused on aiding decision-making, Tableau AI distills meaningful insights from datasets, presenting them in plain language. It anticipates follow-up questions and helps break down data silos for effortless access to vital insights. Its conversational interface swiftly delivers essential insights, designed for both experts and non-experts in data analysis.
Tableau Pulse
Tableau Pulse introduces a transformative era in data interaction, making analytics accessible to everyone. Enabled by Tableau AI, this reimagined data experience is tailored for analytics consumers, delivering smart, personalized, and contextual insights seamlessly integrated into their workflow. It's a paradigm shift empowering every employee with the tools to make data-driven decisions effortlessly.
This evolution reshapes how individuals connect with data, fostering deeper, more meaningful engagements. Its goal? To elevate the entire organization, transcending the limitations of the 29% currently leveraging data for decision-making. Tableau Pulse is a game-changer, especially benefiting those pressed for time, seeking instant access to data for swift decisions, and desiring a deeper comprehension of the 'why' behind data, not just the 'how' and 'what.'
Experience the future of data interaction with Tableau Pulse, where insights become an inherent part of everyday workflows, empowering individuals across the organization to harness the full potential of their data effortlessly.
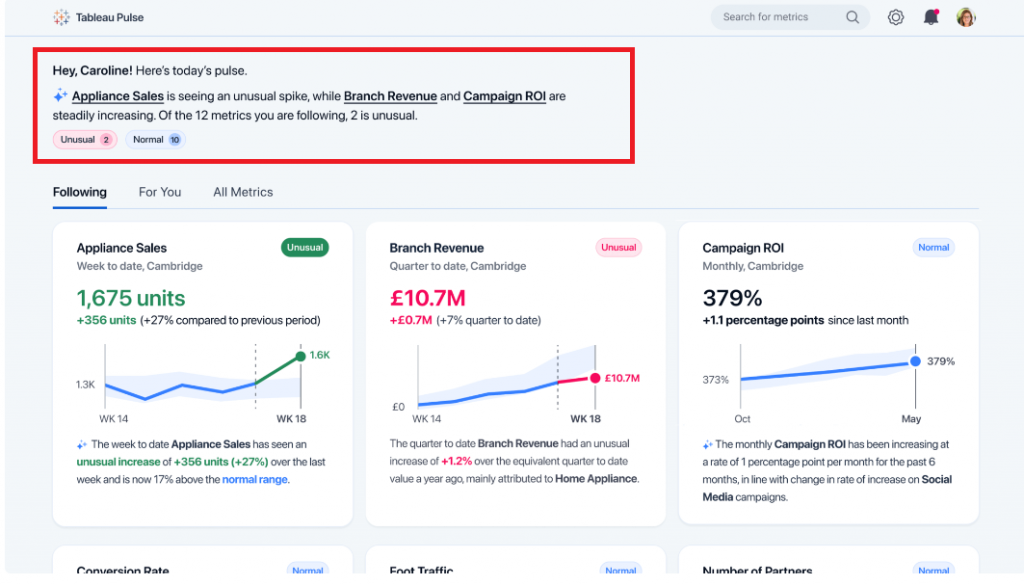
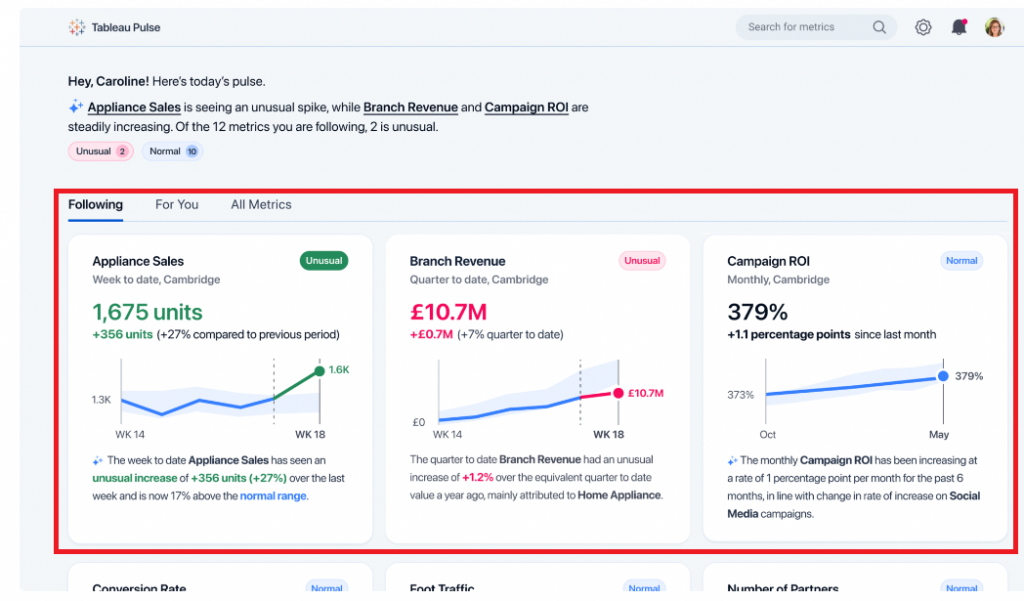
Streamline Your Focus with Metrics that Matter
Businesses grapple with vast volumes of information, often presenting reports in a standardized manner to accommodate entire teams. While this aids time-strapped analysts by minimizing the need for bespoke reports, it leaves end-users sifting through data to locate their relevant metrics—an arduous and time-consuming task.
Tableau Pulse revolutionizes this paradigm by seamlessly delivering personalized data summaries directly within your workflow. It introduces an intuitive, customized metrics homepage, allowing you to curate metrics aligned with your specific requirements. Say goodbye to the cumbersome process of filtering through multiple dashboards to find pertinent figures.
At the start of this example, Tableau Pulse presents a select set of metrics fitted to this specific user's focus.
These metrics are curated based on recent data trends identified by Tableau AI:
 Source: https://www.tableau.com/blog/tableau-pulse-and-tableau-ai
Towards the bottom of this example, Tableau Pulse showcases the KPIs that this user has actively tracked. Within this section, Tableau Pulse provides the most recent metric value, a brief visual representation of the trend, and an AI-generated insight specifically pertaining to that metric:
 Source: https://www.tableau.com/blog/tableau-pulse-and-tableau-ai
Embed Relevant Data into Your Workflow
These days, professionals juggle various applications, which poses a challenge when tracking crucial KPIs. The continual shift between disparate tools not only consumes time but also disrupts workflow continuity.
Tableau Pulse heralds a transformative shift by integrating pertinent data directly into users' existing tools. This breakthrough ensures data detachment from specific dashboards, guaranteeing access to essential metrics without workflow interruptions. Insights are seamlessly captured within the tools where users spend the most time, eradicating the risk of missing critical information due to platform discrepancies. Additionally, this integration streamlines the scalability of insights across the organization, simplifying the process of visualizing, sharing, and collaborating on data by utilizing tools already familiar to everyone within the company.

Effortless Data Interpretation
Today's data interpretation can often entail a laborious and manual process. Users invest significant time analyzing data to unveil trends and insights while navigating the labyrinth of questions to pose to their datasets. This complexity invariably impedes decision-making speed and hampers overall productivity.
Tableau Pulse redefines data utilization by automating analysis and communicating insights in easily comprehensible, natural language formats. Initially, Tableau Pulse assumes the burden of uncovering the 'why' behind the 'what.' It autonomously identifies and generates insights, predicting the queries you might raise and even suggesting questions that may not have crossed your mind. Subsequently, Tableau AI succinctly summarizes these insights conversationally. This streamlined approach facilitates faster, informed decision-making, eliminating the need for extensive manual data analysis.
In the example below, Tableau Pulse extends its capabilities to address your data inquiries using natural language. Upon delving deeper into the "Appliance Sales" metric, Tableau Pulse was queried, "What is driving change in Appliance Sales?" In response, Tableau Pulse swiftly provided a concise answer along with a visual representation elucidating the factors influencing this change.

With the introduction of Tableau AI and Tableau Pulse, Tableau is set to revolutionize the industry once more, unveiling a fresh experience tailored for analytics consumers. This innovation aims to empower every individual to embrace a truly data-driven approach. Tableau AI and Pulse are reshaping how organizations engage with data, empowering decision-making, and fostering a more data-driven future.

Snowflake for Optimizing Big Data Workloads
The Snowflake data platform is built for efficiency, scalability, and ease of use. It supports unlimited Virtual Data Warehouse clusters, enabling real-time data sharing for optimal performance. Designed with simplicity, Snowflake requires minimal management or tuning and offers limited performance tuning options. The blog gives you a walkthrough of optimizing big data workloads with Snowflake and making the most of the platform to enhance performance.
Understanding Big Data
Big data is an immensely large and diverse dataset, with structured, semi-structured, and unstructured data that expands exponentially over time. Technological advances like AI, IoT, etc., stimulate the rapid proliferation of big data. Given their increasing volume, velocity, and variety, traditional data systems can't store, process, and analyze big data. In 2021, Gartner used volume, velocity, and variety to define the attributes of big data. Volume: It indicates the high volume of big data gathered from diverse sources continuously. Velocity: It is the speed at which data is collected and needs to be processed and analyzed. Variety: It refers to the diverse nature of data (structured, unstructured, and semi-structured) collected from various sources. In addition, big data can also be defined by the following: Veracity: It is about the accuracy and quality of big data, implying the potential of data to be inconsistent, unreliable, and error-prone. Variability: It indicates the inconsistency and fluctuations in data over time. Value: It is about the relevance and usefulness of the data you collect to add value to your business. However, platforms like Snowflake, AWS, and Google Cloud help businesses manage big data at a rate needed to leverage its power. The application of big data extends to advanced analytics, predictive modeling, and machine learning, enabling businesses to make informed decisions.The Benefits of Big Data
• Facilitates informed and strategic decisions by discovering patterns and insights from analyzing big data. • Helps mitigate risks better and easily with actionable insights from analyzing voluminous data • Boosts customer experiences by deriving useful insights from diverse data, enabling the comprehension, personalization, and optimization of user experience. • Gives businesses a competitive edge and enhances agility by analyzing data in real-time and expediting the further processes with data-driven insights. • Boosts efficiency by employing big data analytical tools that generate faster insights and assist in saving costs and time. • Integrates automated, real-time data streaming with advanced data analytics to continuously gather data, discover new insights and growth opportunities.Optimizing Big Data Workloads with Snowflake
Snowflake, a cloud-based data warehousing platform, offers scalable and flexible solutions for big data workloads. Here are some of the ways in which Snowflake optimizes performance when managing big data workloads. Warehouse Scaling: By configuring several warehouses based on file size and employing auto-scale capabilities, Snowflake can help stop timeouts and boost processing speed. Snowflake provides flexible scaling options (scale up and scale out) to fit your escalating data requirements. Scaling up refers to expanding the warehouse size to manage more workloads and is ideal for data workloads needing more resources. Scaling out is about adding more warehouses to enhance capacity by distributing workloads, and it is better suited to handle multiple workloads simultaneously. Snowflake also offers a warehouse of various sizes, organized into T-shirt sizes (X-Small, Small, Medium, Large, X-Large, 2X-Large, 3X-Large, 4X-Large, 5X-Large, and 6X-Large). The range of sizes makes choosing the right warehouse for your needs seamless and allows you to scale up or down as required. Besides, Snowflake's architecture enables you to decouple storage and compute resources, that is, scale your compute and storage independently while lowering costs and optimizing performance and resource utilization. Storage Optimization: The columnar storage engine of Snowflake helps optimize storage by reducing storage costs and enhancing query performance. Besides, leveraging Snowflake's automatic compression lowers storage costs and improves data transfer times. Micro-partitions are also important, allowing for efficient storage and querying of large datasets. The storage optimization faculty of Snowflake offers a powerful and flexible foundation for efficiently managing diverse data, including structured data, semi-structured data, and unstructured. It also ensures your data is accessible and never becomes a bottleneck. Snowflake has redundant data storage; it stores multiple data copies across various servers and locations, ensuring multiple workloads can run concurrently without resource contention, and your data is always available. Query Optimization: Snowflake's query acceleration features, like query result caching and materialized views, can be harnessed to boost query performance greatly. Materialized views store data physically and precompute complex queries, boosting performance. What makes it different from the traditional views is that it offers the capability to precompute data based on materialized view queries, expediting and streamlining access to complicated data. The automation and the routine refresh capabilities ensure the data is updated, eliminating the need for manual intervention. Snowflake's materialized views offer granular control over data management and scalability, simplifying the process and enhancing flexibility compared to the traditional materialized views. Also, queries can be optimized by utilizing efficient query patterns and specifying only the columns required. Techniques like Common Table Expressions help optimize joins and subqueries. Query performance can also be optimized by filtering data early, lowering operation counts, preventing unnecessary sorts, and using window functions. Data Loading Optimization: Snowflake's bulk loading capabilities, like Snowpipe and COPY INTO, enable the efficient loading of extensive datasets, optimizing data loading. Snowflake Functions and Snowflake Tasks, the transformation and processing faculties of Snowflake, run data processing and transformation during loading. Snowpipe offers scalable and serverless architecture and facilitates real-time data ingestion, processing, and integration with platforms like Kafka. With Snowpipe, you can stream data into Snowflake in real time, enabling immediate analysis and decision-making. Dynamic Tables and Streams: Dynamic Tables and Streams in Snowflake facilitate real-time data processing and analysis. Dynamic Tables make storing and managing structured and semi-structured data flexible and scalable. Streams enable real-time data ingestion and processing. By incorporating these features, Snowflake allows users to capture, process, and analyze changing data effortlessly, assisting in real-time analytics, IoT data processing, and machine learning. Resource Optimization: Right-sizing your warehouse optimizes resources by preventing over-provisioning or under-provisioning resources, ensuring the resources are sized right for the data workload. Snowflake's auto-suspend and auto-scaling features adjust warehouse size automatically based on the demand. Monitoring and optimizing resource usage by tracking resource utilization and optimizing data workload results in enhanced performance and cost efficiency. Search Optimization in Snowflake: Snowflake Search Optimization is a robust query optimization service that helps boost the performance of specific lookup and analytical queries that retrieve small subsets of data from large datasets. When enabled on a table, the search optimization service generates a Search Access Path, an additional dataset that tracks the micro-partitions where table values are stored. This mechanism significantly enhances query efficiency by minimizing the number of partitions scanned during table operations, eliminating the need to search through all partitions. Data Partitioning: To access relevant data quickly and decrease the volume of data analyzed during queries, data can be segmented based on specific criteria or keys. Managing big data workloads and large datasets in Snowflake comes with a few challenges, such as issues in query performance and data loading delays. However, effective strategies like employing Snowpipe for efficient data loading, advanced SQL techniques, and warehouse configuration for improved query performance help overcome the challenges. The advantages of using Snowflake for big data workloads include: • Seamless scaling to manage voluminous data • Attaining faster query performance and real-time insights • Streamlining data management and lowering administrative burdens • Facilitating data democratization and self-service analyticssea • Foster business growth and competitive edge through data-driven decisions. By leveraging Snowflake, businesses can optimize their big data workloads and achieve greater scalability, performance, and cost-efficiency.
Beinex Successfully Attains Alteryx Preferred Partner Status
We are delighted to achieve this award with our relentless dedication and unparalleled expertise on the Alteryx platform. With ample product knowledge, technical expertise, and sufficient focus on customer satisfaction, we were able to demonstrate the value that we offer as a partner. Our determination and dedication aided in supplementing our customers with the power to deliver faster and better business outcomes by intelligent decisioning using Alteryx.
 Last year, we were fortunate enough to successfully transform the majority of our clients’ businesses with Analytic Process Automation by quickly automating analytics and the entire data-driven business processes, resulting in quick wins and faster returns on ROI. We were also awarded with Alteryx 2020 Partner of the Year award, Middle East.
With the preferred partner status, we will be able to make even greater collaboration with the Alteryx team, helping us extract its possibilities to the next level.
Alteryx always stands for developing data-driven technical solutions to business problems by empowering its clients to be self-sufficient in handling data analytics and continues to provide unmatched services, like;
Last year, we were fortunate enough to successfully transform the majority of our clients’ businesses with Analytic Process Automation by quickly automating analytics and the entire data-driven business processes, resulting in quick wins and faster returns on ROI. We were also awarded with Alteryx 2020 Partner of the Year award, Middle East.
With the preferred partner status, we will be able to make even greater collaboration with the Alteryx team, helping us extract its possibilities to the next level.
Alteryx always stands for developing data-driven technical solutions to business problems by empowering its clients to be self-sufficient in handling data analytics and continues to provide unmatched services, like;
-
- Collecting data from multiple sources for quick analysis and faster insight generation.
- Exploration of data from on-prem databases, the cloud, and big or small data sets, and more.
- Analysis with maps, addressing solutions to deeply understand your customers and locations.
- Augmenting your team’s analytic output to gain insights by using data without any coding or analytics expertise.
- Embracing automation to effectively communicate with your stakeholders and enable intelligent decision-making to drive better, faster business outcomes.

Alation Data Catalog: The Key to Unlocking Effective Modern Data Governance
Challenges in Data Governance
Organizations often face challenges aligning with business goals to ensure data quality, security, and visibility. Alation's Data Catalog centralized data management and enhances accessibility, helping businesses address the data governance challenges by managing data in line with the policies and standards. Some of the challenges in data governance are as follows: • Issues in Data Quality: This happens due to incorrect or insufficient data in the system, which can result in expensive errors and affect decision-making. Enterprises must follow continuous monitoring to ensure high data quality and maintain trust in data assets. • Struggling with Data Silos: For effective data governance, organizations must break down data silos as the separate storing of data across departments could hinder data accessibility and sharing, resulting in inefficiencies. • Concerns about Compliance and Security: To avoid sensitive data breaches, organizations must comply with the regulations and standards and enforce strong security measures. Ignoring the compliance requirements can result in reputational damage, legal consequences, and hefty penalties.
More About Data Catalog
A Data Catalog is a warehouse of data assets that improves comprehension, governance, discovery, use, and management of data. It helps unify extensive and intricate data ecosystems into a single hub and breaks down silos, leveraging data the right way. The centralized view of enterprise data assets provided by the data catalog allows leaders to effectively drive cross-collaboration and scale data usage. Despite being a data repository, a modern data catalog assists in making business processes more data-driven. From enhancing operational efficiency to boosting customer experience to making strategic decisions, a data catalog is equipped to make the most of the data. A data catalog facilitates business decisions by letting people locate, understand, and trust the required data. Some of the fundamental functionalities and features of a data catalog are as follows: • Managing metadata: Brings together metadata from diverse sources into a centralized platform and offers a comprehensive picture of data across your enterprise. • Automating data discovery and search: Employs advanced search capabilities (search by tags, keywords domains, natural language, etc.), AI, and ML to locate and access relevant data assets. • Ensuring data quality: Allows data customers to understand data quality and build trust in the data through documentation of quality regulations, displaying data quality metrics, and quality profiling. • Tracking data lineage: Tracks the data flow from its source to destination, mapping the critical data aspects throughout the organization during the transformation. It also includes metadata about the transformation and data assets, enabling impact analysis. • Fortifying data governance: Enables data classification to assign suitable policies for ensuring compliance with regulations.
How Alation's Data Catalog Strengthens Modern Data Governance
Companies with data catalogs are more likely to acquire and retain customers and achieve profitability than those that do not have one. The following aspects elaborate on how Alation unlocks smarter data governance with its data catalog. • Breaking down data silos and centralizing data access: The Alation Data Catalog helps businesses struggling with data silos by centralizing data access and enabling easy data discovery and retrieval from a unified platform. Centralizing facilitates collaboration between departments by eliminating barriers between them. The enhanced collaboration enables effortless sharing of data assets and insights, fostering better decision-making and collaboration. • Managing metadata: Metadata management is paramount to data governance. With Alation Data Catalog, users can access powerful metadata management capabilities to handle data regulations, relationships, and definitions effectively. It allows users to understand and gain trust and confidence in their data assets. With features like end-to-end data lineage, automated metadata harvesting, and policy enforcement, Alation ensures data accuracy, accessibility, and compliance. • Enhancing data quality through Data Profiling and Cleansing: Data quality stays crucial for any organization to ensure trustworthy analytics and reporting. The Alation Data Catalog's data profiling and cleansing tools help detect inconsistencies and inaccuracies in data, helping enterprises maintain high data quality standards. • Guaranteeing compliance and security: With the Alation Data Catalog, compliance, and security can be ensured by implementing access controls and permissions. It entails protecting sensitive and confidential information by enabling the restriction of data access based on roles. • Fortifying data security: The comprehensive audit trails and monitoring offered by the Alation data catalog are important for data security as they facilitate tracking data usage and changes over time. It also helps identify possible breaches and unauthorized access, enhancing accountability and transparency across the enterprise. • Making progress through continuous monitoring: Conducting routine audits to evaluate compliance and data quality is vital for ensuring data governance remains effective and adaptive to the dynamic requirements. Alation Data Catalog's monitoring tools offer insights into the use of data and the likelihood of serious security breaches, enabling informed decisions about policy modifications. It is important for businesses to invest in training programs for data users as they help them understand the functions of data catalog and apply the best practices. With the Alation Data Catalog, businesses can promote collaboration and maintain data integrity and safety. Alation's holistic approach to data governance builds a trustworthy and accountable culture. The Alation Data Catalog functions as a powerful enabler, equipping enterprises to thrive in a data-driven world by streamlining complex governance tasks and promoting a culture of data literacy. In partnership with Alation, Beinex equips businesses with the support to fulfill data governance requirements while streamlining implementation and saving time. Connect with us for a demo: Beinex - Beinex: Your Trusted Alation Partner in Dubai, UAE, MEA, KSA & UK for Data Intelligence

Top Ten Business Intelligence Trends
What is Business Intelligence?
Business intelligence (BI) is an analysis that uses business-related strategies and technologies to assess, process, and interpret business information. This type of information helps businesses understand the current state of their organization and make informed decisions on how to take actions that are likely to yield their intended results.
Leveraging business intelligence insights offers several benefits to employers and employees, including strengthening performance and improving efficiency. For example, insights from business intelligence metrics can help employers understand where supply chain function might be breaking down or provide a snapshot of consumer products performing above or below expectations.
Top Trends in Business Intelligence in 2024
Finding the latest trends in BI can help your organization stay competitive and maximize your ability to use your data. While trends continually shift by nature, the following areas have rapidly risen in demand and application.
1. Augmented Analytics
Augmented analytics is an approach to data analytics that employs advanced technologies such as AI and machine learning to automate data preparation, insight generation, and insight sharing.In 2023, the global augmented analytics market was valued at USD 8.9 billion, marking a significant milestone in data-driven technologies. The market is on track for impressive expansion, with estimates predicting its value will climb to USD 11.6 billion in 2024 and soar to USD 91.4 billion by 2032. This remarkable growth, reflected in a compound annual growth rate (CAGR) of 29.4% between 2024 and 2032, underscores the rising importance of advanced analytics in transforming business intelligence and decision-making processes across industries.
Here are the advantages of augmented analytics:
Advantages: • Increased Efficiency: Automates data preparation, saving up to 60% of man-hours spent on manual data processing. • Broader Accessibility: Empowers non-technical users to gain insights, reducing dependency on data specialists by 40%. • Real-World Impact: Organizations using augmented analytics report a 25% increase in productivity due to faster decision-making.
2. Natural Language Processing (NLP)
Natural Language Processing (NLP) is a confluence of computational linguistics and artificial intelligence that enables machines to understand, interpret, generate, and respond to human language meaningfully and contextually. An example of a program that utilizes natural language processing is ChatGPT. The Natural Language Processing (NLP) market is projected to reach a value of USD 36.4 billion in 2024. With a robust compound annual growth rate (CAGR) of 27.5% from 2024 to 2030, the market is expected to expand significantly, reaching a volume of USD 156.8 billion by 2030. This rapid growth highlights the increasing adoption of NLP technologies across various industries, driving advancements in AI-driven communication and analytics tools. The advantages of Natural Language Processing (NLP) within the business intelligence landscape: Advantages: • Enhanced User Engagement: Reduces the learning curve for data tools, increasing user adoption by up to 30%. • Customer Insights: Companies using NLP for sentiment analysis report a 15% increase in customer satisfaction.
3. Data Storytelling
The growing dependence on data in the corporate landscape brings forth the need for data interpretation that extends beyond traditional methods. The narrative structure is one of the primary differentiators between data storytelling and data visualization. While data visualization can provide a visual representation of what the data is saying, data storytelling explains why the data matters, providing a more comprehensive understanding of the insights. According to Gartner, by 2025, data stories will become the most common method for consuming analytics, and data storytelling will dominate BI, with 75% of these stories being automatically produced through augmented analytics techniques. Advantages: • Better Understanding: Enhances comprehension of complex data, leading to a 20% reduction in misinterpretation. • Improved Decision-Making: Organizations using data storytelling have reported a 15% increase in strategic decision outcomes.4. Self-Service Analytics
Another BI trend is self-service analytics. It is a form of business intelligence wherein end-users, such as marketing professionals, are enabled to conduct data analyses and generate reports without the direct assistance of IT or data science teams. The self-service BI market is projected to reach USD 30 billion by 2036, expanding at a compound annual growth rate (CAGR) of 8% between 2024 and 2036. In 2023, the market size was valued at over USD 18 billion. This substantial growth is driven by the increasing demand for data democratization, as organizations seek to dismantle traditional data silos and enable non-technical users to access, analyze, and extract insights from data independently. Advantages: • Time Savings: Reduces report generation time by up to 50%, allowing for faster data-driven decisions. • Empowered Employees: Decreases IT workload by 30%, enabling more focus on strategic projects.
5. Decision Intelligence
DI goes beyond traditional analytics by creating a semantic framework that incorporates business rules and context, enabling predictive analytics to generate actionable, future-focused insights. This empowers organizations to make more informed and strategic decisions, often automating routine choices and accelerating complex ones. The DI market is on a robust growth trajectory, projected to surge from $13.3 billion in 2024 to a remarkable $50.1 billion by 2030. As businesses increasingly prioritize data-driven strategies, DI stands out as a pivotal tool for enhancing decision-making agility and precision, ensuring organizations stay ahead in a competitive landscape. Advantages: • Automated Decision-Making: Increases decision speed by up to 40%, significantly reducing time-to-insight. • Enhanced Strategic Planning: Companies using DI report a 25% improvement in strategic planning accuracy.6. Predictive Analytics
Predictive analytics is an advanced form of analytics that uses historical data, statistical algorithms, and machine-learning techniques to predict future events and trends. The predictive analytics market is projected to grow by USD 38.6 billion, at a CAGR of 28.9%, between 2023 and 2028. This rapid expansion is fueled by increasing demand for data-driven decision-making, advancements in AI and machine learning technologies, and the rising adoption of predictive analytics across various sectors, including finance, healthcare, and retail. Advantages: • Proactive Decision-Making: Reduces operational costs by up to 15% through accurate demand forecasting. • Risk Mitigation: Enhances risk assessment accuracy, leading to a 20% reduction in potential losses.
7. Artificial Intelligence (AI) in BI
Another emerging BI trend is the greater infusion of AI in business intelligence. AI's ability to automate data analysis, generate insights, and predict outcomes is redefining the way organizations interact with data. The Artificial Intelligence market is projected to reach a size of USD 184.0 billion in 2024, with an expected annual growth rate (CAGR) of 28.4% from 2024 to 2030. This growth is anticipated to result in a market volume of USD 826.7 billion by 2030. AI in BI typically involves the application of machine learning algorithms and advanced analytics techniques to automate data processing and interpretation tasks. From data collection and cleaning to analysis and insight generation, AI can significantly reduce the manual workload, speeding up the entire BI process. Advantages: • Operational Efficiency: Automates 70% of data analysis tasks, freeing up resources for strategic activities. • Cost Reduction: Reduces the cost of data processing by up to 20%8. Advanced Data Visualization
Advanced data visualization goes beyond basic charts and graphs, incorporating a variety of innovative visual elements such as heat maps, geographical maps, scatter plots, treemaps, and more into the dashboard design. These elements enable the presentation of multi-dimensional data in a single view, facilitating a more comprehensive understanding of the data. The global data visualization market showcased a strong value of USD 4.5 billion in 2017, highlighting the growing demand for effectively presenting complex data. By 2023, the market is expected to surge to USD 7.7 billion, reflecting a robust CAGR of 9.47%. Advantages: • Improved Insights: Increases data interpretation accuracy by 30%. • Enhanced Collaboration: Boosts cross-departmental collaboration by 25% through shared visual insights.
9. Mobile BI
Mobile business intelligence (BI) involves the use of mobile devices to access BI applications and data, enabling decision-makers to stay informed and make decisions, irrespective of their location. The global mobile business intelligence market, valued at USD 13.8 billion in 2023, is expected to grow at a CAGR of 15.3%, reaching USD 51.5 billion by 2032. Advantages: • Increased Accessibility: Provides real-time data access, enhancing decision-making speed by 35%. • Boosted Productivity: Enables on-the-go analysis, increasing productivity by 20%.10. Ethical Data Governance
The last BI trend on the list is ethical data governance, which addresses policies, procedures, and structures that ensure data quality and security, and ethical considerations related to data collection, processing, and use. The global data governance market is projected to reach USD 4.1 billion in 2024 and is expected to grow at a CAGR of 18.5% over the next decade, reaching USD 22.5 billion by 2034. The central principle behind Ethical Data Governance is respecting individual privacy and rights in all data activities. It involves implementing practices that ensure informed consent, data anonymization, and stringent access controls, among others, to protect individual privacy and prevent data misuse. Advantages: • Compliance Efficiency: Reduces compliance-related costs by up to 25%. • Increased Trust: Builds customer trust, leading to a 10% increase in brand loyalty.
Tableau in Action: Leveraging Latest BI Trends
Tableau integrates the latest BI trends into practical applications, enhancing decision-making and data insights. Let’s examine how some of the top BI trends are applied within Tableau. Here are a few examples:
- Augmented Analytics: With Tableau Einstein Discovery, companies can automate insights and speed up decision-making, especially in retail and finance.
- Natural Language Processing: Tableau’s NLP system allows users to explore data using simple language, enabling faster data processing without coding.
- Data Storytelling: Story Points help craft compelling narratives, increasing stakeholder engagement in areas like marketing and sales.
- Self-Service Analytics: Tableau enables business users to independently explore data, reducing IT workload and accelerating decisions in finance and supply chain.
- Predictive Analytics: Integrating with Einstein Discovery, Tableau’s predictive capabilities help industries like healthcare forecast trends and optimize operations.
- Mobile BI: Tableau’s mobile app allows for real-time access to data, improving productivity for on-the-go teams like sales.