How AI Decision-Making is Improving Enterprise Outcomes
Blog
Share 
TABLEAU 2019.3 ما الذي ينتظرك؟
 3 February 2021
  Team Beinex
 TABLEAU 2019.3 ما الذي ينتظرك؟
لطالما كانت مهمة تابلو تطوير وتقديم ما يطلبه العملاء. مع أحدث إصدار منTableau 2019.3 (في النسخة التجريبية الآن) ، فقد أظهر العديد من الميزات المثيرة مثل تضمين Askdata ورسالة الصيانة واستخراج التشفير في REST والمزيد. دعونا نلقي نظرة على بعض هذه المميزات المنتظرة.
تحسينات Askdata
أحب أن أرى متى يستمع تابلو إلى ملاحظات العملاء ويواصل العمل على تلك الطلبات. Askdata هي واحدة من أكثر الميزات التي يتم انتظارها في الإصدارات السابقة لخادم تابلو وقد تساءل العملاء عما إذا كان يمكن تضمينها في بوابات أخرى. باستخدام هذا الإصدار، يمكننا تضمين Ask Data في بوابات الشركة الأخرى والسماح للأشخاص بطرح الأسئلة.

استخراج التشفير في REST
توفر سحابة تابلو بالفعل تشفير وحدة التخزين في حالة الراحة ونحن نعلم ذلك بالفعل. الآن مع خادم تابلو ، ستتوفر لديك المرونة في الحصول على التشفير في REST للمقتطفات. يمكن لمسؤولي الخادم فرض تشفير جميع المقتطفات على مواقعهم أو السماح للمستخدمين بتحديد التشفير لمقتطفاتهم المنشورة.

يتيح ذلك خيارات متعددة للتفعيل. يمكننا الحصول عليها لجميع المقتطفات أو السماح للمستخدم بتحديد المقتطفات التي يجب تشفيرها.
مرفق PDF للاشتراكات
يبدو الأمر بسيطًا جدًا. لكن إرفاق pdf أثناء إرسال الاشتراك لم يكن أبدًا مهمة سهلة. تابلو جعل الأمر سهلاً.

أثناء إنشاء الاشتراك ، يمكنك ذكر ما إذا كان يجب أن يكون صورة أو ملف PDF أو كليهما.
ترقيات خادم تابلو بدون كلمة مرور ، إضافة NODE
باعتباري متخصصًا في الخوادم ، فأنا أعلم كم هو مضجر إدخال كلمة المرور في شاشة موجه الأوامر حيث لا ترى أي أحرف تتم كتابتها. في كثير من الأحيان تسير الأمور بشكل خاطئ ويجب علينا إعادة بدء العملية. مع 2019.3 ، يمكننا ترقية خادم تابلو إلى الإصدار التالي دون إدخال كلمة المرور يدويًا أو يمكننا إضافة NODE جديدة بدون كلمة مرور.

لم تعد إضافة NODE جديدة إلى الكتلة تتطلب اسم المستخدم / كلمة المرور ، إذا كان ملف التمهيد الذي قمت بإنشائه في آخر ساعتين.
قم بالتصدير إلى الجهة التى تريدها
عندما نقوم بتصدير ملف ما قد يحتوى التصدير في صيغة باوربوينت على جميع الأوراق وأحيانًا لا نحتاج إلى ذلك. إذا كنت مستخدمًا يريد تصدير أوراق معينة في المصنف ، فإن هذه الميزة أصبحت متاحة. الآن لديك خيار تحديد الأوراق التي تريد تصديرها.

والعديد من الإمكانات الأخرى مثل صفحة نتائج البحث الجديدة ، وعوامل تصفية السياق على الويب ، وتحسينات مشاركة المحتوى ، ولغة المنتج الجديدة الإيطالية، وما إلى ذلك. بينيكس هى مؤسسة تحويل رقمي جذورها ممتدة في مجالي الأفكار والابتكار وتشهد صحيفتنا بخدمة عملاء لا مثيل لها. مهمتنا هي تطوير طريقة عمل الأفراد والمنظمات مع البيانات من خلال الابتكار والخبرة.
إذا كنت مهتماً بمعرفة المزيد عن أحدث إصدارات تابلو وحالات الاستخدام، يرجى التواصل معنا على training@beinex.com/ info@beinex.com
و سيسعدنا أن نقوم بترتيب نسخة تجريبية من تابلو وتدريب لك ولطاقم شركتك.
الميزات الموضحة أعلاه هي حاليًا في إصدار تجريبي وقد تكون متاحة أو غير متوفرة في الإصدار الفعلي.
-
Related Articles
An Ultimate Guide to All the Tableau Certifications
Top 4 Benefits of Tableau Certification
Tableau certification offers numerous benefits. It is a valuable investment for professionals looking to excel in the field of data visualisation and analysis.
Here are the four ways Tableau certification can help you:
Let’s deep-dive:
1. Enhanced Professional Credibility
Achieving Tableau certification demonstrates your expertise and proficiency in using the Tableau platform. It enhances your professional credibility and sets you apart from others in the BI realm. Employers and clients value certified professionals as they have proven their competence in leveraging Tableau for data visualisation and analysis.
2. Expanded Career Opportunities
Tableau certification opens doors to a wide range of career opportunities. Many organisations seek professionals with Tableau skills to help them effectively analyse and visualise their data.
With Tableau certification, you become a desirable candidate for job roles such as:
3. Improved Skills and Knowledge
The process of preparing for Tableau certification equips you with in-depth knowledge of Tableau's features, functionalities, and best practices. You gain hands-on experience in creating interactive dashboards, working with various data sources, and leveraging advanced analytics capabilities. This knowledge enhances your ability to leverage Tableau effectively in real-world scenarios.
4. Increased Efficiency and Productivity
Tableau certification equips you with the skills to efficiently utilise Tableau's tools and techniques. You learn how to quickly analyse and visualise data, identify insights, and communicate findings effectively. This improves your productivity, allowing you to quickly deliver impactful data visualisations and insights.
List of Tableau Certifications
By pursuing Tableau certifications, individuals can showcase their proficiency and specialisation in various Tableau-related roles, from desktop usage to server administration, data analysis, consulting, and architecture. Each Tableau certification offers a unique opportunity to advance one's career and make significant contributions in the field of data visualisation and analytics using Tableau.
Tableau offers five certifications:- Tableau Desktop Specialist Certification
- Tableau Server Certified Associate Certification
- Tableau Certified Data Analyst Certification
- Tableau Consultant Certification
- Tableau Architect Certification
Let's dive deep into more details:
1. Tableau Desktop Specialist Certification: This certification validates foundational knowledge and skills in using Tableau Desktop. It demonstrates proficiency in tasks such as connecting to data sources, creating basic visualisations, and implementing best data organisation and formatting practices.
2. Tableau Server Certified Associate Certification: It focuses on Tableau Server, a platform for publishing, sharing, and collaborating on Tableau visualisations. It confirms expertise in tasks like managing user access, publishing dashboards, and administering Tableau Server to ensure optimal performance and security.
3. Tableau Certified Data Analyst Certification: It is designed for individuals specialising in data analysis using Tableau. It certifies advanced skills in data exploration, applying statistical techniques, and creating insightful visualisations to uncover valuable insights and drive data-driven decision-making.
Popular Tableau Partner Certifications
1. Tableau Consultant Certification: The Tableau Consultant certification is for professionals who provide consulting services and guidance on Tableau implementation and utilisation. It demonstrates expertise in understanding business requirements, designing compelling data visualisations, and offering strategic recommendations to optimise Tableau deployments.
2. Tableau Architect Certification: The Tableau Architect certification is aimed at individuals responsible for designing and architecting Tableau solutions for organisations. It validates skills in data modelling, performance optimisation, and scalable Tableau infrastructure design to ensure efficient and robust implementations.
Tableau Certification Cost
Source: Tableau
List of Job roles for Tableau Professionals
- Tableau Consultant
- Data Analyst
- Business Analyst
- Business Intelligence Analyst
- Business Intelligence Developer
- Business Intelligence Manager
Why Beinex
If you are searching for the right place to start your Tableau training, Beinex can be your perfect choice. Our globally trained subject matter experts can assist you in catering customised training that suits your schedule. So, wait not! Get in touch with us!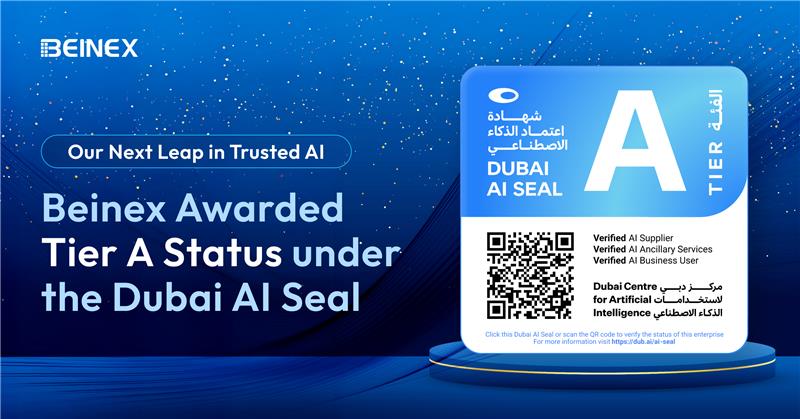
Beinex Advances to Tier A Status of Dubai AI Seal: Leading with Trust and Impact in AI Excellence
Beinex has achieved a Tier A status under the prestigious Dubai AI Seal, awarded by the Dubai Centre for Artificial Intelligence (DCAI) and Dubai Future Foundation (DFF). This upgrade marks a significant advancement in Beinex's AI journey, reflecting our commitment to building trusted, responsible AI solutions that align with Dubai's vision for ethical and future-ready innovation.
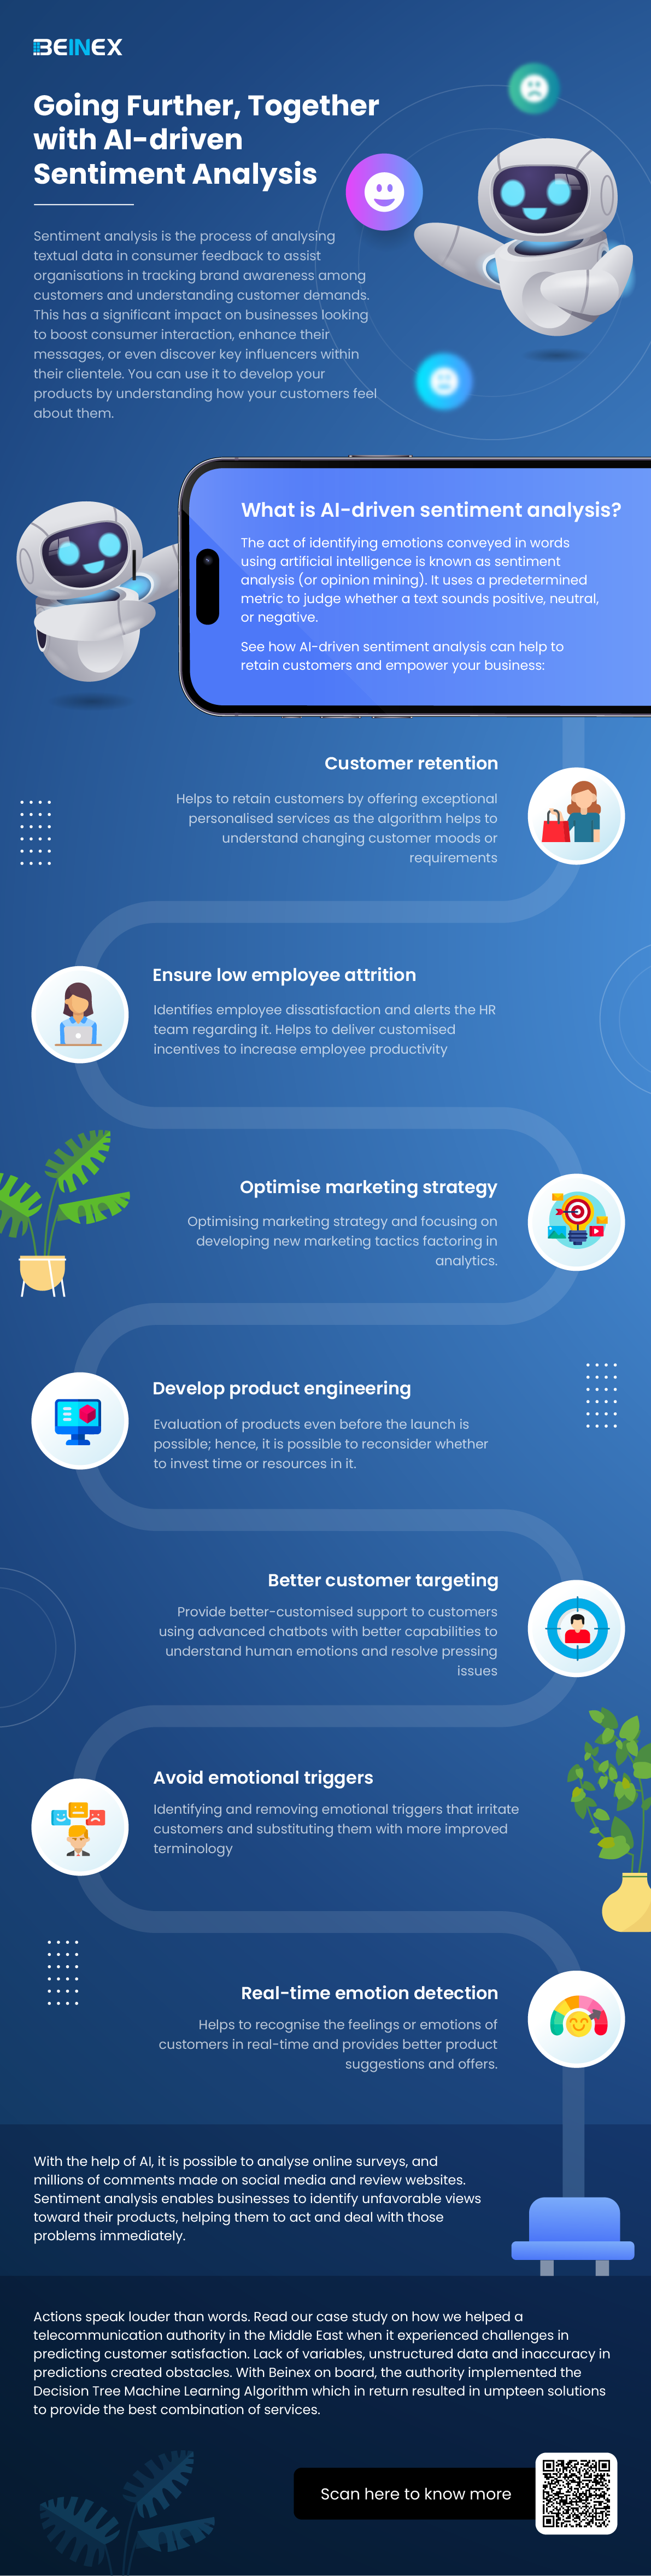
Going Further, Together with AI-driven Sentiment Analysis (Infographics)

Predictive Analytics in Tableau: A Crystal Ball for Business Success
What is Predictive Analytics?
Predictive analytics is a branch of advanced analytics that uses historical data, statistical algorithms, and machine learning techniques to identify the likelihood of future outcomes based on historical data. The primary goal is to go beyond knowing what has happened to provide the best assessment of what will happen in the future.
Benefits of Predictive Analytics
- Enhanced Decision Making: Make informed decisions based on data-driven insights rather than gut feelings.
- Cost Savings: Optimize resources and reduce waste by predicting demand and managing inventory effectively.
- Risk Management: Identify potential risks and take preventive measures to mitigate them.
- Improved Customer Satisfaction: Anticipate customer needs and preferences, leading to better products and services.
Predictive Analytics Techniques
Predictive analytics techniques offer a wide range of applications powered by various types of models that generate valuable insights. To determine the best predictive analytics techniques for your organization, start with a clearly defined objective. Once you know the specific question you want to answer, you can select the most suitable model.
List of Predictive Analytics Models
- Regression Models: Used to predict continuous outcomes.
- Classification Models: These models categorize data into predefined classes.
- Clustering Models: Group similar data points together based on defined criteria.
- Time Series Models: Analyze data points collected or recorded at specific time intervals to forecast future values.
1. Regression Models in Predictive Analytics
Regression models estimate the relationship between variables, tracking how independent variables impact dependent variables to predict future outcomes. These models range from simple (one independent and one dependent variable) to multiple linear regression (multiple independent variables). Various regression techniques can be applied based on the specific use case.
By defining variable relationships, organizations can conduct scenario or 'what-if' analysis, testing how changes in independent variables affect outcomes.
Application of Regression Models
For example, a company might use a regression model to analyze how product qualities influence purchase likelihood, such as identifying a correlation between blue shirts and higher sales. These insights help refine marketing strategies and product development, optimizing future performance.
2. Classification Models in Predictive Analytics
Classification models categorize data based on historical knowledge. Using a labeled training dataset, the classification algorithm learns correlations between data and labels and then categorizes new data. Popular techniques include decision trees, random forests, and text analytics.
These models are highly adaptable and can be retrained with new data, making them useful across various industries.
Application of Classification Models
For example, banks use classification models to detect fraudulent transactions. By analyzing millions of past transactions, the algorithm identifies patterns indicative of fraud and alerts customers to suspicious activity.
3. Clustering Models in Predictive Analytics
Clustering models group data based on similar attributes. Using a data matrix that associates items with relevant features, the algorithm clusters items with shared features, uncovering hidden patterns. Organizations use clustering models to group customers for personalized targeting strategies.
Application of Clustering Models
A restaurant might cluster customers by location and mail flyers only to those within a certain driving distance of a new location.
4. Time-series Models in Predictive Analytics
Time series models analyze data points in relation to time, making time one of the most common variables in predictive analytics. These models use historical data to predict future metrics. For example, analyzing data from the past year can help forecast the upcoming weeks.
Time series analyses are versatile, used for applications like seasonality analysis (predicting how assets are affected by certain times of the year) and trend analysis (determining asset movements over time).
Application of Time-series Models
Forecasting sales for the next quarter, predicting store visitor numbers, or even determining peak flu seasons.
Predictive Analytics with Tableau
Tableau empowers users to not only visualize their data but also to gain actionable insights through advanced predictive capabilities. Whether you're looking to forecast sales, predict customer behavior, or optimize business operations, Tableau is the right choice.
3 Ways to do Predictive Analytics in Tableau
1. Forecasting in Tableau Desktop
Tableau Desktop offers robust forecasting features that allow users to make data-driven predictions effortlessly. Using exponential smoothing models, Tableau enables you to forecast future data points based on historical trends. Here’s what you can do: Let’s explore the ways to forecast data in Tableau Desktop: • Creating a Forecast: Users can add a forecast to a view by simply dragging a time dimension to the Columns shelf and a measure to the Rows shelf. By right-clicking on the view and selecting "Show Forecast," Tableau generates a forecast based on the selected model. • Customizing Forecasts: Forecast settings can be customized to adjust the prediction length, forecast model, and season length. Users can access these settings through the "Forecast Options" dialog box. • Evaluating Forecasts: Tableau provides a forecast description that includes details about the model, prediction intervals, and underlying statistics. This helps users understand the reliability and accuracy of their forecasts. • Visualizing Forecasts: Forecasts are visualized as shaded areas or lines on the chart, making it easy to compare predicted values with actual data.
2. Bringing R/Python Calculations into Tableau
Integrating R and Python into Tableau Desktop enhances its analytical capabilities, allowing users to perform complex statistical analysis and machine learning tasks. Users can create calculated fields using MODEL calculations, or by using SCRIPT functions that include R or Python scripts to perform custom calculations. These scripts can be used for various purposes, such as regression analysis, clustering, and predictive modeling. Tableau connects to R using Rserve and to Python using TabPy.
3. How to Do Predictive Analytics with Tableau Prep
Tableau Prep enhances your data preparation process by integrating with Einstein Discovery, Salesforce's AI-powered analytics tool. This integration allows you to infuse your data workflows with advanced predictive capabilities. • Einstein Discovery in Tableau Einstein Discovery, part of Salesforce's suite of AI (Artificial Intelligence) tools, is integrated into Tableau to provide advanced predictive analytics capabilities. In Tableau Prep, Einstein Discovery can be used to build and integrate predictive models directly within the data preparation workflow. This feature is available in Tableau Desktop as well. • Generate predicted values by integrating R/Python in Tableau Prep Tableau Prep allows for the integration of R and Python to perform advanced data transformations and generate predicted values.
Here's how you can do it: • Script Steps:
- Tableau Prep includes a "Script" step that lets users run R or Python scripts as part of their data flow.
- This step can be used to perform complex transformations, calculations, and predictions.
- Similar to Tableau Desktop, Tableau Prep connects to R using Rserve and to Python using TabPy.
- Users need to set up these servers and connect them to Tableau Prep to execute scripts.
- Users can import trained models from R or Python into Tableau Prep.
- The "Script" step allows these models to be applied to the data, generating predicted values as part of the data preparation process.
- Using R and Python, users can create dynamic and flexible data preparation workflows that include predictive analytics.
- This enhances the overall data preparation process by integrating advanced analytical techniques.
Real-life Scenarios/ Use cases of Predictive Analytics
Predictive analytics can be applied in numerous business scenarios to enhance decision-making, efficiency, and customer satisfaction. Here are some real-life examples:
- Customer Churn Prediction: • Scenario: A telecom company wants to reduce the number of customers leaving for competitors. • Application: By analyzing customer usage patterns, support interactions, and billing history, the company can predict which customers are at risk of churning and take proactive measures, such as targeted promotions or personalized outreach.
- Fraud Detection: • Scenario: A financial institution wants to identify fraudulent transactions. • Application: By examining transaction histories, user behavior, and other data points, predictive models can flag suspicious activities in real-time, allowing for immediate investigation and action.
- Sales Forecasting: • Scenario: A manufacturing company needs to predict future sales to plan production and manage resources. • Application: Leveraging past sales data, market trends, and economic indicators, the company can generate accurate sales forecasts to inform production schedules and supply chain management.
- Marketing Campaign Optimization: • Scenario: A marketing team wants to improve the effectiveness of their campaigns. • Application: Predictive analytics can help segment customers based on their likelihood to respond to different types of campaigns, enabling more targeted and effective marketing efforts.
- Risk Management: • Scenario: An insurance company needs to assess risk for new policy applicants. • Application: By analyzing historical claims data and applicant information, the company can predict the likelihood of future claims and set premiums accordingly.
Tableau offers a powerful platform for integrating predictive analytics into your data strategy. With its robust forecasting capabilities, seamless integration with R and Python, and advanced features in both Tableau Desktop and Tableau Prep, you can transform raw data into actionable insights. Whether you are aiming to predict future trends, optimize operations, or make data-driven decisions, Tableau equips you with the tools needed to gain the full potential of your data. To know more, connect with us: https://www.beinex.com/tableau-beinex
Agriculture and the Internet of Things: The Present and the Future
. A farmer must be knowledgeable about soil, climate, and market. If something goes wrong with any of these areas the result will be devastating. This is where one of mankind’s biggest inventions, the Internet, offers the most reliable assistance. The Internet of Things has a plethora of devices that can make the work of a farmer far easier and more productive.
Smart Sensors
Smart sensors are the number one in a huge list of IoT devices being used in agriculture. These devices can be used to gather data about various aspects of agriculture like the humidity, acidity or mineral contents of the soil. Earlier these kinds of knowledge were something that farmers were supposed to gain after many years of experiences of both gain and loss. Or they had to depend on time taking and distant laboratories. But even a lab test had a limited chance of being hundred percent accurate as the soil’s quality could change in the blink of an eye. Smart sensors can provide the farmer with accurate data in real time. The data collected can precisely calculate and predict many changing or evolving aspects like the humidity content of the soil. These data can help decide:
- The crops to be planted
- The manures to be used
- The amount and timing of watering
- The market price for the final product
Drones
Next in the line is the use of drones. These can be used to:
- Observe vast areas and collect important information that can help decide the most efficient methods of cultivation.
- Provide the farmer with a bird’s eye view, thereby reducing the time and effort wasted in surveying the land personally.
- Assist in remote application of pesticides and herbicides.
- Track the cattle or scrutinize their health.
The data collected by sensors and drones can be used to create a plan through which the farmers can guarantee a good output with minimum input and loss. This will reduce a great percentage of both financial and manual investment. Besides, instead of depending on one’s gut feelings, a farmer can take a multitude of important decisions with scientifically backed technology. IoT devices can be easily operated by the farmers by connecting it to a laptop or mobile phone. There are various apps that are already very popular for providing agricultural data. There are also various government backed projects aimed at collection of data, providing online solutions and even arranging financial support for the smart framer.
Smart Greenhouses
Another IoT contribution is Smart Greenhouses. Greenhouses always contain plants which are out of their natural habitat and therefore need extra care. IoT enabled greenhouses can help:
- Monitor the procedures of watering
- Adjust the humidity inside
- Analyse and provide proper lighting
- Ensure proper balance in delicate matters like the level of carbon dioxide, temperature, etc.
- In disease control by providing a close watch on all the plants’ vitals.
Such precise and high level of attention makes sure that there is no contamination in the greenhouse environment that could lead to spread of diseases. It can also help in detection or prevention of theft, which is a big risk especially if the plants are of rare or protected species.
Livestock Management
IoT in livestock management is bringing about revolutionary changes. With the spread of COVID-19, it is now a very crucial requirement that the livestock are healthy throughout their life. Even a small disease in the animal could turn out to be dangerous for the human who finally consumes it. Also spread of diseases in small animals like poultry can lead to devastatingly large loss for the farmer. Smart devices can help:
- Track the vitals of each animal or bird through devices which are wearable.
- Alert the farmer of even slight variations in the vitals via SMS, notifications, etc.
- Administer medicines at the correct time, to any number of animals without having to keep manual tabs
All these crucial routines help in keeping diseases in check and thus reduce livestock loss.
There are many more IoT powered devices that are revolutionizing the field of livestock management like Geo-tagging and Geo-fencing.
- Geo-tagging: It is used to locate the cattle that has strayed away from the herd or gone missing. Geo-tags are especially useful in case of natural calamities like flood, tsunami, landslide, etc. For example, the farmers of Kerala in South India used geo-tags to locate their animals that had either gone missing or died in the flood of 2018.
- Geo-fencing: It is another popular method and it uses GPS to monitor and keep the cattle within a boundary without actual fencing. This can help in detecting cattle theft or even wild animal attacks on the livestock.
The Limitations and Solutions
IoT is already here to stay in the fields of agriculture, and there is more to come. But like anything else IoT in agriculture has certain cons. These limitations can thankfully be eliminated.
| Limitations | Solutions |
|---|---|
| The data that is being collected by the various devices is stored on cloud. So the farmers are required to have a basic know-how of data analyzing and even device maintenance. |
|
| IoT devices need a lot of investment and the farmers might find it difficult to find funds for them. |
|
| Another area that requires improvement is the availability of fast internet connectivity. Internet is still something expensive or even unavailable in many parts of the world. There are places too remote to have net access. | These limitations are being dealt with and hopefully can be improved with the help of technologies like space-based internet systems. |
The Future
The agriculture IoT market is estimated to grow from USD 11.4 billion in 2021 to USD 18.1 billion by 2026 at a CAGR of 9.8% during 2021-2026, as per ResearchAndMarkets.com.
A few insights can be:
- Precision Aquaculture: The agriculture IoT market for the precision aquaculture application segment is projected to register the higher CAGR during the forecast period, by application. Increasing demand for real-time tracking of fishing activity is the major reason behind the high growth of the agriculture IoT market in aquaculture farm monitoring applications.
- Production Planning: The production planning stage segment of the agriculture IoT market is estimated to register the largest market share in 2026, by the farm production planning stage.
- Small Farm Segment: The agriculture IoT market for small farm segment is projected to register the higher CAGR during the forecast period, by farm size. Small farms are expected to adopt automation and other advanced technologies at the highest rate in the coming years due to the reducing cost of farm automation equipment and advancements in technology that make it more feasible to deploy automation tools even on smaller farms to achieve high returns on investments.
- Automation & Control Systems: The automation and control systems for the precision farming hardware segment of the agriculture IoT market is estimated to register the largest market share in 2026, by hardware type. The increasing demand for drones/unmanned aerial vehicles (UAVs) is a major reason behind the high growth of the market for automation and control systems.
APAC is likely to be the fastest-growing agriculture IoT market during the forecast period. Agriculture IoT techniques are expected to be adopted at a high rate in the region. This region consists of emerging countries such as India, China, and countries in Southeast Asia. Rapidly growing population, availability of arable land, and strong government support for farmers through subsidies in these regions are the major factors driving the adoption of agriculture IoT technologies in APAC.
These projections show that IoT based agriculture is here to make a big splash and is a boon of science.