How AI Decision-Making is Improving Enterprise Outcomes
Blog
Share 
TABLEAU 2019.3 – WHAT TO EXPECT?
 3 February 2021
  LAKSHMI NARAYANA
 Tableau 2019.3 – What to Expect?
Tableau’s mission has always been to develop and deliver what customers ask. With Tableau server’s latest version 2019.3 (in beta now), it has brought out many exciting features like embedding Askdata, maintenance message, extract encryption at rest and more. Let us have a look at some of these upcoming features.
Ask Data improvements
I love to see when Tableau listens to customer feedback and continue to work on those asks. Ask Data is one of the most waited features in Tableau server’s previous releases and customers have asked if it can be embedded on other portals. With this release we can embed Ask Data into other company portals and let people ask questions.

Extract Encryption at Rest
Tableau cloud already provides volume encryption at rest and we already know that. Now with Tableau server, you will have the flexibility to have the encryption at REST for extracts. Server admins can enforce encryption of all extracts on their site or allow users to specify encryption for their published extracts.

It gives multiple options to enable this. We can have it for all the extracts or let user decide which extracts should be encrypted.
PDF attachment to subscriptions
It sounds very simple. But attaching pdf while sending the subscription was never an easy task. Tableau has made it easy now.

While creating a subscription, you can mention whether it should be an image or PDF or both.
Passwordless Tableau Server upgrades, node addition
As a server specialist, I know how tedious it is to enter password on a command prompt screen where you don’t see any characters getting typed. Often it goes wrong and we must reinitiate the process. With 2019.3, we can upgrade tableau server to next version with out manually entering the password or we can add new node without a password.

Adding a new node to the cluster no longer requires the username/password, if the bootstrap file you have created was in the last two hours.
Export to what you want
Exporting to PowerPoint will have all the sheets and sometimes we don’t need this. If you are a user who wants to export specific sheets in the workbook, this feature covers you. Now you have the option to select the sheets that you want to export.

And many more capabilities like new search results page, context filters on web, content sharing improvements, new product language Italian, etc. Beinex is a digital transformation organization en-rooted with ideas, innovation and unparalleled customer service. Our mission is to transform the way individuals and the organizations work with the data through innovation and experience.
If you are interested in learning more about the latest Tableau release and use cases, please contact us at training@beinex.com/ info@beinex.com and we would be happy to schedule a Tableau demo or training for you and your company.
The features shown above are currently in beta release and these might or mightn’t be available in the actual release.
-
Related Articles

Artificial Intelligence Governance: Why Enterprises Must Move Beyond Reactive Compliance
Enterprise AI adoption has crossed a tipping point. From automating customer service and accelerating drug discovery to supply chain optimization, artificial intelligence is no longer experimental; it is operational. Yet as AI becomes deeply embedded across enterprise functions, many organizations remain underprepared for the governance challenges that accompany it.
Artificial intelligence governance has evolved into a strategic boardroom priority rather than a simple compliance obligation. However, many enterprises still rely on a reactive approach: waiting for regulations to emerge and then rushing to comply. While that strategy may have worked for traditional data privacy requirements, it is insufficient for AI. With 13% of organizations already reporting breaches involving AI applications or models, reactive governance can expose organizations to operational disruption, reputational damage, and financial risk.
Know More: AI Governance & Ethics

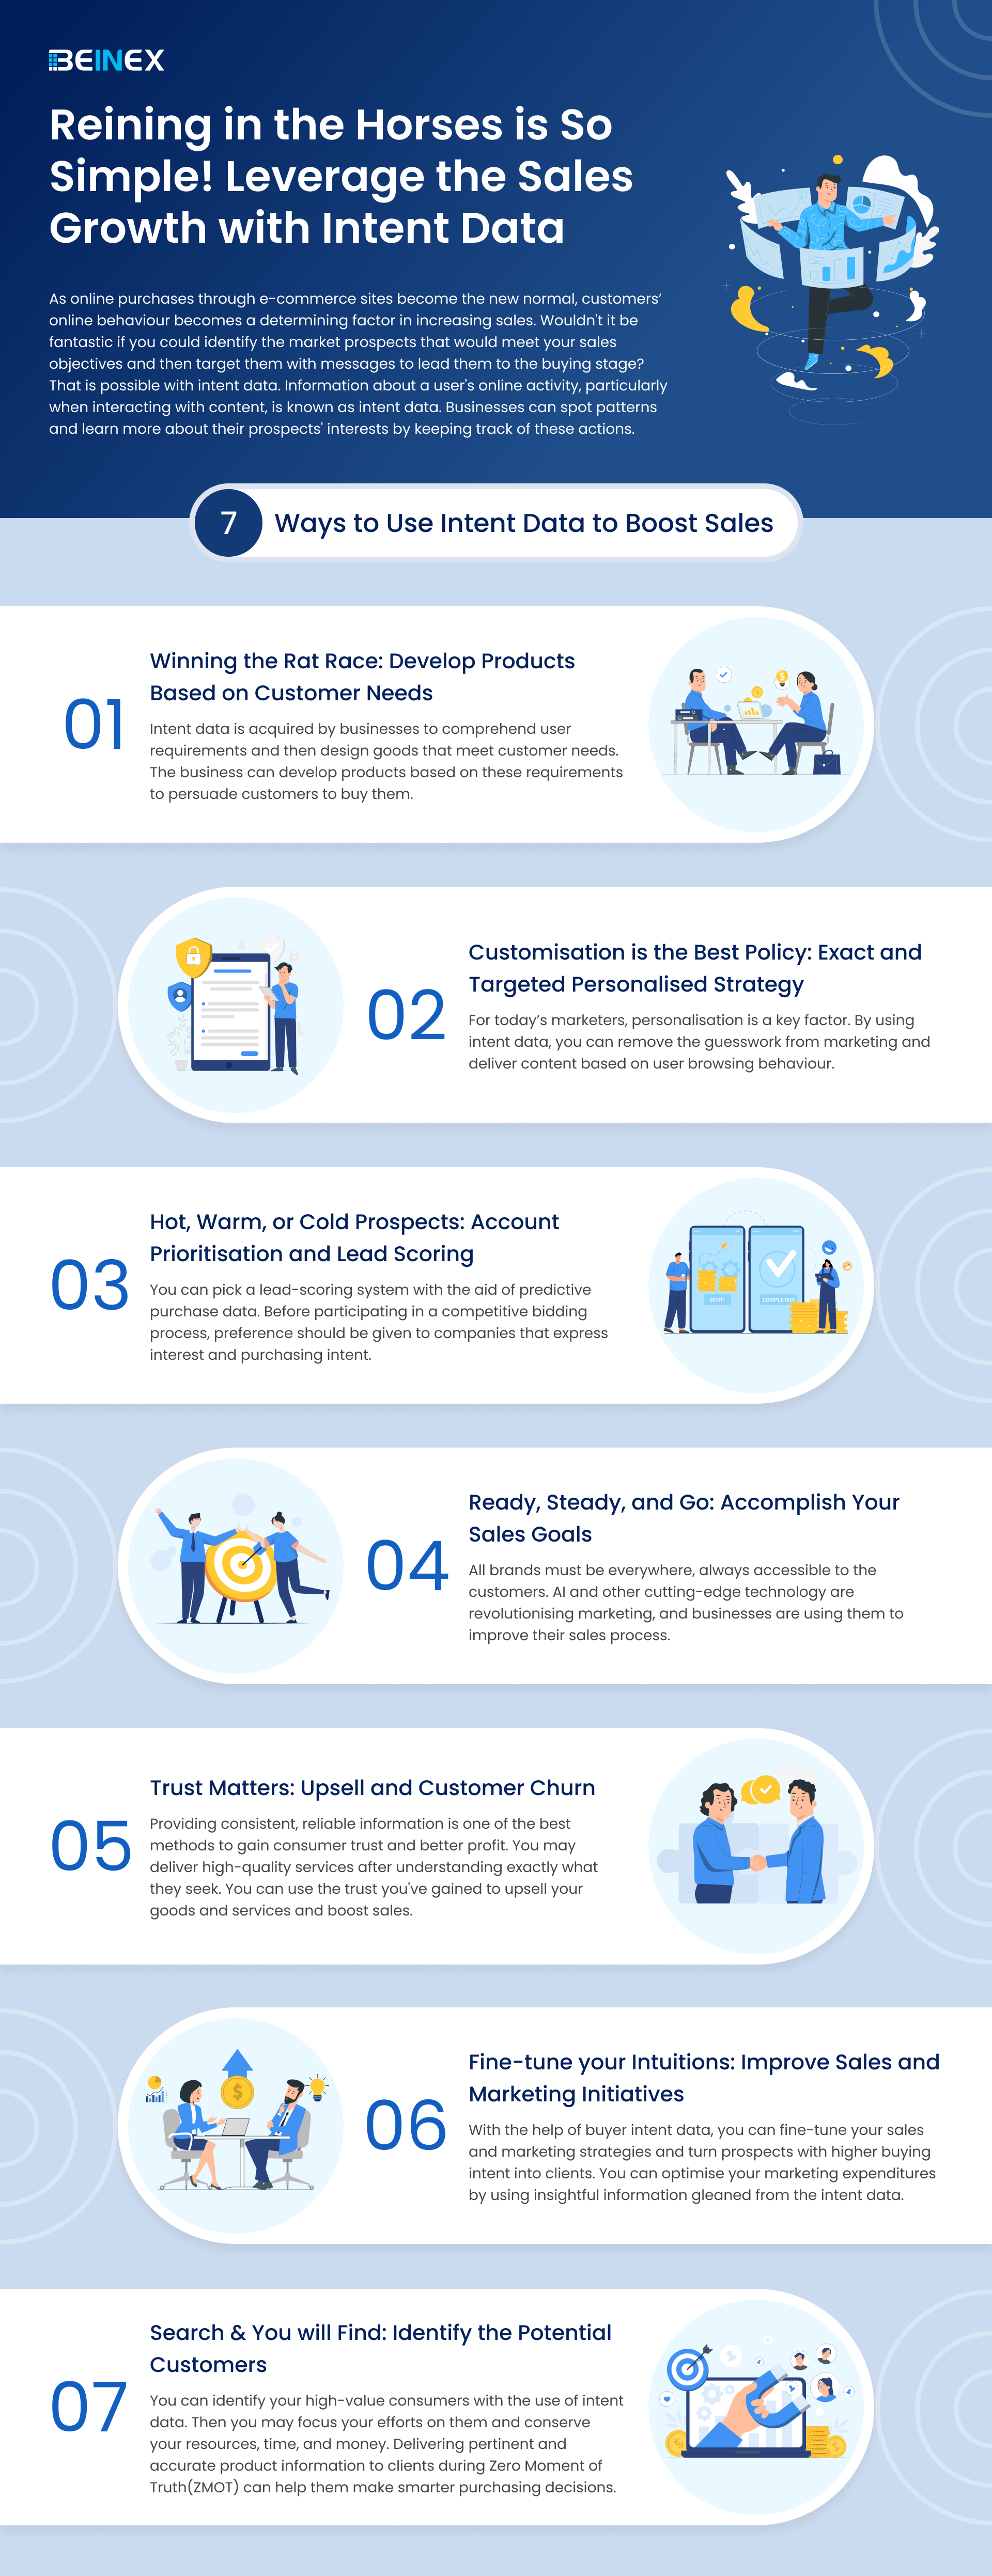
Reining in the Horses is So Simple! Leverage the Sales Growth with Intent Data(Infographic)

What’s New in Tableau's 2024.1 Release: Tableau Pulse, Metrics Layer, Viz Navigation, and More
Tableau's 2024.1 Release: What’s in it for you
Do your employees struggle to understand complex data visualizations? Does your organization lack a consistent approach to defining metrics? Are you looking for ways to make data more accessible for everyone? If you answered yes to any of these questions, then the new features in Tableau 2024.1 are for you! This release addresses these common challenges head-on, offering solutions like Viz Navigation for Text Tables, the Metrics Layer in Tableau Pulse, and more. Keep reading to learn more about these innovations and how they can revolutionize your data analysis workflows:
1. Tableau Pulse: Personalized Insights Delivered
Tableau Pulse is a real lifesaver, transforming how your organization interacts with data. Here's how it empowers your workforce:
To learn more about Tableau Pulse, click here: https://beinex.com/topics/tableau-ai-and-tableau-pulse-tableaus-dynamic-duo/
2. The Metrics Layer: Building a Unified Language for Data
Achieving consistency and clarity in data analysis is key to making informed decisions. The Metrics Layer within Tableau Pulse tackles this challenge by providing a central hub for defining and managing metrics.
Here's how it works:
By creating a unified language for data, the Metrics Layer empowers collaboration and drives data-driven decision making throughout your organization.
3. Tableau Pulse on Mobile: Stay on Top of Your Data Anywhere
Monitor key metrics and gain actionable insights, even when you're on the go. Tableau Pulse seamlessly integrates with Tableau Mobile, allowing you to access your personalized AI-powered insights directly from your smartphone or tablet.
Get a quick snapshot of your metrics:
Dive deeper for a comprehensive analysis:
This one-click access empowers everyone in your organization to make data-driven decisions, regardless of location. Tableau Pulse is available on both iOS and Android versions of Tableau Mobile.
4. Tableau Available Through AWS Marketplace: Streamlined Procurement and Deployment
For organizations leveraging the power of AWS cloud infrastructure, Tableau Cloud is now available on the AWS Marketplace. This integration offers several benefits:
5. Viz Navigation for Text Tables: Enhanced Accessibility
Tableau 2024.1 introduces a groundbreaking feature for exploring data visualizations: Viz Navigation for Text Tables. This innovative capability empowers users to navigate and interact with text tables using their keyboard or assistive technologies, removing the need for a mouse.
Benefits for all users:
This new feature signifies Tableau's commitment to making data accessible to everyone, regardless of their ability or preferred method of interaction.
6. Tableau Prep: Identify Duplicate Rows
Tableau Prep enables you to take control of your data quality. By removing or correcting duplicates, you can build trust in your data and generate reliable insights that drive better business decisions.
Effortlessly Spot Duplicates:- Remove identified duplicates to ensure a clean and accurate dataset.
- Fix the underlying issues causing the duplication, preserving valuable data points.
A New Era of Data-Driven Decision Making
With Tableau 2024.1 and Tableau Pulse, you have everything you need to democratize data across your organization. Empower your employees to leverage insights and make data-driven decisions that drive real business impact.
How Beinex Can Assist You
Beinex, a premier Tableau partner, provides sustainable analytics solutions to organizations and help to build superior data visual analytics capabilities internally through our bespoke training programs. Our team of Tableau-certified consultants are real-life Tableau business users who are passionate about Tableau and delivering a world-class experience. Connect with us for a Tableau free trial.

RecapAI: An AI-Powered Assistant for Priority Tracking and Follow-Through
What is RecapAI Agent
RecapAI is an AI-powered assistant that helps professionals quickly regain context after time away from work. It analyzes meetings, deadlines, communications, and updates to identify what has changed, what requires action, and what should be prioritized next. Instead of reviewing multiple tools and threads, users receive a clear, structured overview of critical follow-ups, key discussions, and upcoming priorities.
Connect With Us for a Free Demo!
How RecapAI Supports You
While you are away, RecapAI quietly keeps your workspace running. It monitors your inbox, tracks meeting updates, notes shifting deadlines, and identifies what needs your attention. It works like a calm, thoughtful assistant who knows exactly what matters and what can wait.
Our RecapAI agent welcomes you with a brief, clear summary – no scrolling, no searching, no overwhelm. You open your workspace, and everything makes sense instantly.
Your:
- • Shifted deadlines
- • Key meeting
- • Follow-ups you need to send
- • People to catch up
- • Upcoming priorities – all sorted for you.
It feels like someone has already organised your day and highlighted only what matters. RecapAI Agent isn't just a summarizer – It understands your priorities. You return after a break and instantly know what needs your attention.
Summing Up
RecapAI goes beyond simple summarization by aligning information with the user’s responsibilities and priorities. It supports focused decision-making and quicker re-engagement. The best part is that RecapAI makes sure users return to work informed, organized, and ready to act.
Connect with us if you want to know more about RecapAI: https://beinex.com/contact-us/

Snowflake Summit: Glimpses of Groundbreaking Data Cloud Developments
Snowflake summit 'The World of Data Collaboration' was held in Las Vegas, Nevada, June 13-16, 2022. It featured the first look at innovations coming to the Data Cloud. Over 200 lectures, practical labs, certification possibilities, and more than 200 Basecamp partners were included in the four-day data Snowflake Summit. Thousands of Snowflake's partners, clients, and industry colleagues were there to network, cooperate, and learn crucial information about Snowflake and new Data Cloud trends.
Here are the four most exciting of Snowflake's latest offerings:
1.Innovative data capabilities that save time and resources
The release of Snowpark for Python, which is currently in public preview, was one of the statements that received the most attention at the summit. Both streaming ingestions using the new Snowpipe Streaming and streaming pipelines with the launch of Materialised Tables generated a lot of interest. These new features demonstrate Snowflake's product philosophy, which strongly emphasises simplicity for partners and customers while delivering value. The declarative model is excellent since it only requires describing the change; Snowflake will handle the rest. They anticipate less data lag, more real-time features, and quicker decision-making.
A new workload, Unistore, that enables users to work seamlessly with transactional and analytical data together in a single platform stirred curiosity in the audience. Unistore can save time and effort in moving data from operational systems and help with low-latency machine learning (ML) inference scenarios. It provides snappy user interfaces, allowing teams to create real-time analytical queries on their transactional data and build transactional business applications directly on Snowflake and offers a unified approach to security and governance.
2.Creating, monetising, and using apps on the Data Cloud
The most intriguing news is the potential of the Snowflake Native Application Framework, which is now in private preview. Anyone may now create applications using the well-known Snowflake core functionality, share and earn money from them through Snowflake Marketplace, and deploy them directly inside a customer's Snowflake account. Customers may keep their data centralised and greatly simplify application acquisition and maintenance. In contrast, application suppliers will have quick visibility to thousands of Snowflake customers globally across the three major clouds. It was a piece of ground-breaking information for all parties.
Bidirectional and multi-source native apps developed by Informatica allow users to combine data from various cloud and enterprise platforms, including IBM, Microsoft, Salesforce, and SAP. So, Snowflake partners and customers can concentrate more on what to build and less on how to build it; Snowflake wants to make the building process more straightforward. Snowflake may not be able to foresee the entire extent of value creation and innovation that would result from this.
3.More options and cloud compatibility
As a customer-focused business, Snowflake constantly strive to strike a balance between giving our consumers options, streamlining processes, and lowering complexity. Providing a consistent user experience and simple governance for data housed in any of the three significant clouds is a crucial objective (AWS, Azure, and Google Cloud). With the help of the Snowflake platform, businesses may create their applications once and deploy them across several major cloud vendors' regions. Companies can migrate data—and now applications—easily between regions or clouds thanks to Snowflake's cross-cloud capabilities. You can use transactional consistency for failover and failback. For both customers and partners, Snowflake is offering a way to make the construction of cross-regional and cross-cloud experiences simpler.
Snowflake's ability to develop an app once and have it function flawlessly across various clouds and locations is a game changer. By enabling the Data Cloud to process data from S3-compatible storage systems, such as on-premises storage providers, Snowflake has also improved choice (currently in development). It also supports interoperability and open file formats as agents of choice. To that aim, Snowflake unveiled the presently under story Apache Iceberg Tables, which will let users select Iceberg as the persistence table type and Parquet as the file format, table by table.
4.Rich data experiences without sacrificing readability for data governance or security
Clients of Snowflake value the data governance and security provided by Snowflake as well as the release of numerous new features and enhancements are appreciated. For instance, with the assistance of Snowflake's new workload Cybersecurity, cybersecurity teams can easily break down data silos, resulting in improved visibility into security incidents, risks, and threats. In short, clients want to create reliable data products and openly share data without relinquishing control of or re-siloing their data. Snowflake accelerates the economic value cycle for partners, clients, and, quite honestly, by doing away with the trade-off.
Snowflake has planned to offer more services connected with data sharing, collaboration with clean data rooms, and Native Applications Framework.
Beinex's partnership with Snowflake
Beinex's partnership with Snowflake enables it to offer clients advanced features like automated tuning and elastic compute with unlimited decoupled computing capability, along with the analytics modernisation services, to help organisations realise exponential Return on Investment. We keep innovating for all our clients and to support businesses around the world to create more possibilities and quality services.