How AI Decision-Making is Improving Enterprise Outcomes
Blog
Share 
إصدار تابلو 2019.2
 1 February 2021
  Team Beinex
 إصدار تابلو 2019.2- رحلة إلى الأعماق
إصدار تابلو 2019.2- رحلة إلى الأعماق
Related Articles
A DEEP DIVE INTO TABLEAU 2019.3
TABLEAU CATALOG
What could be better than a feature that could provide better visibility and better data management at the same time, and also ensure that the right data is always used for analysis. This is possible with the new feature -Tableau Catalog.
 This feature provides a complete picture of the data and how each data is connected.
Another use of Tableau Catalog is linear and impact analysis. This not only shows which assets will change but also who will be affected by it, which makes work easier for many and avoids wastage of time.
EXPLAIN DATA
Tableau 2019.3 is up with a new Al-driven feature called the “Explain Data”, which helps people go from the “what” of the data to the “how” of it. With explain data, we can get an explanation for each unexpected value in the data by just a single click. On selecting the desired data point, the ‘explain data’(lightbulb) icon appears.
For each value there might be a number of explanations. Each of these explanations are checked and only the most likely ones are provided as visualizations.
This feature provides a complete picture of the data and how each data is connected.
Another use of Tableau Catalog is linear and impact analysis. This not only shows which assets will change but also who will be affected by it, which makes work easier for many and avoids wastage of time.
EXPLAIN DATA
Tableau 2019.3 is up with a new Al-driven feature called the “Explain Data”, which helps people go from the “what” of the data to the “how” of it. With explain data, we can get an explanation for each unexpected value in the data by just a single click. On selecting the desired data point, the ‘explain data’(lightbulb) icon appears.
For each value there might be a number of explanations. Each of these explanations are checked and only the most likely ones are provided as visualizations.
 Now these visualizations can be used for further explorations.
TABLEAU SERVER MANAGEMENT ADD-ON
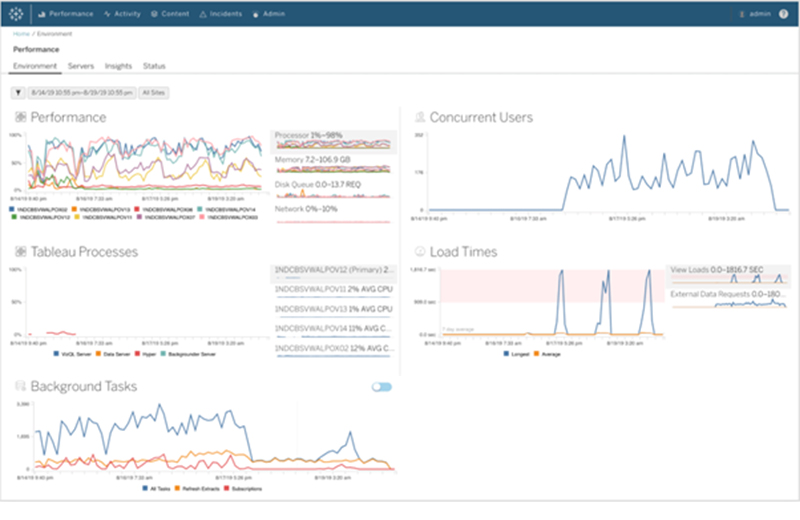
Organizations that run critical deployment of Tableau Server at a large scale, have mentioned concerns over manageability and scalability. They have been in search for tools that could organize the management process in an efficient way, which could save a lot of time. Tableau solved this problem by introducing the Tableau Server Management Add-on – a new feature designed to help organizations manage the deployment of Tableau Server. With this, they can quickly react to the changing needs of the business as well as save time by organizing the management process in the most efficient way. Tableau Server Management Add-on, which makes running the critical deployment of tableau at a large-scale server much simpler.
Now these visualizations can be used for further explorations.
TABLEAU SERVER MANAGEMENT ADD-ON
Organizations that run critical deployment of Tableau Server at a large scale, have mentioned concerns over manageability and scalability. They have been in search for tools that could organize the management process in an efficient way, which could save a lot of time. Tableau solved this problem by introducing the Tableau Server Management Add-on – a new feature designed to help organizations manage the deployment of Tableau Server. With this, they can quickly react to the changing needs of the business as well as save time by organizing the management process in the most efficient way. Tableau Server Management Add-on, which makes running the critical deployment of tableau at a large-scale server much simpler.
 The server management add-on feature can help in optimising the performance of deployment by customizing which nodes process background jobs such as extract refreshes and subscriptions and isolating these workloads, to specific nodes. This makes it easier to scale deployments to the needs of their organization.
This feature has a few tools, including two for better reliability and scalability and one for content migration, all of which helps the organizations to govern their data effectively.
If you are interested in learning more about the latest Tableau release and use cases, please contact us at training@beinex.com/ info@beinex.com and we would be happy to schedule a Tableau demo or training for you and your company.
The server management add-on feature can help in optimising the performance of deployment by customizing which nodes process background jobs such as extract refreshes and subscriptions and isolating these workloads, to specific nodes. This makes it easier to scale deployments to the needs of their organization.
This feature has a few tools, including two for better reliability and scalability and one for content migration, all of which helps the organizations to govern their data effectively.
If you are interested in learning more about the latest Tableau release and use cases, please contact us at training@beinex.com/ info@beinex.com and we would be happy to schedule a Tableau demo or training for you and your company.
This feature provides a complete picture of the data and how each data is connected.
Another use of Tableau Catalog is linear and impact analysis. This not only shows which assets will change but also who will be affected by it, which makes work easier for many and avoids wastage of time.
EXPLAIN DATA
Tableau 2019.3 is up with a new Al-driven feature called the “Explain Data”, which helps people go from the “what” of the data to the “how” of it. With explain data, we can get an explanation for each unexpected value in the data by just a single click. On selecting the desired data point, the ‘explain data’(lightbulb) icon appears.
For each value there might be a number of explanations. Each of these explanations are checked and only the most likely ones are provided as visualizations.
Now these visualizations can be used for further explorations.
TABLEAU SERVER MANAGEMENT ADD-ON
Organizations that run critical deployment of Tableau Server at a large scale, have mentioned concerns over manageability and scalability. They have been in search for tools that could organize the management process in an efficient way, which could save a lot of time. Tableau solved this problem by introducing the Tableau Server Management Add-on – a new feature designed to help organizations manage the deployment of Tableau Server. With this, they can quickly react to the changing needs of the business as well as save time by organizing the management process in the most efficient way. Tableau Server Management Add-on, which makes running the critical deployment of tableau at a large-scale server much simpler.
The server management add-on feature can help in optimising the performance of deployment by customizing which nodes process background jobs such as extract refreshes and subscriptions and isolating these workloads, to specific nodes. This makes it easier to scale deployments to the needs of their organization.
This feature has a few tools, including two for better reliability and scalability and one for content migration, all of which helps the organizations to govern their data effectively.
If you are interested in learning more about the latest Tableau release and use cases, please contact us at training@beinex.com/ info@beinex.com and we would be happy to schedule a Tableau demo or training for you and your company.
Note: The Server Management Add-on is not available for Tableau Online, as they manage everything from scaling, performance, and security on behalf of their Tableau Online customers. The Tableau Server Management Add-on can be separately purchased from the Tableau Server deployment.

Beinex Wins 2021 AWS Rising Star Consulting Partner of the Year – MENA Award
The AWS Partner Awards recognise a wide range of Partners, whose business models have embraced specialisation and collaboration over the past year. The AWS Partner Awards also recognise AWS Partners whose business models continue to evolve and thrive on the AWS Cloud as they work with customers to conceive, build and migrate cloud-native solutions on AWS.
Receiving the Award, Indumon Das, the Founder and Managing Director of Beinex, remarked, "We leverage the capabilities of AWS and combine that with the Analytics Consulting power of Beinex to bring unmatched success to our customers. We look forward to the launch of the AWS data centers in the UAE in the first half of 2022. The launch will have a big impact on the growth and acceleration of cloud adoption in the Middle East and we are excited to support organizations to take advantage of what it has to offer."
 The AWS Partner Network (APN) is the global community of businesses using AWS to build solutions and services for customers. AWS helps partners build, market, and sell their offerings by providing valuable business, marketing, and technical support on top of our proven, global, and secure infrastructure. AWS partners are uniquely positioned to help customers take full advantage of all that AWS has to offer and accelerate their journey to the cloud. AWS has millions of active customers and a dynamic community of over 100,000 partners globally.
"AWS Partners add value to customers across a wide range of industries around the world and are critical to their success. We are pleased to recognise a variety of partners through the APN Partner Awards EMEA 2021. I look forward to working together to a great 2022," said Antonio Alonzo Lopez, EMEA Director Partner Success at AWS.
About Beinex
Beinex, Dubai, is a multinational firm exploring the endless possibilities of data for Cloud, Analytics, Artificial Intelligence, Machine Learning, and Automation.
The AWS Partner Network (APN) is the global community of businesses using AWS to build solutions and services for customers. AWS helps partners build, market, and sell their offerings by providing valuable business, marketing, and technical support on top of our proven, global, and secure infrastructure. AWS partners are uniquely positioned to help customers take full advantage of all that AWS has to offer and accelerate their journey to the cloud. AWS has millions of active customers and a dynamic community of over 100,000 partners globally.
"AWS Partners add value to customers across a wide range of industries around the world and are critical to their success. We are pleased to recognise a variety of partners through the APN Partner Awards EMEA 2021. I look forward to working together to a great 2022," said Antonio Alonzo Lopez, EMEA Director Partner Success at AWS.
About Beinex
Beinex, Dubai, is a multinational firm exploring the endless possibilities of data for Cloud, Analytics, Artificial Intelligence, Machine Learning, and Automation.

Amazon CloudFront Case Study: How It Transformed the Customer Experience of Zalando, a Prominent E-commerce Platform
What is Amazon CloudFront?
Amazon CloudFront is a content delivery network offered by Amazon Web Services. It securely transfers content such as software, SDKs, and videos to clients with high transfer speeds. It helps to:
• Increase productivity while maintaining user-friendliness
• Cache your content in edge locations to reduce workload
• Provide high security through the "Content Privacy" feature.
• Utilize HTTPS protocols for fast content delivery.
• Support geo-targeting services for delivering content to specific end users.
The Amazon CloudFront solved the performance and scalability issues, providing Zalando's development teams more insight, flexibility, and control. Eventually, the shift set the stage for long-term innovation and large-scale customer happiness.
Amazon CloudFront Case Study: Challenges Faced by Zalando
In the face of rapid expansion, Zalando sought to maximize its offerings. With more than 49 million active users, Zalando links consumers with brands and goods in 25 European regions. Rich media content is integral to Zalando's website and app to enhance the online customer experience. However, the company's image management, transformation, and delivery system have limited visibility and control for developers. All these factors are crucial for sustaining growth and delivering a unique customer experience.
Zalando migrated its media management and delivery system to Amazon Web Services (AWS) by leveraging Amazon CloudFront, a content delivery network service designed for developer simplicity, security, and high performance. Using CloudFront, Zalando enhanced developer observability, scalability, and online purchasing experiences.
Strengthening Developer Ownership to Promote Development
Due to substantial expansion, Zalando outgrew its prior image management system, which provided its engineering and product teams with few configuration options. Furthermore, few operational insights were available, making it difficult to see how well the service was doing and what improvements could be made. It affected Zalando's capacity to modify and enhance its online stores. Delivering a consistent client experience during high-demand seasonal events was made difficult by the absence of comprehensive reporting regarding image transformation.
To overcome these obstacles and to develop their new media management system, the Zalando team used Amazon CloudFront. Because of its programmability and flexibility, Amazon CloudFront became crucial for scaling operations and keeping up with rising client demand.
Migrating to AWS Edge
Zalando executed its migration quickly and effectively. The company coordinated its migration schedule with AWS's Enterprise Support, Service Specialists, and Service Teams to avoid conflicts with customer campaigns and market events. Small client groups were used in the initial stages of the conversion so that the business could identify any areas for improvement without significantly impacting Zalando customers. During this procedure, Zalando moved more than 20 websites and apps, totaling 26.93 PB of data. CloudFront's peak load has consistently surpassed 100,000 requests per second.
The development team enhanced the image-delivery method using Zalando's prelaunch hands-on access to CloudFront Functions. The team was pleased to receive support on several levels throughout several stages. Regular contact began very early on, while they looked for proofs of concept and sent the code to verify its legitimacy and identify any obstacles.
Zalando started using CloudFront Functions in production in May 2021. Smooth configuration is a significant change with CloudFront Functions. On an operational level and for daily development, it makes it easier to deploy and reliably revert tasks and scale on demand. Zalando swiftly overcame challenges by implementing the new solution across its online domains. Zalando needed to be able to roll back quickly when necessary, making changes before actual downtime could happen. For various use cases, Zalando now employs both Lambda@Edge and CloudFront Functions. Multiple layers of edge computing give developers greater flexibility, visibility, and control while improving the client experience. It enabled Zalando to respond quickly and provide better consumer and business services.
Since the move, Zalando has been attaining cache hit percentages of 99.5 percent, and its new image-delivery system serves almost five billion images daily. They didn't face any challenges with Amazon CloudFront. With about 250 million online orders after the transformation, Zalando's CloudFront solution's size and effectiveness were crucial in providing a first-rate consumer experience.
Additional optimizations made by Zalando have resulted in a threefold decrease in requests for nonoptimized photos on the home screens of the company's online and mobile applications. Because of its improved efficiency and versatility, teams within Zalando have shifted to utilize the pipeline built on CloudFront for additional kinds of material.
Fostering Client Interaction
Using AWS, Zalando intends to keep innovating in managing and manipulating rich media assets. By developing an interactive e-commerce solution with AWS Elemental MediaConvert, a file-based video converting service with broadcast-grade features, it intends to promote consumer interaction. To better serve its clients, Zalando moved to CloudFront to enhance the media management and delivery systems that influence the shopping experience. Zalando could carry out a seamless move with the help of the AWS team, which had significant advantages. The business benefits of using Amazon CloudFront are the operational flexibility and the ability to monitor the health of the solution, experiment, and reverse changes quickly.
Summing Up
Zalando's decision to strategically switch to Amazon CloudFront was a watershed moment in its quest to provide a better, more scalable consumer experience. By tackling important issues with media delivery, performance, and developer control, Zalando increased operational efficiency and enhanced the user experience across all platforms. This success story illustrates how intelligent content delivery systems can enhance long-term value, performance, and customer satisfaction in digital commerce as the company grows and changes.

Seamless Integration: Maximise the Benefits of Blockchain in Cloud Computing
5 Top Ways Blockchain Improves Cloud Computing
Blockchain technology can enhance cloud computing in several ways:
- Improved Security: Security and privacy are major concerns in cloud computing. Blockchain technology offers enhanced security by enabling data encryption and advanced database protection. The decentralised nature of blockchain ensures that data is not stored in a single location, reducing the risk of unauthorised access or data breaches.
- Increased Visibility: Transparency and visibility are crucial in cloud computing. Blockchain enables the creation of a decentralised and shared trust model, allowing for increased transparency. Public blockchains provide visibility into every action taken, reducing opacity and enhancing trust in the cloud environment.
- Data Integrity and Immutability: Once information is recorded on a blockchain, it becomes immutable and cannot be altered by any individual or entity without consensus from the network. This feature ensures the integrity of data stored in the cloud, reducing the risk of unauthorised modifications or tampering.
- Traceability: Blockchain ensures that data stored on its network remains intact and authentic. The information stored on one device within the blockchain network does not affect the data on other devices, guaranteeing data integrity. Additionally, blockchain enables easy data traceability, allowing users to track where, when, and how it is used.
- Exclusion of Third Parties: In cloud computing, relying on third-party providers can result in significant data loss if these providers experience failures. In contrast, blockchain is managed by code and does not involve third parties. This makes blockchain integration with cloud computing an attractive option, as it reduces the risk of data loss and dependency on external service providers.
4 Top Benefits of Blockchain in Cloud Computing
Integrating blockchain technology into cloud computing offers many benefits, including enhanced data security, seamless traceability, improved system interoperability, and more. Let's explore how organisations can leverage the power of blockchain in their cloud computing strategies.
Enhanced Data Security
By implementing point-to-point encryption, blockchain ensures data security during transfer and storage. Using blockchain for transaction recording establishes a reliable method for maintaining the integrity and sequence of transactions. Furthermore, the decentralised nature of blockchain, combined with peer-to-peer distribution across cloud computing systems, adds an extra layer of security beyond traditional centralised storage approaches.
Permanent Audit Trail
An additional benefit of integrating blockchain technology into cloud computing is creating a permanent audit trail. Blockchains ensure the establishment of a lasting record of transactions. Notably, blockchain technology incorporates a feature known as proof of history (POH), which supports a verifiable delay function. This function timestamps the transactions within the cloud computing network without requiring user validation. By implementing blockchain, organisations can maintain a proper order of transactions and establish a permanent timeframe for transactional data by including the POH function.
Decentralisation
An emerging trend in the technology landscape involves the shift towards edge computing, where data processing occurs at the network's periphery, near the data source. This decentralisation approach offers various advantages. For instance, Internet of Things (IoT) devices no longer need to rely on a centralised server for data processing. Instead, they can handle data independently. Similarly, facial recognition nodes may store encrypted data of authorised users and only require server interaction if a facial match is not detected. These nodes can operate autonomously until an upgrade check is necessary.
Efficient Disaster Recovery
By leveraging blockchain technology, the record of transactions is distributed widely, offering valuable benefits in terms of disaster recovery. The public or shared blockchain among authorised users ensures that a failure within one network node does not impact the remaining blockchain copies. Other nodes within the network continue to operate and update the blockchain even if one node experiences a crash.
With the transactional records embedded within the blockchain, especially those with specific timeframes, any failed network node can easily synchronise with the current state of the blockchain database once it is back online. This capability allows for a swift recovery and ensures that the node can quickly regain access to the most up-to-date version of the blockchain. Consequently, faster disaster recovery is facilitated through the inherent resilience and redundancy of blockchain technology.
Blockchain Technology: An Ultimate Solution to Business Problems
Blockchain technology offers solutions to various business problems across different industries. Let's explore how blockchain can address challenges in specific sectors, starting with healthcare:
Healthcare
In the healthcare industry, sensitive information such as credit card data, patient records, and test results are often stored in centralised systems, which can be prone to data breaches and security risks. By adopting blockchain technology, healthcare establishments can mitigate the risk of data loss. Blockchain enables the creation of a decentralised and tamper-proof log for storing private data. This decentralised approach and unique secure codes enhance data security and privacy, reducing the likelihood of unauthorised access or data leakage.
Supply Chain
Supply chains rely on vast data to ensure smooth operations at each transportation stage. By implementing blockchain technology in logistics management, you can enhance revenue and mitigate security concerns through real-time visibility and control. Furthermore, blockchain solutions improve interoperability, transparent data sharing, and more accurate product tracking within the supply chain ecosystem.
Banking
The current process of international payments often involves numerous verification steps, resulting in a cumbersome procedure. However, blockchain can potentially expedite money transfers while ensuring robust transaction security. This is achieved using distributed ledgers, where payments are processed once the transaction is registered. By leveraging the blockchain in banking, transactions can be streamlined, reducing delays and providing higher security.
Real Estate
Buying and selling real estate properties can be cumbersome and time-consuming, involving extensive paperwork, multiple intermediaries, susceptibility to fraud, and challenges in property search. However, intelligent solutions leveraging blockchain technology can effectively address these significant problems in the real estate industry.
Blockchain in real estate can enhance the due diligence process for property purchases and sales, reducing the reliance on intermediaries and streamlining the transaction process. Using blockchain can reduce the need for traditional agents, offering more direct interactions between buyers and sellers. Additionally, blockchain-powered smart contracts enable secure and seamless transactions, eliminating the need for manual contract handling and reducing the potential for errors or disputes.
How can Beinex Assist You
By leveraging blockchain technology, cloud computing solutions can benefit from enhanced security measures, increased transparency, and the assurance of data integrity. These advantages contribute to a more trustworthy and reliable cloud environment, addressing decentralisation, data privacy, and network security challenges.
Beinex, a pioneer in the Middle East in modern cloud functions and analytics, can change how you see, perceive and analyse cloud data, and take it to a superior, advantageous position.

Top 15 Tableau LOD Expressions
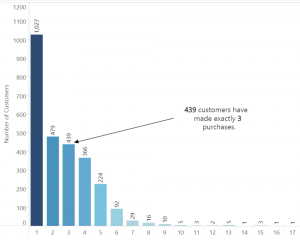
Customer Order Frequency
This scenario involves understanding customer order frequency, specifically determining the count of customers who made varying numbers of orders. While calculating the number of orders per customer is straightforward, discerning how many customers placed one, two, or multiple orders requires breaking down the count of customers based on order frequency. Utilizing LOD (Level of Detail) Expressions becomes essential in transforming the count of orders into a dimension that segregates customers by their order count. This process aids in unraveling insights about customer behavior in relation to their order frequency within a sales database where multiple items are present per order.

Cohort Analysis
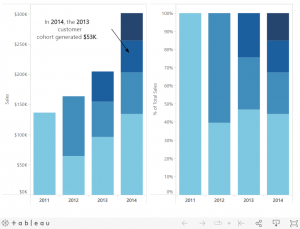
In the pursuit of understanding the impact of customer tenure on sales contributions, cohort analysis is employed to assess whether longer-tenured customers hold more significant sales influence. The presented view categorizes customers based on the year of their initial purchase, facilitating an annual comparison of sales contributions among these cohorts. To determine the first purchase date for each customer, the minimum order date per customer is crucial. However, as the displayed data isn’t structured by customer, employing an LOD (Level of Detail) Expression becomes necessary to establish and retain the minimum order date per individual customer for accurate cohort analysis.

Daily profit KPI
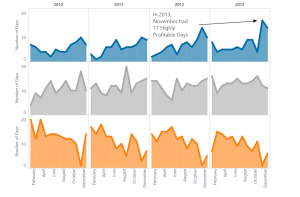
In evaluating daily profit as a key performance indicator (KPI), the focus shifts from observing profit trends over time to quantifying success based on total profit per business day. Understanding the count of profitable days per month or year becomes essential, particularly in investigating potential seasonal impacts. Utilizing LOD (Level of Detail) Expressions, this view demonstrates the seamless creation of bins for aggregated data, like profit per day, despite the underlying data being recorded at a transactional level. This approach allows for efficient analysis and visualization of daily profitability trends within the context of the broader business calendar.

Percent of Total
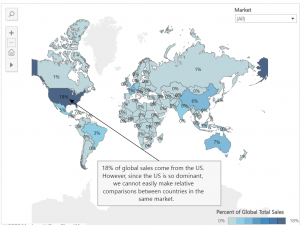
Determining each country's revenue contribution to global sales is crucial for assessing market performance. When visualized by coloring contributions as percentages, it's apparent that the US holds the highest share of global sales revenue. However, focusing on markets like the EU, which might have a relatively smaller absolute contribution, becomes challenging without LOD Expressions. Without this capability, filtering by market could lead to recalculating the percent of total, displaying each country's contribution relative to its market. Using a straightforward LOD Expression enables filtering by market while preserving the measurement of each country's global contribution, facilitating a more nuanced analysis of market performance within the broader global context.

New customer acquisition
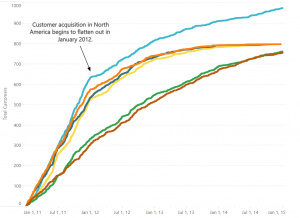
Analyzing the daily trend of total customer acquisition across different markets serves as a crucial metric in assessing the effectiveness of regional marketing and sales efforts in generating new business. By tracking this trend, we gain insights into the performance of these organizations. A steeper line signifies a stronger acquisition trend, while a flattening line suggests a need for increased lead flow.
To accurately measure this trend, it's imperative to ensure that repeat customers aren't erroneously counted as new customers. This necessitates using an LOD (Level of Detail) Expression, allowing data evaluation at the customer level despite its visual representation being segmented by market and day. This meticulous approach ensures a precise assessment of new customer acquisition, enabling strategic actions to be taken based on the observed trends.

Comparative Sales Analysis
When aiming to determine the difference from a selected category rather than the average, the process becomes more intricate. Initially, isolating the sales figures of the chosen category is necessary. Subsequently, employing an EXCLUDE Expression becomes crucial to reiterate that value across all other categories. This technique enables a straightforward calculation of the difference between each category's sales and the rest, allowing for a comparative sales analysis that emphasizes the disparity between the selected category and others.


Average of top deals by sales rep
Determining the largest deal closed by each sales representative and subsequently computing the average of these top deals by country is a multi-layered analysis. LOD (Level of Detail) Expressions play a pivotal role in dissecting data down to the sales rep level, even when the visualization displays information at the country level.
The presented view showcases the average top deal size by sales rep, offering insights where countries colored blue exhibit higher average top deal sizes, while those colored orange indicate comparatively lower averages. This information serves as a guide for further drill-down analysis from the country level to the sales rep level, facilitating a deeper understanding of performance variations across both geographical and individual sales rep perspectives.


Actual vs. Target
Within this visualization, we present the variance between actual and target profits per state for a chain of coffee houses. The top view distinctly showcases states surpassing or falling short of set targets. Yet, this aggregated view might overlook subtleties: some states exceed targets due to every product sold meeting or exceeding goals, while others rely on a single product surpassing its target to compensate for others missing theirs. Employing an LOD Expression enables the identification of the percentage of products sold within a state that surpass their set targets, offering a more nuanced assessment.


Value on the Last Day of a Period
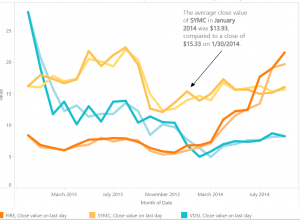
Data reflecting specific day statuses—like inventory, employee headcounts, or daily stock values—require distinct handling compared to aggregatable metrics like sales or profit. Displaying the value on the last calendar day of a month holds significance in such cases. Moreover, transitioning from a monthly to a weekly view should dynamically update to showcase the last day of the week. For instance, in the stock data example below, assessing multiple ticker values at a daily level compares the average daily close value against the close value on the final day of the period. Employing a straightforward LOD Expression enables diving into daily granularity even within a visual display at a higher level of aggregation.

The following 6 examples illustrate how level of detail expressions can be applied to more advanced scenarios:
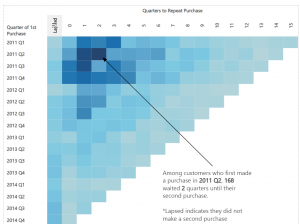
Evaluating the return purchases among customers holds significance, especially considering the costliness of acquiring new customers. Understanding the patterns of customers making repeat purchases within varying quarters—whether it's the first, second, third, or beyond—is essential. Additionally, assessing the count of customers who have never made a repeat purchase contributes valuable insights. This analysis, segmented by quarterly cohorts, sheds light on customer behavior over time.
Leveraging a FIXED Expression becomes instrumental in identifying each customer's first and second purchase dates, enabling the derivation of the time span in quarters for a repeat purchase. This nuanced approach offers a comprehensive understanding of customer return behavior within distinct quarterly cohorts.

Percent Difference from Average Across a Range
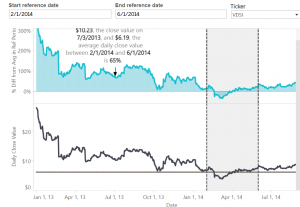
While Example 6 highlights comparing against a single selected item, what if the aim is to assess comparisons across a spectrum of values? Consider a scenario where one desires to evaluate the daily close value of a stock against the average daily close value before a significant industry-impacting event occurs.
In such instances, examining the percent difference becomes essential. By comparing the daily stock close values against the pre-event average, insights into the magnitude and impact of the event on stock performance can be gleaned. This analysis offers a broader perspective, aiding in understanding the deviation from the average within the context of industry-wide fluctuations.

Relative period filtering
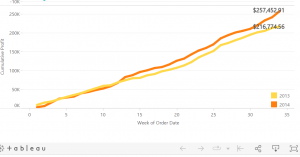
When analyzing performance through year-to-date (YTD) and month-to-date (MTD) comparisons relative to the previous year, filtering relative to today is straightforward. However, when data undergoes weekly refreshes, discrepancies can arise. For instance, if the last refresh was on March 1 but the current day is March 7, a month-to-date comparison might inadvertently compare March 1 through March 7 of the previous year against March 1 of the current year, potentially causing unwarranted concern.
Employing a simple LOD (Level of Detail) Expression resolves this issue by identifying the maximum date within the dataset. This approach ensures accurate time-based comparisons, preventing misleading contrasts between different periods and providing a more precise evaluation of performance trends.

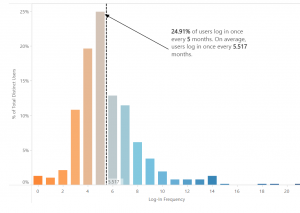
User login frequency
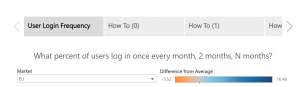
Understanding user login frequency is pivotal for assessing user engagement on websites or applications. This analysis aims to segment users based on their login frequency—whether it's monthly, bi-monthly, quarterly, and so on—and derive insights regarding the average login rate and its distribution around this average.
The dataset's granularity involves a log-in date per user ID, implying a row for each day a user accesses the platform. Slicing the number of customers by their login rate entails a more intricate analysis, necessitating the slicing of one measure by another measure. As showcased in Example 1, leveraging LOD (Level of Detail) Expressions streamlines this analysis, enabling an easy breakdown of user cohorts based on their login frequency and facilitating a comprehensive understanding of user behavior.
Proportional Brushing
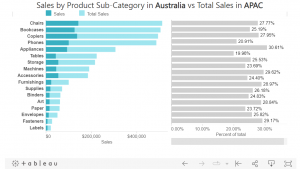
In the realm of analysis, the pivotal question often revolves around comparison—specifically, "Compared to what?" Proportional brushing introduces a valuable technique for filtering where the aim is not merely to narrow down to the selection but to compare the selection against the total context.
This approach allows for a more comprehensive analysis by providing insights into how the selected subset relates to the entirety of the dataset. Proportional brushing aids in understanding the significance and impact of the chosen subset within the broader context, offering a richer perspective for informed decision-making.

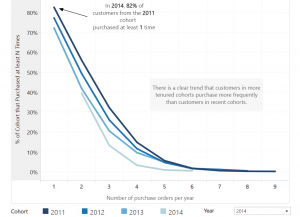
Examining the correlation between customer tenure, measured by the year of acquisition, and loyalty, gauged through annual purchase frequency, provides valuable insights into customer behavior.
While Example 1 illustrates customers purchasing a specific number of times, marketers often seek insights beyond exact counts—particularly identifying customers who purchased at least a certain number of times. Moreover, understanding the loyalty trends within different acquisition cohorts is crucial. Simply assessing absolute customer numbers across cohorts might not reveal nuanced insights. Therefore, a more insightful approach involves evaluating the percentage of total customers within each cohort based on their purchase frequency thresholds.
In essence, this analysis combines variations of the number of orders LOD Expression, cohort Expression, and percent-of-total Expression to determine what percentage of customers within each cohort made at least one, two, three, or more purchases in a year. This approach offers a comprehensive understanding of loyalty trends across different customer acquisition periods.