How AI Decision-Making is Improving Enterprise Outcomes
Blog
Share 
Snowflake: Handling Semi-structured Data with Variant and Flatten
 23 February 2023
  Team Beinex
 Semi-structured Formats with Snowflake Support
The number of sources that produce semi-structured data has increased exponentially in recent years. The arrival of Snowflake Data Cloud has made it effortless to process complex datasets. Snowflake supports storing and processing semi-structured data. It supports semi-structured formats enlisted below:- • JSON
- • Avro
- • ORC
- • Parquet
- • XML
- • Variant
- • Flatten
Variant
A variant is a datatype which can hold semi-structured data in a single field. Snowflake stores semi-structured data in the column format when semi-structured data is loaded into a VARIANT column. A single row can contain other underlying data. Let’s demonstrate with the help of examples:
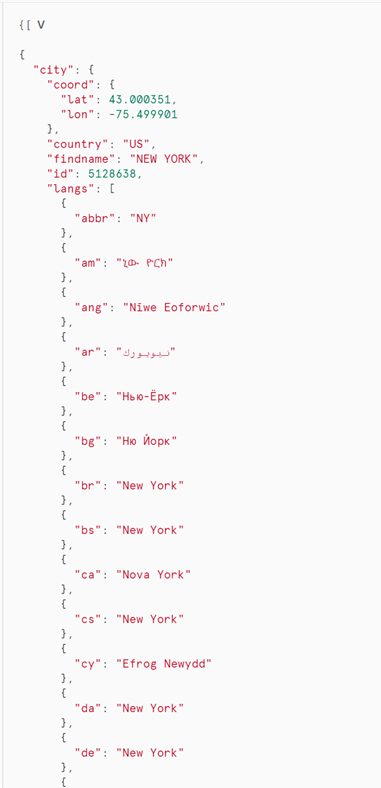

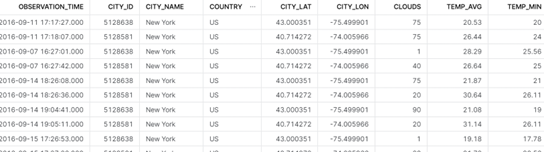
The stored data can be easily retrieved and structured from the above table by a simple query as below:
select
v:time::timestamp as observation_time,
v:city.id::int as city_id,
v:city.name::string as city_name,
v:city.country::string as country,
v:city.coord.lat::float as city_lat,
v:city.coord.lon::float as city_lon,
v:clouds.all::int as clouds,
(v:main.temp::float)-273.15 as temp_avg,
(v:main.temp_min::float)-273.15 as temp_min,
(v:main.temp_max::float)-273.15 as temp_max,
v:weather[0].main::string as weather,
v:weather[0].description::string as weather_desc,
v:weather[0].icon::string as weather_icon,
v:wind.deg::float as wind_dir,
v:wind.speed::float as wind_speed
from json_weather_data
Note: ‘v’ is the Field (Column) name, and the JSON tags are arranged alongside to retrieve datasets.
Flatten
Compound values are flattened into multiple rows with the use of the Snowflake Flatten Command. A tool called Snowflake FLATTEN is used to transform semi-structured data into a relational structure. Relatively complex JSON structures such as nested JSON structures can be structured with FLATTEN function in Snowflake. Here is an example of the same:
 The above JSON file stores a single set of conversations between two texters in a single row. If the requirement is to get every individual message as a separate row a FLATTEN function can be used to produce the following result:

Here is the query to generate the above table from semi-structured data:
(SELECTb.value:message_date::TIMESTAMP AS Time_Of_Message,
b.value:conversation_number::STRING AS Conversation_num,
b.value:message:message_text:msg_txt::STRING AS Message,
ROW_NUMBER() OVER ( PARTITION BY b.value:dialogId::STRING ORDER BY
b.value:message_date::TIMESTAMP ASC) as Message_order
FROM customer_messages t,LATERAL FLATTEN(input => t.v) b);
Summing Up
The ability of Snowflake’s assistance is undeniable. It aids you to make better decisions and offers a better overall experience when attempting to get the most out of your data, through features like Flatten and Variant. If you want to be a part of Snowflake’s incredible platform, let us help you. Beinex’s partnership with Snowflake enables us to offer you advanced features like automated tuning and elastic computing, along with analytics modernization services, to help your organisation realise exponential Return on Investment.
There are instances in which you really get overwhelmed by tons of data that you may spend hours exploring, finally leaving you with heaps of unresolved data sets. Companies have been handling giant, complex data ecosystems and pipelines to transform complex data sets in semi-structured formats like JSON, XML, etc. All these intricate data sets can be converted into manageable and insightful data formats by adopting cloud-based technology. Snowflake’s out-of-the-box features to handle complicated semi-structured data formats with variant and Flatten help to handle the demanding needs of enterprises.
Related Articles

Data Sharing Best Practices in Snowflake
Snowflake Data Sharing
Data sharing in Snowflake equips you to share specific objects with another Snowflake account or a designated reader account. The beauty of this process lies in the fact that the data isn't duplicated or moved between accounts.
Now, why is this a game-changer for organisations? When constructing data pipelines and developing data products, it's a common practice to shuttle data between databases and diverse systems to blend different datasets.
Consider this scenario: You have transactional data within your online transactional processing (OLTP) database, and you wish to integrate it with external data for a machine learning model. Traditionally, organizations would export data into a data lake, import external data, and then employ tools like Apache Spark for analysis.
But what if, instead, you could simply deposit your data into Snowflake, and the external data source could seamlessly share its data with your organisation, eliminating the need to load it separately? This eradicates the challenge of keeping data copies synchronised, resulting in savings on storage, computing costs, and maintenance efforts.
Imagine your company possesses valuable information that can guide other companies in making informed decisions. For instance, let's say your company can provide precise estimates for product delivery times based on proprietary data, and you want to offer this information for sale to your customers.
Enter Snowflake data sharing—it empowers you to precisely do that.
Case Studies: Snowflake Data Sharing
Citing two instances where leading organisations use Snowflake to improve actionable data sharing, collaboration and reporting capabilities.
1. A Pioneering Technology Leader
A well-known Swedish-Swiss multinational corporation successfully implemented a streamlined data strategy using the Snowflake Data Cloud, adopting an "extract once, use everywhere" approach that simplified data consolidation and enablement. By transitioning from nightly extracts, which caused significant system overhead, to a single, near real-time Change Data Capture (CDC) process, the company achieved efficient replication of information to Snowflake with minimal impact. The utilisation of Snowflake Secure Data Sharing facilitated secure and governed data collaboration across the four business areas.
2. A Leading fast-food Restaurant Chain
Snowflake's data-sharing capabilities have revolutionised decision-making for a fast-food restaurant chain. They can effortlessly share crucial sales, inventory, and operational data with external entities, expanding from three to over 30 parties.
With a high-performance database platform hosting over 2 million transaction records, the restaurant chain has established a robust data management and analysis infrastructure through Snowflake, empowering its operational and marketing endeavours.
Moreover, by consolidating all data onto Snowflake, the organisation has achieved a remarkable 70% reduction in operational IT costs, demonstrating the platform's efficiency and cost-effectiveness.
Centralising and sharing data with Snowflake significantly eased the development of data products for various purposes, including marketing campaign analytics, quotation success metrics, production line tools, and supply chain dashboards. These data products are utilised by thousands of users globally, including internal stakeholders and external vendors, enhancing collaboration and efficiency across the organisation.
What are the best practices for Snowflake data sharing?
Optimize your Snowflake data sharing experience with these essential practices. Ensure data security by utilizing secure views to filter and mask sensitive information. Enhance clarity and understanding by employing descriptive names and comments for your shares. Monitor and fine-tune your sharing activities using Snowflake Information Schema or Account Usage views. Foster communication and collaboration with your consumers to create a seamless workflow.
Take command of your data sharing environment by setting quotas and limits with the ALTER SHARE command. Keep your consumers informed about any changes or updates to your shares, and actively seek feedback to refine your data-sharing strategy. Explore additional data sources through Snowflake Data Exchange or Data Marketplace to enrich your analytics.
These best practices safeguard sensitive data, ensure compliance with data privacy regulations, clarify the purpose of each share, and provide insights into usage and performance, ultimately enhancing your data analysis capabilities. Below are some best practices for data sharing with Snowflake:
- Understand Snowflake Data Sharing Familiarize yourself with Snowflake's data sharing features, such as Secure Data Sharing (SDS) and Sharehouse, to leverage the platform effectively.
- Role-Based Access Control (RBAC) Implement strong RBAC policies to control who can share data and who can access shared data. Define roles and permissions to ensure data security and compliance.
- Secure Data Sharing Use Secure Data Sharing (SDS) to securely share data with external parties without copying or moving the data. Implement encryption and access controls to protect sensitive information.
- Sharehouse Best Practices If using Sharehouse, follow best practices for creating and managing share objects. This includes defining share schemas, tables, and using the appropriate share options for your use case.
- Data Masking and Redaction Apply data masking or redaction policies to shared data to protect sensitive information. Ensure that shared data complies with privacy regulations and internal data governance policies.
- Query Performance Optimization Optimize query performance for shared data by using clustering keys, partitioning, and indexing. This helps enhance the efficiency of queries on large datasets.
- Versioning and Change Tracking Implement versioning and change tracking mechanisms to keep track of updates and changes in shared data. This ensures data lineage and helps with auditing and troubleshooting.
- Documentation and Metadata Maintain comprehensive documentation and metadata for shared datasets. Include information about the source, purpose, and any transformations applied. This helps users understand the shared data context.
- Governance and Monitoring Establish governance practices for data sharing, including regular reviews of shared data objects and access logs. Monitor data-sharing activities to identify any anomalies or potential security issues.
- Educate Users Provide training and documentation for users involved in data-sharing activities. Ensure they understand the best practices, security protocols, and the impact of data sharing on performance.
- Regular Audits and Reviews Conduct regular audits and reviews of shared data objects, permissions, and access controls. This helps maintain data integrity, security, and compliance with organizational policies.
- Cost Monitoring
By adhering to these best practices, you can:
1. Shield Sensitive Data: Employ secure views to fortify sensitive information.
2. Navigate Data Privacy Regulations: Ensure compliance with data privacy regulations by controlling access and usage.
3. Illuminate the Purpose of Each Share: Maintain transparency regarding the intended purpose and content of each shared dataset.
4. Efficiently Monitor Usage and Performance: Keep a finger on the pulse of usage patterns and optimize performance for streamlined data sharing.
5. Elevate Your Data Analysis Journey: Enrich your analytics by exploring diverse data sources and unlocking fresh perspectives.
What’s Next
1. Enhanced Data Collaboration Tools:
Best Way to Share Data for Your Business
For secure collaboration, old ways of copying data are no longer the best. If you're working with trusted partners and it's privacy-compliant, Snowflake Secure Data Sharing is a quick and secure option. But, if you're dealing with sensitive or regulated data, especially when the risk is high, consider using a data clean room for an extra layer of security and compliance.
Beinex + Snowflake Offerings
Beinex’s partnership with Snowflake enables us to offer you advanced features like automated tuning and elastic compute, along with analytics modernisation services, to help your organisation realise exponential Return on Investment.

Optimizing Cost Management with AWS Cost Explorer
Benefits of AWS Cost Optimization
Optimizing AWS costs is a vital part of effectively utilizing AWS services. Businesses can leverage the wide array of AWS services and pricing models to learn how to optimize costs and save considerable amounts of money. AWS Cost Optimization offers several key benefits to organizations looking to manage and reduce cloud expenses while maximizing efficiency. Let's take a look at the benefits of cost optimization with AWS: Enhanced flexibility: AWS offers flexible and cost-effective purchase plans like Reserved Instances or Amazon EC2 Spot Instances, enabling businesses to select the suitable pricing models that best fit their requirements. Boosted efficiency in resource utilization: Allocate resources effectively by rightsizing your instances, identifying the optimal size for your compute workloads, selecting the right data storage and transfer options, and eliminating unused resources. This prevents overprovisioning and ensures optimal usage of available services. Increased cost savings: AWS identifies unused resources and helps businesses scale down their infrastructure, reducing cloud costs and saving big. AWS cost optimization also ensures that you pay only for what you need, enhancing the efficiency of your cloud operations. Improved budgeting and forecasting: AWS Cost Optimization gives businesses greater visibility into spending patterns, enabling them to forecast costs and create accurate and realistic budgets based on seasonal trends, historical usage patterns, and business growth projections. Increased scalability: By employing cost optimization strategies, businesses can seamlessly scale resources on demand and pay for the requirement only when needed. Optimizing costs for seasonal fluctuations, changing workloads, and business growth ensures scalability in your AWS environment.
A Quick Look into AWS Cloud Cost Optimization Tools
AWS Cost Explorer: A tool that offers insights into the cost and usage of AWS services by giving a detailed picture of AWS spending. Its benefits include: • Identifying areas where costs are optimized • Forecasting future costs • Planning and budgeting AWS costs AWS Budgets: A tool that allows users to create custom cost and usage budgets for AWS services. It enables users to take corrective action by sending alerts when cost and usage thresholds exceed. Its benefits include: • Handling AWS spend by setting and monitoring budgets • Avoiding unforeseen expenses and cost overruns • Providing suggestions for cost optimization AWS Trusted Advisor: A tool offering tailored recommendations for optimizing AWS costs, performance, and security. It is free of charge for all AWS users. Its benefits include: • Delivering actionable insights from usage data • Offering personalized recommendations from usage data • Identifying areas where costs can be lowered AWS Pricing Calculator: A tool that helps users get estimates before choosing a service and enables the assessment of calculations based on the estimates. Its benefits include: • Identifying possible areas for cost-saving • Planning budget effectively • Providing insights into the costs you expect for a service
Optimizing Cloud Costs with AWS Cost Explorer
A robust tool that enables users to visualize, analyze, and monitor AWS costs, AWS Cost Explorer offers a granular view of your AWS spending and usage. It allows you to track your spending over time, detect cost trends, and investigate specific resources to understand where the money is spent. Cost Explorer provides a detailed report on cost, usage, and Reserved Instances and a main graph that helps you drill down into costs and usage. Users can access data for up to the last thirteen months, get suggestions for RI purchases, and predict expenses for the next twelve months. Besides, Cost Explorer offers insights into user spending by identifying areas for examination. Users can also set up preconfigured views to track overall cost trends while customizing views to align with user requirements. AWS Cost Explorer has some incredible features that assist you in comprehending and managing your spending. Data Exploration: Access AWS Cost Explorer directly from the Billing and Cost Management console. With the ability to filter and group data by dimensions such as service, usage type, region, and tags, you can dive deep into specific areas and identify key cost drivers. Report Generation: Build custom reports to monitor your costs and usage trends over time. These reports can be saved and scheduled for regular updates, offering continuous insights into your spending patterns. Costs Forecasting: Leverage Cost Explorer's forecasting feature to predict future expenses based on historical data. The predictive faculty supports better budget planning and more efficient resource allocation. Businesses that do not optimize costs can face higher costs, inefficient use wastage of resources, and severe impact on profit. Therefore, AWS cost optimization is essential for utilizing cloud resources efficiently and cost-effectively, potentially saving money for businesses in the long run. The benefits of cost optimization include lowering costs, offering predictability, preventing unforeseen expenses and cost overruns, and enhancing resource utilization, which drives business growth and sustainability.

Spatial Parameters: Enhancing Geospatial Analysis and Adding Interactivity to Your Maps
What Are Spatial Parameters?
Spatial parameters in Tableau allow you to dynamically interact with geospatial data within your visualizations. These parameters enable you to select spatial objects like points, polygons, multi-polygons, lines, or collections for calculations. Unlike traditional parameters, which work with values like text or numbers, spatial parameters offer the flexibility to work with geospatial data like coordinates and spatial shapes. You can create spatial parameters in two ways: 1. From a data source: If your data contains spatial fields (like latitude and longitude), you can load these as spatial parameters. 2. Using Well-Known Text (WKT) : This method allows you to manually input spatial data in text format to create custom spatial parameters. Spatial parameters can be used in the same way as other parameters in Tableau, including parameter controls, actions, and dynamic values. Note: Spatial parameters can only be created from spatial data fields (such as latitude and longitude). Creating spatial parameters from text string fields, like a "Country" field, is not feasible as it might be assigned as a geographic role but remains a text field.
Top Benefits of Using Spatial Parameters
Spatial parameters have offered immense possibilities for Tableau experts to analyze and visualize geospatial data. Key benefits are listed below: 1. Cross-Data Source Spatial Exploration With spatial parameters, you can explore spatial relationships between data sources that don't support joins. Unlike traditional data sources, which can be limited by join constraints, spatial parameters allow you to compare spatial regions from different datasets. This means you can dynamically analyze relationships across multiple data sources without the need for complex joins. 2. Skip Long Joins Previously, working with large spatial datasets required time-consuming spatial joins. Now, spatial parameters enable you to bypass these long joins and conduct spatial analysis much faster. You can use parameters to compare regions across multiple data sources instantly, even with vast datasets. 3. Interactive and Dynamic Analysis Spatial parameters allow users to visually interact with geospatial data in real time. Like other parameter types, you can use parameter controls to input points, lines, or polygons and adjust your analysis on the fly. This flexibility allows you to dynamically change spatial boundaries and relationships during your analysis. 4. Distance-Based Queries With spatial parameters, you can perform distance-based queries without complex calculations. For example, you can control the size of a buffer and see what lies within that buffer directly from the worksheet. This makes it easy to conduct proximity analysis without the need for complicated formulas. 5. Create Custom Regions Spatial parameters allow you to create custom regions by selecting points, lines, and polygons and combining them into a single parameter. For instance, you can create a sales region by combining multiple states into one spatial parameter. This enables you to tailor regions for specific analysis scenarios.
Spatial Calculations in Tableau 2024.3: What’s New
Tableau 2024.3 also introduces three new spatial calculations to help you evaluate spatial relationships: • SYMDIFFERENCE: Identifies areas that are unique between two regions. • INTERSECTION: Shows the overlap or intersection between two regions. • DIFFERENCE: Displays areas present in one region but not in the other. These new spatial calculations provide powerful tools to analyze and compare geospatial data.
Union Aggregation for Spatial Data
In previous versions of Tableau, the only aggregation available for spatial data was Collect, which groups spatial elements together. Union Aggregation has been introduced in Tableau 2024.3, allowing you to dissolve the boundaries between regions and providing even greater flexibility in working with spatial data.
Validating Spatial Calculations
Tableau 2024.2 introduced the Validate Calculation feature, which can help you detect and correct errors in your spatial data. This tool is handy when working with complex spatial datasets. Tableau's new Spatial Parameters and related features, such as spatial calculations and union aggregation, provide powerful capabilities for geospatial analysis. Whether comparing spatial regions, performing proximity-based queries, or creating custom areas, these features enable dynamic and flexible analysis beyond traditional methods.
How Beinex Can Assist You
Beinex, a premier Tableau partner, provides sustainable analytics solutions to organizations and helps to build superior data visual analytics capabilities internally through our bespoke training programs. Our team of Tableau-certified consultants are real-life Tableau business users passionate about Tableau and delivering a world-class experience. Connect with us for a free demo: https://www.beinex.com/free-tableau-software/

An Ultimate Guide on Amazon Bedrock: How Businesses Can Turn Generative AI into Real Business Value
What is Amazon Bedrock?
Amazon Bedrock is a fully managed AWS service designed to help businesses quickly build and deploy generative AI applications. It offers access to a variety of high-performing foundation models from leading AI companies, including AI21 Labs, Anthropic, Cohere, and Stability AI, through a single, unified API.
What makes Bedrock especially appealing to enterprises and fast-growing businesses is that it takes the heavy lifting off their shoulders. There’s no need to manage model training infrastructure, scale servers, or worry about data exposure. You can just focus on building applications; AWS handles the rest.
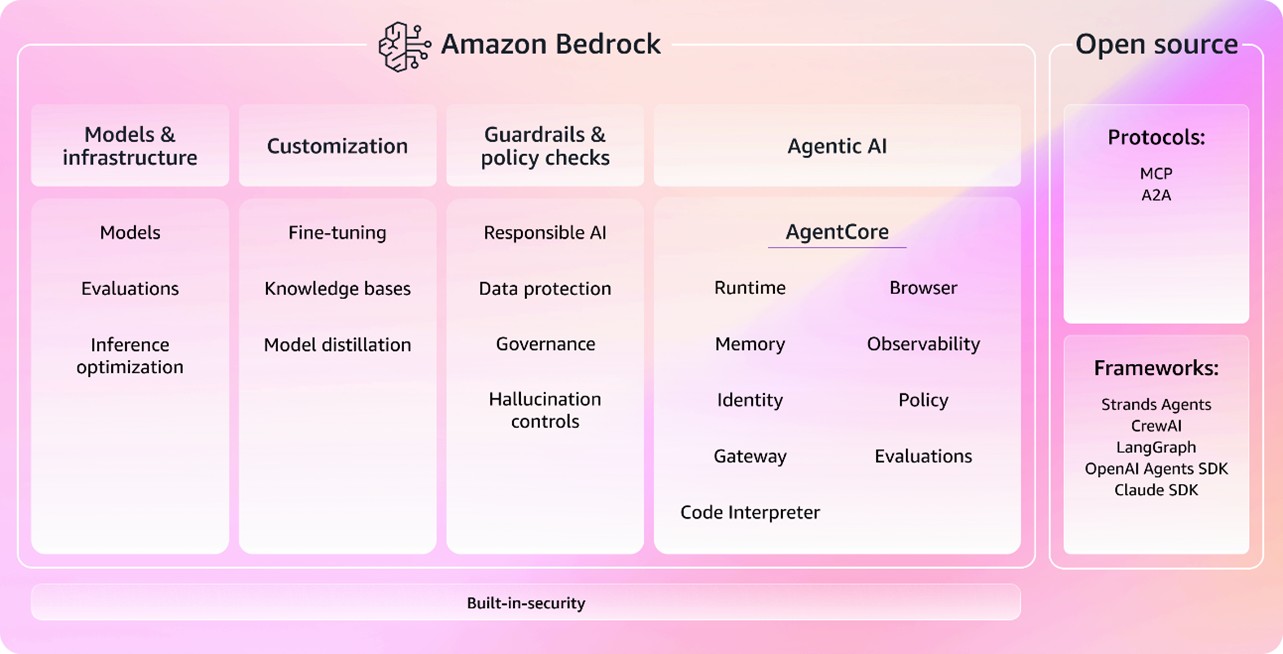 Source: AWS
Key Features of Amazon Bedrock
Let’s break down the key features powering AWS Bedrock:1. Access to Foundation Models
Amazon Bedrock offers ready-to-use models that are pre-trained, reliable, and production-ready, and are capable of tasks like:
- • Conversational AI and chatbots
- • Image generation
- • Text generation and summarization
- • Content classification and analysis
2. Secure Model Customization
Businesses can customize foundation models using their own proprietary data—without that data ever leaving their AWS environment. This is especially critical for industries, such as finance, healthcare, and government, where data governance and compliance matter.
3. Serverless Infrastructure
As Bedrock is completely serverless, there is no need to provision, manage, or scale infrastructure. Applications can also start small and scale instantly with demand, thereby making them ideal for both startups and large enterprises.
4. Single API Integration
Bedrock integrates seamlessly with existing AWS services and enterprise systems via a single API. This feature simplifies development and speeds up time-to-market.
5. Model Playground
AWS provides a Bedrock Playground, a visual interface where users can experiment with text, image, and chat models before deploying them into applications, making it helpful for teams evaluating use cases or testing outputs.
Top Benefits of Choosing Amazon Bedrock for Your Business
Amazon Bedrock stands out because it makes generative AI practical, not just impressive. Here are the top benefits organizations gain by adopting Amazon Bedrock:
Access AI Faster
Teams can start building generative AI applications without deep machine learning expertise, as it removes technical barriers.
Increased Efficiency
Businesses can prototype and deploy solutions faster, thereby accelerating innovation cycles instead of spending months building models from scratch.
Affordable AI Implementation
The cost of building AI capabilities can be significantly reduced by using pre-trained models, especially when compared to developing custom models.
Built for Scale
Bedrock supports enterprise-scale workloads while maintaining performance and reliability powered by AWS infrastructure.
Flexible Across Use Cases
From customer engagement to analytics and creative design, Bedrock supports a wide range of business needs on a single platform.
Real-World Use Cases for Amazon Bedrock
As you are now familiar with Amazon Bedrock, let’s understand how your business is going to benefit through some real-life use cases of Bedrock:
1. Customer Service Automation
Businesses can build AI-powered chatbots to handle order tracking, FAQs, and troubleshooting. It reduces response time, improves customer experience, and allows support teams to focus on complex issues.
2. Marketing and Content Creation
Marketing teams can generate blog drafts, social media copy, email campaigns, and product descriptions more quickly, freeing up time for strategy and creativity.
3. Product and Experience Personalization
Bedrock-powered applications can deliver personalized product recommendations and content, increasing engagement and conversion rates by analyzing customer behavior.
4. Analytics and Business Insights
Amazon Bedrock can summarize complex datasets, generate executive summaries, and highlight trends, making data easier to interpret for leadership teams.
5. Design and Creative Workflows
Design teams can use generative AI for image creation, branding concepts, and campaign visuals, speeding up ideation and iteration without replacing creative control.
Summing Up
If you are looking to move beyond experimentation and into real-world AI impact, Amazon Bedrock offers a practical, future-ready foundation. It can support you by providing:
- • Enterprise-grade security and compliance
- • Rapid deployment for competitive markets
- • Scalable solutions without operational complexity
For a free demo, connect with us: https://beinex.com/beinex-amazon-web-services/

Measuring Data Culture Maturity: How to Evaluate and Maximize the Benefits of a Mature Data Culture
What is the Data Culture Maturity Model?
The Data Culture Maturity Model by Alation is a framework designed to guide organizations through various levels of data proficiency. It categorizes data culture maturity into distinct stages, allowing organizations to understand their current position, set achievable goals, and implement strategies to progress further. This model addresses data discovery, data governance, data literacy, and data leadership elements that collectively foster a robust data culture. Each phase in the model encourages organizations to embed data at the core of their operations, transforming it into a valuable resource for decision-making and competitive advantage.
Why is Data Culture Maturity Important?
Data culture maturity is crucial for leaders who recognize that a data-driven approach can be a differentiator in today's competitive market. For CDOs, CIOs, BI professionals, and business leaders, fostering a mature data culture means establishing a strong foundation for data-enabled innovation and agile decision-making. As data culture evolves, organizations can explore the benefits of data self-service, increase trust in data, and leverage data literacy to make decisions backed by concrete insights.
Empowering a Data Culture: Key Tenets
The Alation Data Culture Maturity Model comprises four core tenets that organizations should focus on to elevate their data culture: Data Search & Discovery, Data Governance, Data Literacy, and Data Leadership. Let’s explore each tenet and its role in building a mature data culture.
1. Data Search & Discovery
Data Search & Discovery is the foundation of any data culture. It focuses on enabling users to quickly and easily find, understand, and trust the data they need. Organizations with mature data search capabilities invest in technologies like data catalogs, which streamline data search through features like intuitive search, contextual data, and cross-platform integration. These tools reduce the time users spend searching for data, empowering analysts to focus on value-added tasks instead of answering repetitive data queries. Alation pioneered the data catalog concept, which has evolved into a comprehensive data intelligence platform. The modern data catalog supports not only data search and discovery but also functions like data governance and cloud migration. These capabilities create a data culture that encourages self-service and fosters a deeper understanding of the data available to all employees. Measuring Value: Data search maturity can be measured by the time saved on data searches, the frequency of data queries, and the volume of self-service analytics. Organizations can leverage these metrics to assess their return on investment (ROI) and the efficiency of their data catalog.2. Data Governance
Data Governance establishes the rules and policies that ensure data is managed responsibly and is readily accessible and secure. In a mature data culture, governance extends beyond compliance, enhancing data search and data literacy. Organizations with strong governance frameworks reduce the risk of regulatory fines, establish data trustworthiness, and improve data quality. Defining Data Governance: Data governance can be seen as the “authority and control” over data assets. This entails organizing policies, procedures, roles, and responsibilities to align with the company’s data goals. Alation emphasizes that governance must go beyond traditional definitions to include active governance, which fosters collaboration, defines common data language, and establishes shared processes. Measuring Value: Effective governance can be measured by the percentage of data assets that meet governance standards, the number of governance-related issues resolved, and regulatory compliance rates. This not only assures data quality but builds trust in data for decision-making.3. Data Literacy
Data Literacy is about ensuring that individuals at all levels can read, work with, analyze, and argue with data. This element focuses on equipping employees with the skills to understand and utilize data effectively, bridging the gap between raw data and actionable insights. Building data literacy involves training, creating a framework for collaboration, and promoting data-driven thinking. Building Data Literacy: Successful data literacy programs generally follow a step-by-step approach, starting with assessments, followed by targeted training, and promoting an internal culture of data use. Organizations can embed literacy initiatives in data catalogs, where employees can access learning resources, engage in discussions, and collaborate with subject-matter experts. Measuring Value: Data literacy maturity can be assessed by monitoring the percentage of catalog contributions from a broad base of users, showing a shift from “gut-based” to data-driven decision-making. Additionally, organizations can track the frequency of cross-departmental data collaborations as an indicator of a well-integrated data culture.4. Data Leadership
Data Leadership is the most vital element, acting as the catalyst that drives data culture maturity forward. Effective data leaders champion data initiatives, implement change management programs, and consistently highlight the connection between data and business outcomes. They focus on aligning data objectives with strategic goals, ensuring that data initiatives generate tangible business value. The Role of Data Leadership: Mature data leaders embed data in strategic planning, empower departments to utilize data in decision-making, and foster a data-driven mindset throughout the organization. They work to make data initiatives visible, promoting metrics and KPIs that reflect the value added by data maturity. Measuring Value: Organizations can measure data leadership through the number of data stewards and subject matter experts identified, the impact of data on key business outcomes, and the frequency of data-driven initiatives across departments. When leadership drives data culture, the organization benefits from enhanced innovation, agility, and competitive advantage.Articulating Business Value Through Data Maturity
One of the primary objectives of the Data Culture Maturity Model is to showcase how advanced data culture drives business outcomes. To demonstrate this, data leaders can tie maturity metrics to specific business cases, such as self-service analytics, regulatory compliance, and data democratization.
Self-Service Analytics
In organizations with high data culture maturity, self-service analytics is a practical application. With accessible data catalogs and robust data literacy programs, employees can independently search, analyze, and interpret data. This capability speeds up decision-making and fosters a sense of ownership in data-driven outcomes. Measuring Success: Key metrics include time saved in data discovery, the reuse of existing data reports, and improved analytics turnaround. Organizations with a mature self-service model also report a higher degree of cross-departmental data sharing, indicating a well-established data culture.Active Data Governance
Active data governance ensures that data is handled in a structured and compliant manner. This framework allows organizations to confidently share data, meet regulatory standards, and promote accountability. Cataloging data assets facilitates governance, giving leaders insight into who accesses data, where it’s used, and how it complies with policies. Measuring Success: Metrics such as compliance rates, the reduction of data-related risks, and the number of governance-compliant assets serve as valuable indicators. Strong governance fosters trust in data, enhancing organizational agility and data-driven decision-making.Cloud Data Migration
Cloud data migration initiatives also benefit from a mature data culture. When data is cataloged and governed effectively, migrating to the cloud becomes a streamlined process. Migrating to cloud-based platforms not only reduces infrastructure costs but enables scalable data access and faster analytics. Measuring Success: Metrics to gauge the success of cloud migration include the speed of migration, the reduction in storage costs, and the increased accessibility of data post-migration. A data-mature organization can better leverage cloud capabilities for innovation and resilience.Conclusion: Tying It All Together
The Alation Data Culture Maturity Model provides a comprehensive framework for organizations looking to elevate their data culture. By focusing on data search & discovery, governance, literacy, and leadership, companies can foster a data-centric environment where data is trusted, accessible, and utilized effectively. Measuring the maturity of these components helps organizations quantify their data culture and demonstrate the business value added at each stage. In partnership with Alation, Beinex delivers comprehensive data governance solutions that enhance discoverability, enforce robust access controls, and streamline data auditing processes. By leveraging Alation's industry-leading data intelligence platform, Beinex helps organizations optimize their data strategies, driving business growth and operational efficiency. Connect with us for the transformation you seek: https://beinex.com/data-governance/