How AI Decision-Making is Improving Enterprise Outcomes
Blog
Share 
SELF SERVICE AUDIT ANALYTICS
TRANSFORM THE WAY YOU AND YOUR ORGANIZATION WORK WITH DATA –SELF SERVICE AUDIT ANALYTICS
Increasing complexities of risks and incessant emergence of disruptive technologies are demanding substantial change in internal audit processes. In today’s world of constant disruption, internal audit should evolve into a dynamic and future-oriented function. Businesses need broad-spectrum audit processes that extend beyond reviewing the obvious. Auditors should adopt forward-looking IA approaches, and should be able to provide deeper and valuable insights on strategy, execution, emerging risks, and hidden opportunities.
The 2016 Deloitte Global Chief Audit Executive Survey that polled more than 1200 CAEs from 29 countries and a diverse range of industries, reaffirms the growing need to conduct analytics-based auditing. More than a three quarter of the CAEs (79%) recommend the need for digital disruption and innovation to transform internal audit and enhance its value. The survey also cited the increasing relevance of cutting-edge technologies such as artificial intelligence, cognitive computing, and visual analytics.
Is skill-gap a concern?
More than half of CAEs (57%) who participated in the survey expressed their intense dissatisfaction about inadequate skills and insufficient expertise of audit teams.
When left unaddressed, these skill gaps will weaken auditors’ capabilities to deliver on changing stakeholder expectations. Stakeholders expect more forward-looking analysis to uncover risks and hidden opportunities. Or, gone are the days of static audit reports and analysis of sample data.
The Deloitte survey also cites risk anticipation (39%) and data analytics (34%) as the two groundbreaking innovations that are most likely to impact internal audit within the next five years. Changing business landscapes, technological advancements, and proliferation of data have brought forth the imminent need to leverage analytics and data visualization to increase the impact, influence, and effectiveness of internal
audit
Analytics Adoption Challenges
Even after 30 years of inception of data analytics, many auditors continue to adopt conventional internal audit methods and lag in technology adoption. Wondering why? Here are some of the reasons:
Can technology disruption be a savior?
Advancements in technology are fundamentally changing the nature of the audit and improving its effectiveness and relevance. Here are a few game-changing technology solutions that auditors can harness effectively to enhance the way they work with data:
1.Self-service analytics – Smart analytics for all
Self-service analytics is no more a buzzword. It’s the new norm. Self-service analytics empowers auditors to access data, perform queries, and create interactive reports that add richness and granularity to the insights derived. Anyone and everyone, with or without technical expertise, can harness the power of self-service analytics to work seamlessly with large data sets of any size or type, and discover savvy insights without having to write codes or learn programming languages.
Key advantages of using self-service analytics tools: Explore your data and create ad-hoc reports without IT skills
2.Mobile Analytics – Audit insights on the go
Regardless of the size of an organization or availability of data, it takes weeks to prepare and present comprehensive audit reports. The numbers are usually saved offline as large files or copied to multiple slides for boardroom meetings.
Mobile data analytics enables a concise and easily accessible digital avatar of audit reports and dynamic dashboards that can be accessed on mobile devices to interact and proactively monitor the business information on the go.
3.Data Visualization
When it comes to presenting audit data, reports and findings, one gets a single view of the entire raw data, all at once. This makes it difficult to decipher what is important and what isn’t, the reason why the point of sharing information gets defeated. Data visualization helps get a flexible and reliable way to identify and share pertinent information in a manner that everyone can easily understand.
There are many reasons why auditing is ripe for self-service analytics and visualization driven transformation. There is more data to examine within limited time span. Most financial and operational transactions are moving online, and the number of variables, outliers, trends, and patterns to identify and analyze continue to increase each day.
Visual analytics is the fastest way to analyze and understand structured or unstructured data of any size, without IT assistance. Visual technologies help speed up and improve decision making with heat maps, bubble charts, and interactive dashboards that are easy for C-suite executive, non-technical business users, and stakeholders to understand.
Everything gets better when you can do it yourself, right? Self-service audit analytics and visualization too are not different.
Benefits of self-service analytics in Internal Audit
Skills gap
Insufficient IT support
Difficulty to manage and manipulate data
Increasing requests for ad-hoc analysis and one-off reports
Difficulty in dealing with the basic aspects of data management and governance
Easy access to any source data
Guided analysis – Faster answers to complex questions
Intuitive drag-and-drop interface to create and share interactive reports.
Natural language processing to respond to complex queries
Interactive visualizations and personalized dashboards to identify patterns and trends
Fast to deploy and easy to manage
All-encompassing data analysis anywhere, at anytime
Process more information than reading numbers
Discover insights using spatial relationships, colors, and textures
Make data accessible to a broader audience and provide users with a rich and engaging experience
Despite the fact that data analytics and CAAT have been a part of auditing for nearly thirty years, many organizations are still struggling with the implementation of effective data analytics to enhance internal audit quality and effectiveness.
Related Articles

Amazon S3 Case Study with Solutions: How Amazon S3 Glacier Instant Retrieval Transformed the BBC’s Archival Strategy
AWS BBC Case Study: Challenges Faced by BBC
The BBC Archives Technology and Services division is responsible for preserving over 16 million assets, including films, radio broadcasts, news, sports, and digital material. However, managing this vast repository came with significant challenges: • Fragmentation: Content was dispersed across multiple legacy storage systems, making data retrieval complex and inefficient. • High Costs: Maintaining outdated physical infrastructure demanded heavy financial and resource investments. • Limited Accessibility: Lack of a centralized system led to time-consuming content retrieval processes. Many global enterprises face similar struggles in balancing data accessibility with cost efficiency. To address these challenges, the BBC implemented a five-year plan to consolidate its storage using modern cloud technologies.
Key Benefits of Amazon S3 Glacier Instant Retrieval
Building on years of successful collaboration with Amazon Web Services (AWS), the BBC adopted Amazon S3 Glacier Instant Retrieval to modernize its archival strategy. Key benefits of Amazon S3 solution include: • Cost-effectiveness: Amazon S3 Glacier Instant Retrieval offers some of the lowest-cost storage for petabytes of archival data. • Instant Access: Unlike traditional archival storage, this AWS solution provides rapid retrieval speeds, making it ideal for time-sensitive content. • Scalability: AWS’s robust cloud infrastructure ensures seamless expansion as data volumes grow, future-proofing the BBC’s archives. This transition solved immediate storage challenges and laid the groundwork for a scalable, digitized archive that will serve future generations.
The Migration Journey: 25 PB in 10 Months
Over a span of 10 months, the BBC successfully migrated 25 petabytes (PB) of archival data to AWS. Legacy System Retirement: Enabled decommissioning legacy tape-based storage, freeing up space and IT resources at its London HQ. Enhanced Cost Efficiency: Reduced operational costs by integrating Amazon S3 Glacier Instant Retrieval and Amazon S3 Intelligent-Tiering. Optimized Storage Management: Automated data tiering based on access patterns to balance cost and performance. Improved Data Accessibility: Ensured seamless access to historical media archives for future content innovation.
Building a Future-Ready Data Lake
The BBC’s cloud migration is not just about cost savings and accessibility—it’s about innovation. With its archival content securely stored on AWS, the broadcaster now focuses on developing a comprehensive data lake. This centralized repository will power advanced analytics and machine learning (ML) applications, unlocking new capabilities such as: • Speech-to-text processing for historical broadcasts • Facial recognition for identifying individuals in archival footage • Automated metadata tagging to enhance searchability and categorization By embracing Amazon S3 Glacier Instant Retrieval, the BBC is building an infrastructure that will preserve its media legacy and revolutionize how historical content is accessed and utilized in the digital age.
Amazon S3 Case Study Examples: Lessons for Organizations Everywhere
The BBC’s experience provides a valuable blueprint for organizations looking to modernize their data management strategies. Key takeaways of this BBC Amazon S3 Case Study include: • Modernization is Essential: Cloud-based solutions like Amazon S3 Glacier Instant Retrieval significantly reduce operating costs and enhance data accessibility. • Scalability Matters: AWS storage solutions offer seamless expansion, ensuring long-term sustainability. • Future-Proofing Archives: A centralized data lake paves the way for leveraging machine learning, AI, and advanced analytics, unlocking new insights from historical data. Adopting AWS archive storage solutions can benefit organizations across industries, including media, government, and education, by ensuring efficient, cost-effective, and future-ready data management.
Summing Up
The BBC’s successful migration of 100 years of archival content to Amazon S3 Glacier Instant Retrieval is a testament to the transformative power of cloud-based archival storage. By overcoming high costs, fragmented data storage, and limited accessibility, the BBC has preserved its invaluable media heritage and set a new industry standard for digital archiving.

Top 4 Enterprise Data Visualization Tools: A Complete Guide
What is Data Visualization?
Data visualization is the process of representing data in a graphical or spatial format, allowing for easy visual analysis without technical jargon. Unlike raw numerical data, visual representations like charts, graphs, and maps help quickly identify patterns, trends, and anomalies, facilitating faster and more accurate insights.
Benefits of Data Visualization
Understanding raw data can be challenging due to its complexity. Data visualization addresses this by:
- Simplify Data Interpretation: Converting raw data into charts and graphs makes it easier to understand underlying patterns and relationships.
- Identify Trends and Anomalies: Visual formats highlight trends and anomalies that might be missed in numerical data.
- Improve Accessibility: Data visualization makes information accessible to a broader audience, including those without strong analytical skills, thus improving data-driven decision-making across departments.
- Advanced Data Storytelling: Effective visualization techniques turn data into compelling stories that facilitate better communication and understanding.
What Are Data Visualization Tools?
Data visualization tools provide designers with an efficient way to create visual representations of large data sets. When dealing with data sets that include hundreds of thousands or millions of data points, automating the visualization process simplifies the designer's job considerably.
Key Benefits of Data Visualisation Tools
- Dashboards: To monitor and analyze key performance indicators (KPIs) and metrics in real-time.
- Annual Reports: To present data-driven insights to stakeholders in a clear and engaging manner.
- Sales and Marketing Materials: To showcase trends, performance, and forecasts to potential clients and customers.
- Investor Slide Decks: To communicate financial health and growth prospects effectively.
- General Information Interpretation: To make complex data understandable for decision-making processes in virtually any context where quick interpretation of information is necessary.
A Compact List of Top Data Visualization Tools
Here are the top enterprise data visualization tools for creating compelling visualizations:
- Tableau
- Google Charts
- Zoho Analytics
- Data Wrapper
Tableau
Tableau is a top-tier platform recognized for its user-friendly interface. It adeptly integrates data from multiple sources to create dynamic and visualisations.
Its comprehensive suite of products spans desktop applications, robust server solutions, and flexible web-hosted environments, empowering organizations to drive informed decision-making and achieve actionable insights across their operations.
Connect with us for a free demo: https://www.beinex.com/free-tableau-software
Who Should Use Tableau?
Data scientists and analysts who need to create custom dashboards and advanced visualizations will benefit from Tableau.Key Features of Tableau
• User-Friendly Interface: Easy to learn and navigate, making it accessible for all skill levels. • Mobile-Friendly: Create reports and dashboards optimised for mobile devices, allowing you to access and analyse data on the go. • High Performance: Efficiently handles large datasets, ensuring seamless analysis without performance issues. • Interactive Visualizations: Build interactive and dynamic visualisations, allowing deeper data exploration. • Integration Capabilities: Integrates well with various data sources and other business applications, enhancing data connectivity. • Real-Time Data Updates: Provides real-time data updates, ensuring you have the most current insights. • Collaboration Tools: Facilitates easy sharing and collaboration on reports and dashboards within teams. • Customizable Dashboards: Offers highly customisable dashboards to meet specific business needs and preferences. • Advanced Analytics: Supports advanced analytics features, including trend analysis, forecasting, and statistical summaries. • Security: Ensures data security with robust access controls and permissions.
Learn more: https://www.beinex.com/tableau-partnership-and-consulting-services/Google Charts
Google Charts is a free tool for creating interactive data visualisations, accessible through most web browsers. It supports various data sources, including spreadsheets and databases.
Who Should Use Google Charts?
Students, universities, and businesses needing fundamental charts will find Google Charts useful.Key Features of Google Charts
• User-Friendly Interface: Easy to use with a straightforward setup process. • Wide Range of Chart Types: Supports various chart types, including line, bar, pie, scatter, and more. • Customizable: Offers extensive customization options to tailor charts to specific needs, including colors, fonts, and annotations. • Interactive Charts: Allows for interactive elements such as tooltips, zooming, and panning. • Cross-Platform Compatibility: Ensures charts work seamlessly across different browsers and devices. • Dynamic Data Updates: Supports real-time data updates, keeping charts current with live data feeds. • Integration with Google Services: Easily integrates with other Google services such as Google Sheets and Google Analytics. • Embedding Capabilities: Simple embedding in websites and applications with a few lines of code. • Data Export Options: Provides options to export charts in various formats, including PNG, SVG, and PDF. • Open Source: Free and open source, allowing for extensive customization and community support. • Support for Multiple Data Formats: Works with various data formats, including JSON, CSV, and Google Spreadsheets. • Accessibility Features: These include features to make charts accessible to all users, including screen reader support. • Responsive Design: Ensures charts are responsive and adapt to different screen sizes and resolutions. • Powerful API: Provides a robust API for developers to create complex visualisations and integrate them into applications.
Zoho Analytics
Zoho Analytics combines business intelligence and reporting services, allowing for swift data visualisation. It is user-friendly and integrates well with other Zoho products.Who Should Use Zoho Analytics?
Analytics and sales teams, marketing teams, project managers, and more can benefit from Zoho Analytics.Key Features of Zoho Analytics
• User-Friendly Interface: Intuitive design that simplifies data analysis and visualisation. • Wide Range of Data Sources: Connects to various data sources, including databases, cloud storage, spreadsheets, and other business applications. • Advanced Analytics: Offers features such as predictive analytics, AI-powered insights, and what-if analysis. • Interactive Dashboards: Create and customise interactive dashboards with drag-and-drop ease. • Collaboration Tools: Facilitate sharing and collaboration on reports and dashboards within teams. • Embedded Analytics: Embed reports and dashboards into websites, applications, and portals. • Automated Data Sync: Schedule data imports and synchronise data regularly. • Customizable Visualizations: Provides a variety of chart types and extensive customisation options for data visualisations. • Data Blending: Combine data from multiple sources for comprehensive analysis. • AI-Driven Insights: Leverages AI to offer advanced analytical insights and pattern detection. • Real-Time Data Access: Supports real-time data integration and live dashboards. • Mobile Access: Access and interact with reports and dashboards on mobile devices. • Data Security: Ensures robust security features, including role-based access control, encryption, and compliance with industry standards. • Report Scheduling: Automate the distribution of reports through scheduled emails. • Integrations with Other Zoho Apps: Seamlessly integrate with other Zoho applications for enhanced functionality. • API Support: Provides APIs for developers to integrate analytics capabilities into custom applications. • Data Preparation Tools: These include tools for data cleaning, transformation, and enrichment.
Data Wrapper
Data Wrapper is ideal for media enterprises and allows for the quick creation of charts, maps, and plots. It is completely web-based and easy to use.Who Should Use Data Wrapper?
Data Wrapper can benefit media, news publications, government institutions and finance companies. It is especially useful for creating visually appealing and easily understandable visualisations.Key Features of Data Wrapper
• User-Friendly Interface: Intuitive and easy to use, requiring no coding skills to create professional charts and maps. • Wide Range of Chart Types: Supports a variety of chart types, including bar, line, pie, scatter plots, and maps. • Customisable Visualizations: Offers extensive customisation options for colors, labels, and annotations to match branding and presentation needs. • Responsive Design: Ensures charts and maps are responsive and adapt to different screen sizes and devices. • Interactive Elements: Allows for adding interactive elements like tooltips, hover effects, and clickable legends. • Real-Time Data Integration: Supports live data updates, enabling real-time visualisation. • Embedding Capabilities: Easily embed charts and maps into websites and blogs with simple code snippets. • Export Options: This option lets users download visualisations in various formats, including PNG, PDF, and SVG. • Accessibility: Committed to creating accessible visualisations with features that support screen readers and keyboard navigation. • Data Security: Ensures data security with robust privacy policies and compliance with industry standards. • Collaboration Tools: Allows for team collaboration with shared projects and editing capabilities. • Support for Multiple Languages: Offers multi-language support for creating visualisations in different languages. • Easy Data Import: Supports importing data from various sources, including CSV files, spreadsheets, and web links. • API Integration: Provides APIs for integrating Data wrapper with other applications and services. • Customizable Templates: Use and modify templates to maintain consistency in visualisations. • Annotation Features: Add rich text annotations directly to charts and maps to provide additional context and information.
Always Go for the Best Tool
By choosing the right data visualisation tool, organizations can discover the full potential of their data, making complex information accessible and actionable for everyone. This empowers businesses to make data-driven decisions that drive growth and innovation.

AWS Security Hub: Master Cloud Security with a Unified Approach
What is AWS Security Hub?
AWS Security Hub offers a unified, organized, and prioritized view of the compliance status and security posture of your AWS accounts in a standardized format. It automates the security best practice checks of single and multiple AWS accounts. It centralizes the security alerts into one format and place, helping you comprehend the security framework of your AWS environment. It offers a pre-built dashboard that helps manage and prioritize any alerts or issues in your AWS environment found from security checks. Security Hub assesses security controls, performs compliance checks, and generates control findings to gauge your organization's adherence to security best practices. By automating security best practice checks, Security Hub streamlines the understanding and enhancing of the security posture of your AWS accounts. It offers multiple security standards to handle your organization's security position, including Foundational Security Best Practices developed by AWS and external compliance frameworks like Center for Internet Security (CIS) and Payment Card Industry Data Security Standard (PCI DSS). These standards have various security controls, each defining a security best practice. Besides generating control findings, Security Hub acquires findings from AWS services like Amazon Inspector and Amazon GuardDuty and also supports third-party products, offering a centralized view of several security-related issues. Also, the automation capabilities of the Security Hub simplified the triage and remediation of security issues. For example, by setting automation rules, critical discoveries get updated automatically in case of a security check failure.Features of AWS Security Hub
Centralized Cloud Security Management: It offers a unified dashboard that tracks security findings from AWS services like AWS Config and third-party tools, enhancing and prioritizing them in a single place. Third-Party Integration: AWS Security Hub seamlessly integrates with third-party tools like Splunk, consolidating data from multiple sources into a unified view. Tailored Security Insights: It enables the customization of security insights and alerts, allowing organizations to adapt their security posture to specific needs. Automated Compliance and Security Checks: By automating compliance and security checks on AWS accounts, resources, and services, AWS Security Hub enables the detection of security issues, continuous monitoring, and evaluation while ensuring they adhere to industry best practices and standards.Top Benefits of AWS Security Hub
• Streamlines managing cloud security by centralizing all security data in a single place, offering a consolidated view that helps detect possible threats. • Enhances real-time threat detection by facilitating integration with AWS services like Amazon GuardDuty. • Ensures regulatory compliance by fulfilling the industry security criteria and standards • Conducts constant security checks by following industry standards and practices to identify and monitor AWS accounts and resources that need attention, flagging any misconfigurations in security. • Enables automated remediation for specific findings and customized actions triggered upon detection. In short, AWS Security Hub enhances cloud security by centralizing monitoring of accounts, services, and resources, performing automated security assessments, enabling businesses to comply with security standards, and integrating with AWS services for real-time threat detection. It can be quite difficult to manage security in complex cloud environments, but AWS Security Hub streamlines the process by delivering real-time security insights into your AWS environment, consolidating security alerts from different tools into a unified view, and automating security checks to enhance protection and efficiency. As an AWS consulting partner, Beinex offers AWS-managed services to our customers to host their BI solutions and more on the cloud. Our cloud migration experts ensure top-tier stability and reliability by aligning with your business strategy and collaborating closely with you to deploy AWS infrastructure as a service seamlessly. Connect with us for a free demo: https://beinex.com/beinex-amazon-web-services/
RUNNING THE MIGHTY SMALL LANGUAGE MODEL PHI-3 ON SNOWFLAKE
What is an SLM?
A Small Language Model (SLM) is tailored to excel in simpler tasks, offering boosted accessibility and user-friendliness for organizations operating with limited resources. Besides, they can be readily fine-tuned to align with specific requirements. Small language models are particularly well-suited for organizations aiming to develop applications capable of operating local devices instead of relying on cloud infrastructure. They are especially beneficial for tasks that do not necessitate extensive reasoning or immediate responses.
Reasons to use SLMs
Given the growing popularity and applicability of SLMs across various domains, particularly in areas like sustainability and the volume of data required for training, there are multiple reasons for employing them.
What is Phi-3?
Microsoft has a suite of small language models (SLMs) known as 'Phi,' demonstrating outstanding performance across various benchmarks. Microsoft's recent release is Phi-3, a series of open AI models. The Phi-3 models represent a prototype of capability and cost-effectiveness among small language models (SLMs), exceeding models of equivalent and larger sizes across the spectrum of coding, language, reasoning, and mathematical standards. This launch broadens the array of high-calibre models accessible to customers, providing them with more practical options as they craft and construct generative AI applications.
Phi-3-mini, a 3.8B language model, is accessible through Microsoft Azure AI Studio, Hugging Face, and Ollama. It is offered in two context-length variations—4K and 128K tokens. Notably, it is the first model within its category to support a context window of up to 128K tokens with minimal impact on quality. Furthermore, it is instruction-tuned, implying that it has been trained to comprehend and adhere to diverse instructions, mirroring natural human communication patterns. This ensures that the model is readily deployable straight out of the box. Phi-3-mini is available on Azure AI to leverage the deploy-eval-finetune toolchain, and it is also accessible on Ollama for developers to execute locally on their laptops.
Features of Phi-3
Phi-3 models exhibit distinctive superiority over language models of comparable and larger dimensions on key benchmarks, showcasing the following features:
Snowflake meets Phi-3: Advantages
The key pain point about LLMs is the computing required to host and run them. Setting up a dozen GPUs to run models can be expensive and complex. There's where Snowflake steps up. Snowflake's compute pool option enables users to easily and quickly set up and manage compute clusters. Phi-3 comes into the picture because of its cost-effective GPU utilization.
Can you imagine a situation where your language model only requires less than 3GB of GPU memory for inference? Well, now it's possible, all thanks to Phi-3. It's a state-of-the-art SLM that produces excellent results over GP3.5 and Mistral 8x7B, which are much bigger models. This opens the door for more cost-effective solutions to be brought up in the AI space. Add Snowflake for hosting; you have an excellent setup to host, test, and build AI applications. Read below how Beinex managed to run Phi-3 on Day 0 in Snowflake.
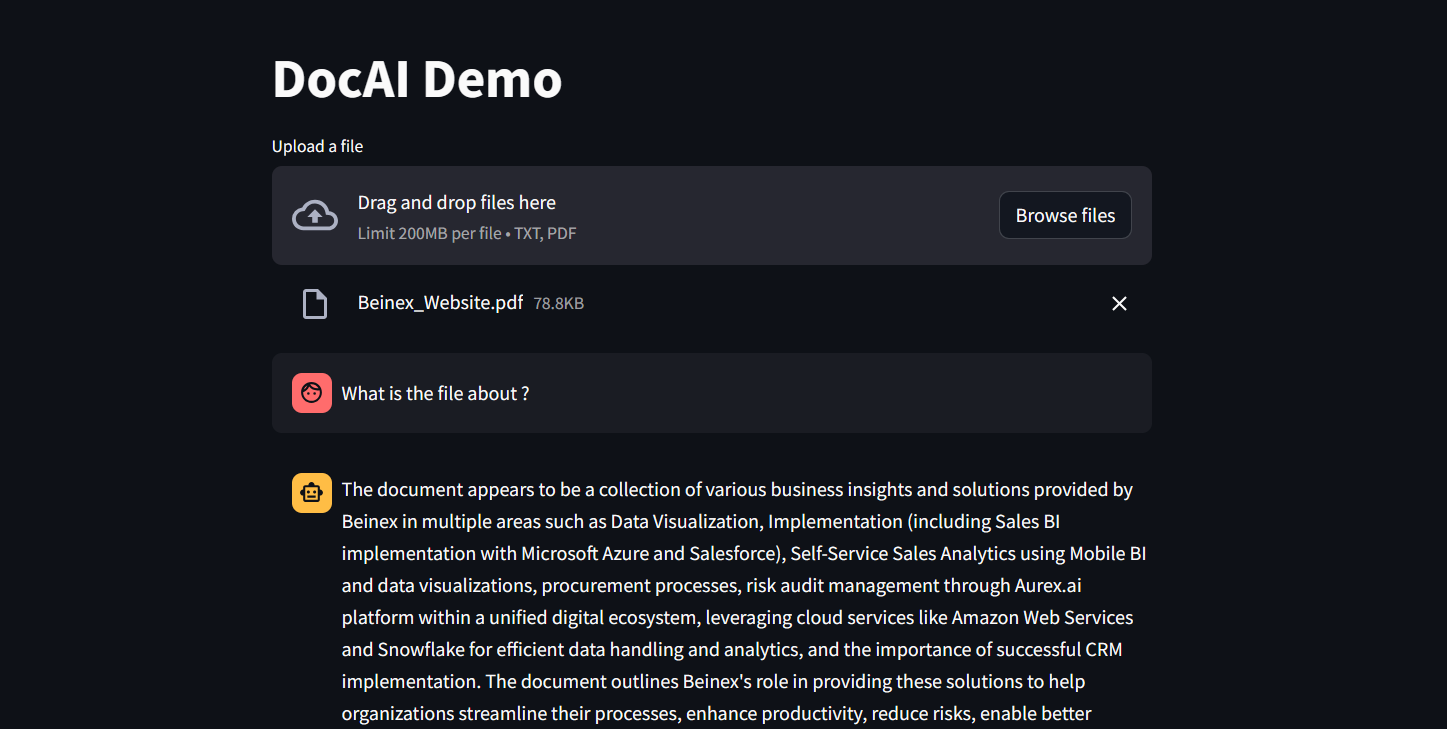 Figure 1: DocAI running on Phi-3
Implementing Phi-3 on Snowflake: What Beinex Did and How Beinex Did it?
Beinex has seamlessly integrated Phi-3 into Snowflake to help enterprises unlock their data's full potential through advanced language processing capabilities and enhance decision-making with deeper insights. The integration facilitates Snowflake users to:
Here's a detailed guide on implementing Phi-3 on Snowflake:
Step 1: Create Necessary Objects
-- Run by ACCOUNTADMIN to allow connecting to Hugging Face to download the model
-- Stage to store LLM models
CREATE STAGE <stagename> IF NOT EXISTS models
DIRECTORY = (ENABLE = TRUE)
ENCRYPTION = (TYPE='SNOWFLAKE_SSE');
-- Stage to store YAML specs
CREATE STAGE <stagename> IF NOT EXISTS specs
DIRECTORY = (ENABLE = TRUE)
ENCRYPTION = (TYPE='SNOWFLAKE_SSE');
-- Image repository
CREATE OR REPLACE IMAGE REPOSITORY images;
-- Compute pool to run containers
CREATE COMPUTE POOL GPU_NV_S
MIN_NODES = 1
MAX_NODES = 1
INSTANCE_FAMILY = GPU_NV_S;
Step 2: Docker Image Code - ollama
FROM ollama/ollama
RUN $(ollama serve > output.log 2>&1 &) && sleep 10 && ollama pull phi3 && pkill ollama && rm output.log
ENTRYPOINT ["ollama"]
CMD ["serve"]
Step 3: Tag and Push the Docker Image
docker tag ollama <SNOW_ORG-SNOW_ACCOUNT>.registry.snowflakecomputing.com/db/schema/image respository /ollama
docker push <SNOW_ORG-SNOW_ACCOUNT>.registry.snowflakecomputing.com db/schema/image repository /ollama
Step 4: Docker Image - UDF
FROM python:3.11
WORKDIR /app
ADD ./requirements.txt /app/
RUN pip install --no-cache-dir -r requirements.txt
ADD ./ /app
EXPOSE 5000
ENV FLASK_APP=app
CMD ["flask", "run", "--host=0.0.0.0"]
App.py content is given below :
from flask import Flask, request, Response, jsonify
import logging
import re
import os
from openai import OpenAI
client = OpenAI(
base_url='http://ollama:11434/v1',
api_key="EMPTY",
)
model = "phi3"
app = Flask(__name__)
app.logger.setLevel(logging.ERROR)
def extract_json_from_string(s):
logging.info(f"Extracting JSON from string: {s}")
# Use a regular expression to find a JSON-like string
matches = re.findall(r"\{[^{}]*\}", s)
if matches:
# Return the first match (assuming there's only one JSON object embedded)
return matches[0]
# Return the original string if no JSON object is found
return s
@app.route("/", methods=["POST"])
def udf():
try:
request_data: dict = request.get_json(force=True) # type: ignore
return_data = []
for index, col1 in request_data["data"]:
completion = client.chat.completions.create(
model=model,
messages=[
{
"role": "system",
"content": "You are a bot to help extract data and should give professional responses",
},
{"role": "user", "content": col1},
],
)
return_data.append(
[index, extract_json_from_string(completion.choices[0].message.content)]
)
return jsonify({"data": return_data})
except Exception as e:
app.logger.exception(e)
return jsonify(str(e)), 500
Step 6: YAML File
spec:
containers:
- name: ollama
image: <SNOW_ORG-SNOW_ACCOUNT>.registry.snowflakecomputing.com/ db/schema/image respository /Phi3
resources:
requests:
nvidia.com/gpu: 1
limits:
nvidia.com/gpu: 1
env:
NUM_GPU: 1
MAX_GPU_MEMORY: 24Gib
volumeMounts:
- name: llm-workspace
mountPath: /<stage name>
- name: udf
image: <SNOW_ORG-SNOW_ACCOUNT>.registry.snowflakecomputing.com/ db/schema/image respository /ollama_udf
endpoints:
- name: chat
port: 5000
public: false
- name: llm
port: 11434
public: false
volumes:
- name: llm-workspace
source: "@<llm stage_name>"
Step 7: Upload YAML File and Create Service
Upload the YAML file to the created stage, where the stage name in the YAML file should match the stage created in Step 2.
-- Create service
create service phi3
IN COMPUTE POOL <name of compute pool created>
FROM @dash_stage
SPECIFICATION_FILE = '<name of yaml file uploaded>';
Step 8: Create Service Function
Create a service function on the service (after it starts).
create or replace function phi3chat(prompt text)
returns text
service= phi3
endpoint=chat;
Check Service Status
Use the following command to check the status of the service:
SELECT
v.value:containerName::varchar container_name,
v.value:status::varchar status,
v.value:message::varchar message
FROM (
SELECT parse_json(system$get_service_status('<service name>'))
) t,
LATERAL FLATTEN(input => t.$1) v;
Benefits of Running Phi-3 on Snowflake
1. Cost-Effectiveness and Efficiency:
2. Compatibility with Smaller GPUs:
3. Exceptional Performance:
4. Faster Response Times:
SLM vs LLM
The choice between small and large language models hinges on organizational needs, task complexity, and resource availability.
LLMs excel in applications requiring the orchestration of intricate tasks, encompassing advanced reasoning, data analysis, and contextual comprehension.
On the other hand, SLMs present viable options for regulated industries and sectors facing scenarios necessitating top-tier results while maintaining data within their premises.
Both large and small language models possess distinct strengths and applications. While large language models thrive in managing complex workflows, small language models deliver impressive performance despite their compact size.
While some customers may exclusively require small models, others may favour larger models, with many seeking to integrate both types in various configurations. Ultimately, the optimal selection depends on the unique context and objectives of the organization. Besides transitioning from large to small models, the trend is evolving towards a diversified portfolio of models. This means that instead of relying on a single model, customers can choose from various models with different sizes, capabilities, and resource requirements. This empowers customers to decide the best model for their scenario, balancing performance and resource constraints.

Top 4 Ways on How Marketing Leaders Use Alteryx AI & Analytics Automation for Business Success
Four Ways Alteryx Automation and AI Can Transform Your Marketing Strategy:
While there are numerous objectives marketing teams can achieve with data analytics, this blog highlights four ways Alteryx automation and AI can transform your marketing strategy:
1. Centralize Your Data
As the marketing landscape prepares for a cookie-less future, having a unified view of your data is essential. Staying ahead of customer needs, competition, and campaigns requires gathering all your data in one place.
With analytics automation, you can easily integrate data from various sources—whether cloud or on-premises, first-party data, or marketing applications like web analytics and CRMs—to gain a comprehensive view of your customers. This enables marketing teams to react to market shifts in real time.
Use case:
For example, a multinational retailer leveraged analytics automation to bring together data from all customer interactions, resulting in a 37x improvement in processing efficiency. This allowed them to better understand customer behavior across multiple channels.Unlike traditional spreadsheets, which have limitations on data capacity, analytics automation platforms offer limitless capabilities, allowing you to manage vast amounts of customer and product data in one place.
How Alteryx Helps:
• Drag-and-Drop Data Integration: Simplify complex data workflows with easy-to-use, drag-and-drop tools that eliminate manual coding and reduce time to insight.
• Automated Data Cleaning: Utilize pre-built data preparation tools to clean, standardize, and transform data in just a few clicks, ensuring high-quality data for analysis.
• Cluster Analysis: Automatically group similar data points (e.g., customer segments) using clustering tools, enabling precise targeting and personalization without manual intervention.
2. Enhance Your Marketing Campaigns
Marketing success depends on speed and agility, especially when it comes to predicting market trends and competitor behavior. Optimizing targeting, pricing, or strategy without the right insights becomes a challenge. Analytics automation helps you find the right combination of offers and tactics to increase conversions and boost revenue.
Use Case:
A retail chain with 500+ stores struggled to predict customer buying patterns and optimize promotions. By implementing analytics automation, they processed customer data in real time, enabling hyper-personalized marketing campaigns that boosted conversion rates by 35%.
They also used machine learning to predict demand and optimize inventory, preventing stockouts during key promotions. Additionally, they automated pricing analysis, reducing adjustment times from weeks to hours. By integrating spatial analytics, they could identify high-performing stores and strategically allocate resources, further enhancing their marketing and sales efforts. They also automated pricing analysis based on regional market dynamics, reducing adjustment times from weeks to hours and ensuring competitive pricing across all locations.
How Alteryx Helps:
• Predictive Modeling: Leverage machine learning models to forecast demand, optimize pricing strategies, and predict customer churn, allowing for proactive campaign adjustments. • Market Basket Analysis: Identify products that are frequently purchased together to optimize cross-selling and upselling opportunities, increasing revenue per customer. • Real-Time Analytics: Process large volumes of data in real-time to quickly adjust marketing strategies and promotional offers based on current performance metrics. • Spatial Analytics: By analyzing geographic data, marketing teams can optimize store placements, allocate resources more effectively, and improve overall sales performance.
3. Maximize Your Talent and Resources
Many marketing teams struggle to turn data into valuable business insights. According to Gartner, only 53% of marketing decisions are informed by data analytics. Limited staff and time often prevent teams from fully utilizing their data potential.
Analytics automation bridges this gap by enabling teams to achieve more with fewer resources. It automates the time-consuming tasks of data cleaning and preparation, allowing marketing teams to save significant hours and focus on more strategic projects.
Use Case:
For example, a leading digital advertising agency transitioned from using spreadsheets for social media analysis to implementing analytics automation. This resulted in a 99.5% faster analysis, saving 180 weekly analyst hours. By automating routine tasks, your team can dedicate more time to high-impact initiatives, ultimately enhancing overall business value.How Alteryx Helps:
• Self-Service Analytics: Empower non-technical users to perform complex data analyses without relying on IT or data science teams, accelerating time to insight. • Workflow Automation: Automate repetitive tasks like data cleansing, transformation, and reporting, significantly reducing manual effort and minimizing the risk of errors. • Scalable Solutions: Handle vast amounts of data effortlessly, allowing your team to focus on high-impact projects without being bogged down by data management issues.4. Achieve Immediate Results While Preparing for the Future
Marketing leaders often juggle the challenge of balancing short-term returns with long-term strategic goals. Analytics automation solutions can provide quick wins while also laying a foundation for future success.
By choosing a solution that is user-friendly and easy to implement, you can skip lengthy training sessions and start seeing results quickly. Moreover, the best analytics tools are designed with the future in mind, offering integration with cloud services and AI-driven insights.
Use Case:
For example, a premier company specializing in technology services, utilized analytics automation to analyze 250 broadcast campaigns, resulting in an 88% time savings and a 25% increase in time spent on advanced analytics. The right automation tools not only generate fast results but also ensure you're ready for future growth.How Alteryx Helps:
• Quick Implementation: Start generating insights rapidly with intuitive tools that require minimal training. Alteryx’s user-friendly interface means your team can hit the ground running without lengthy onboarding sessions. • Future-Ready Integration: Alteryx seamlessly integrates with cloud services, AI platforms, and advanced analytics tools, ensuring your marketing strategy evolves alongside technological advancements. • Comprehensive Analytics Suite: From spatial analysis to text mining, Alteryx provides a wide range of analytical tools that help you address complex business questions and prepare for emerging trends.
How Marketing Teams Can Benefit from Alteryx
With Alteryx, marketing teams can benefit from:
• Self-Service Analytics: A user-friendly, drag-and-drop interface, you can easily access and analyze data without technical expertise.
• Pre-Built Analytical Tools: Utilize pre-configured tools for market basket analysis, spatial analytics, and more without needing custom development.
• Seamless Integration: Integrate Alteryx with your existing marketing tech stack for a cohesive, end-to-end analytics solution.
Alteryx+ Beinex Offerings
Our Premier partnership with Alteryx empowers business users to automate manual data cleansing and transformation tasks in minutes through a simple visual workflow while incorporating the latest technological advancements.
Connect with us for a free demo: https://beinex.com/alteryx-partner/