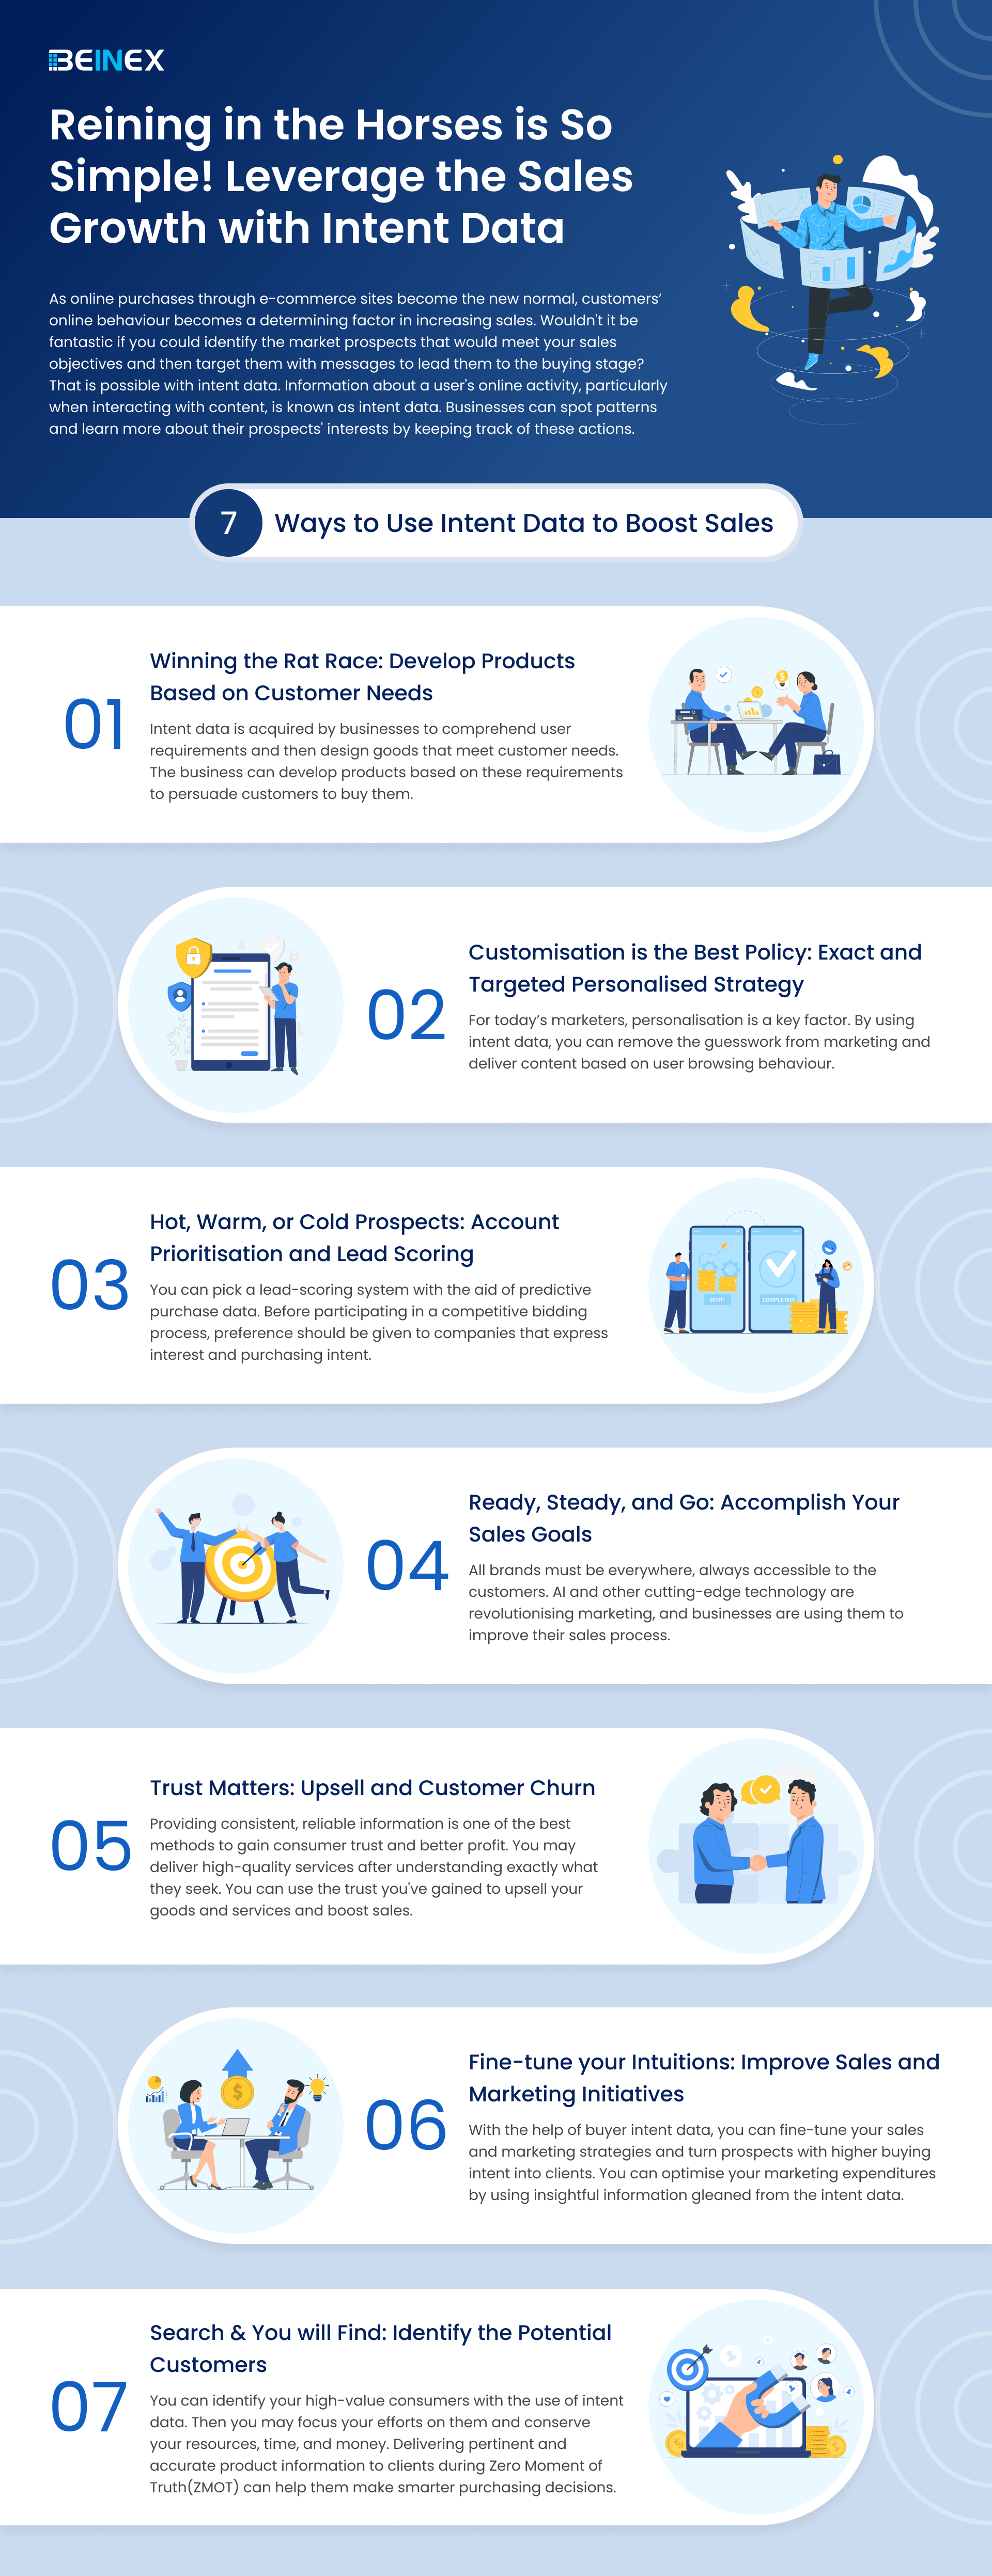
Reining in the Horses is So Simple! Leverage the Sales Growth with Intent Data(Infographic)
Related Articles
Key Benefits of AI in the UAE Banking
The tech-savvy UAE banking firms have openly welcomed conversational AI, robo-advisors, and AI-based cybersecurity solutions for risk assessment, fraud detection, customer service automation, and algorithmic trading.
AI Transforms the Banking Sector in the UAE: Key Benefits
The major advantages of AI in UAE banking are as follows: 1. AI-powered Virtual Assistants with Agentic Functionalities: Redefining Customer ServiceThe transformative power of Agentic AI has empowered virtual assistants to provide instant support, handle inquiries, process transactions, and offer financial advice autonomously. Virtual Assistants with Agentic AI functionalities make independent decisions, act, and adapt to changing situations with minimal human input. Key Benefits of Agentic Integrated & Secure AI Chatbots in Banking Agentic-integrated AI chatbots can be beneficial in banking in multiple ways, like: • 24/7 Availability: Unlike human agents, AI chatbots operate round the clock, improving response. • Cost Efficiency: Reducing the need for human intervention lowers operational costs. • Multilingual Support: AI chatbots cater to the UAE’s diverse, multilingual customer base. • Agentic/Hyper AI Capabilities: Advanced chatbots now incorporate agentic functionalities, enabling them to perform specific user-triggered actions, such as fund transfers, payments, and lodging complaints, directly on the banking account. • Integration with Banking Systems & WhatsApp Banking: Modern AI chatbots are designed for smooth integration with core banking systems and popular communication channels like WhatsApp, providing customers with a unified and convenient digital experience. • Agentic Compliance and Data Security: Advanced agentic AI systems continuously monitor all interactions and transactions, ensuring that every action complies with industry regulations while safeguarding sensitive customer data.
2. Fraud Detection Powered by AI: Increasing SecurityOne of the most important uses of AI in the banking industry today is enhancing fraud prevention, anti-money laundering (AML) measures, and transactional analysis. Traditional fraud detection systems use rule-based techniques that frequently fail to identify complex cyber threats, sophisticated money laundering schemes, and unusual transactional patterns. Conversely, AI-driven fraud detection systems use machine learning algorithms to instantly examine millions of transactions and behavioral data in real time. By integrating AI, banks in the UAE can proactively detect and prevent financial fraud, curb money laundering activities, and identify irregular transaction behavior, thereby safeguarding customer assets and bolstering institutional credibility.
Read our success story: How a Leading Bank in UAE Saved 5M+ Annually 3. AI and Compliance: Increased ProductivityBanks must ensure strict compliance with anti-money laundering (AML) laws, data protection regulations, and risk management guidelines; otherwise, it can lead to hefty fines and loss of bank licenses. Artificial intelligence (AI) in the UAE banking sector is transforming compliance by automating risk assessments, enhancing due diligence, and ensuring real-time regulatory adherence. Read Our Success Story: How a Large Regional Bank Improved Regulatory Compliance to More than 90%
Key Benefits of AI in Compliance The use of AI in compliance can offer several benefits for the banking industry in the following ways: Automated AML & KYC Processes • Detects suspicious transactions and money laundering to ensure strict compliance • Automated KYC (Know Your Customer) solutions verify customer onboarding while ensuring compliance. Regulatory Reporting & Risk Management • Automated compliance report generation ensures accuracy • Regulatory risks can be predicted using ML models Data Privacy & Protection • Adherence to data privacy regulations like GDPR can be ensured
4. Predictive AI & Hyper-Personalization in Retail BankingThe next frontier in AI-driven banking is hyper-personalization, where AI analyzes vast datasets to deliver customized experiences. Example: Personalized Investment Solutions for First-Time Investors AI can assess a mass-segment client’s financial behavior and recommend suitable investment solutions. First-time investors can receive the following: • Automated risk assessment based on their spending and saving patterns. • Customized portfolio suggestions aligned with their financial goals. • Predictive alerts for market trends to optimize investment decisions. Hyper-personalization ensures that even mass-segment clients receive expert financial guidance, making investment opportunities more accessible.
AI Regulation in the UAE
AI regulation in the UAE is shaping a secure and ethical framework for banking, ensuring compliance, fraud detection, and enhanced customer experiences. Initiatives like the UAE’s AI Charter and Saudi Arabia’s National AI Strategy provide governance structures that promote responsible AI use while fostering innovation.The Future of AI in UAE Banking
As the UAE continues to lead digital transformation in the financial sector, AI will play an indispensable role in shaping the future of banking. Beinex has a proven track record of delivering sophisticated AI and ML solutions to the leading UAE banks. If you aim for similar success by mitigating fraud and strengthening compliance, connect with us now.
Tableau Cloud Manager
Tableau Cloud Manager is an enhancement to Tableau Cloud that allows customers to create and manage multiple Tableau sites with centralized management of licenses and users. Tableau Cloud Manager simplifies the expansion and administration of your cloud analytics environment, helps ensure you meet governance and data residency requirements and introduces new administrative efficiencies. The highlights of Tableau Cloud Manager are: 1. Expand analytics across your organization with multiple Tableau Cloud sites Tableau Cloud Manager enables Tableau Cloud customers to create and manage multiple sites in a single deployment. Additionally, Tableau Cloud Admins can deploy these sites in the regions of their choice. This functionality is particularly beneficial for global organizations with geographically dispersed teams. By allowing for the establishment of region-specific sites, Tableau Cloud Manager enables tailored analytics experiences that cater to the unique needs and compliance requirements of every team in your organization. Your Tableau Cloud edition determines site limits: • Tableau Cloud (standard): up to 3 sites • Tableau Cloud Enterprise: up to 10 sites • Tableau+: up to 50 sites 2. Effectively manage multi-site deployments Tableau Cloud Manager acts as a layer atop your Tableau Cloud sites, offering centralized management features that help you scale your analytics operations. Customers who deploy multiple sites can manage sites and license users in one place, including granting users access to multiple sites without requiring distinct licenses for each site. 3. Enhance governance with a new Cloud Admin role Tableau Cloud Manager also introduces a new Cloud Admin role, a level above the traditional Site Admin. This allows for more flexibility in how your organization manages and governs your analytics environment based on your unique needs. A smaller organization may employ the same person as a Cloud Admin and a Site Admin. For larger organizations, your Cloud Admin could be someone in IT using higher-level administrative capabilities to implement more control and coordination across your Tableau Cloud sites.
Multiple External Identity Providers on a Site
You can now enable up to 20 identity providers on a single Tableau Cloud site. This feature allows administrators to offer secure access to external users, internal users, and partners. By using multiple identity providers, you can achieve site consolidation and simplify access for both internal and external users throughout the organization.
Table Viz Extension
Transform traditional reporting into visual analytics while addressing your users' needs. Tables are essential visualizations for analysts, allowing them to examine data as text and convey detailed information at a granular level. The Table Viz Extension, developed and maintained by Tableau, enables you to incorporate detailed tables and grid views into your dashboards for users who favor traditional reporting formats. You can load this new visualization type into your marks card, configure new columns by dragging fields onto the card, and interact with the table directly for customization.
Spatial Parameters
Tableau 2024.3 introduces the full Tableau experience for geospatial data with the support of Spatial Parameters. In addition to the standard parameter types (such as string and integer), authors can now choose a “Spatial” type. These parameters create rich, interactive dashboards that allow you to ask and answer questions about geospatial information. The Spatial type enables the parameter to capture spatial geometries—points, lines, and polygons representing locations, paths, and regions. With Spatial Parameters, end users can select individual points, which are then passed as input into calculations, facilitating dynamic behavior based on their selections. This functionality is similar to existing parameter behavior but is now extended to include spatial objects. Read more about spatial parameters: https://beinex.com/topics/spatial-parameters-enhancing-geospatial-analysis-and-adding-interactivity-to-your-maps/
Display Data Model for Published Data Sources
Gain a visual understanding of how tables within your data model are related to Published Data Sources. You can view the relationships between tables and fields in Tableau by simply clicking on the Data Source pane in a Tableau workbook. By enabling analysts to see and comprehend how tables in the data model are interconnected in Published Data Sources, they can confidently create accurate visualizations with a clear understanding of the data model's semantics.
Tableau Cloud App for Microsoft Teams
The new Tableau Cloud App for Microsoft Teams allows users to seamlessly integrate data-driven insights into their daily workflows, resulting in faster and more efficient decision-making. This integration enables real-time data sharing, making it easy for users to share their favorite Tableau dashboards and Pulse metrics without leaving Teams—in personal apps, messages, channels, and meetings. From there, they can analyze and share their insights in a message or channel. Pinned channel content is also available to explore in Teams meetings, providing a fully interactive experience. This promotes a more data-driven culture by ensuring everyone can collaborate effectively with access to the same data and analytics.
Image source: https://www.tableau.com/products/new-features
How Beinex Can Assist You
Beinex, a premier Tableau partner, offers sustainable analytics solutions to organizations and enhances their internal data visualization capabilities through customized training programs. Our team of Tableau-certified consultants consists of experienced Tableau business users who are passionate about the platform and committed to delivering an exceptional experience. Connect with us to embrace transformation: https://www.beinex.com/free-tableau-software/
Top Differences between Dynamic Set and Fixed Set
Dynamic Set- Set members change when the underlying data changes.
- It has a single dimension.
- Set members do not change.
- It can be single-dimensional or multidimensional.
Steps to Create a Dynamic Set
The process to create a dynamic set is as follows: In the Data pane, right-click on the sub-category dimension and choose Create > Set. (Figure 1)
Figure 1: Creating a Set
• In the Create Set dialog box, set up your set. You can configure it using the following tabs:
1. General: Use the General tab to choose one or multiple values to be considered when computing the set. Alternatively, you can choose the Use All option to consistently consider all members, even when new members are added or removed.
If you know the top-selling products beforehand, you can manually select the products as shown in Figure 2 below.
Figure 2: Creating a Set using General Tab
2. Condition: Utilize the Condition tab to establish criteria that decide which members should be incorporated into the set.
You can specify this condition and create the set if you need products with sales greater than $50,000. (Figure 3)
Figure 3: Creating a Set using Condition Tab
3. Top: Employ the Top tab to set restrictions on which members should be included in the set.
For instance, you can establish a limit based on total sales, where only the top 5 products with the highest sales are included. (Figure 4)
Figure 4: Creating a Set using Top Tab
- Once you have completed the configuration, click the "OK" button.
- The newly created set will appear at the bottom of the Data pane within the Sets section. You can identify it by the set icon, which denotes a set field.
Steps to Create a Fixed Set
The process to create a fixed set is as follows:
- In the developed visualisation, select one or more marks from the view (Figure 5).
Figure 5: Selecting the marks.
- Right-click on the selected mark and select “Create Set” (Figure 6).
Figure 6: Creating the set.
- Type a name for the developed set (Figure 7).
Figure 7: Typing the Set Name.
- When finished, select “OK”. This newly created set can be accessed from the data pane. When this set is placed in the filter, the view will be filtered to show only the relevant set values.
Top Benefits of Sets in Tableau
• Top N or Bottom N Analysis: Sets can filter the data to display only the top or bottom N values based on a specific condition. For example, you could create a set to show the top 10 products by profit or even combine sets and display the top N and bottom N products by profit in a single chart. (Figure 8)
Figure 8: Top 3 and Bottom 3 Products by Profit
• Segmentation Analysis: Sets can also segment data into groups based on a specific condition. This can be useful for analysing performance differences between different groups. For example, you could create a set to segment customers based on their geographic location.
• Excluding Data: Sets can be used to exclude specific data points from a visualisation. For example, you could create a set to exclude customers who have not purchased in the last six months.
What is Set Actions in Tableau
Set actions allow users to modify the values within a set, on selection of marks within a view. This enables your audience to engage directly with a visualisation or dashboard and control various aspects of their analysis.
To utilise set actions:
- Create sets associated with your data source.
- Build set actions using the created sets.
- Optionally, create calculated fields that incorporate the sets.
- Construct visualisations referencing the sets.
- Test and adjust the set actions for desired behaviour.
To create a set action that helps in drilling down category:
1. Create a set that selects a particular category (Figure 9 shows creating a set using the general tab selecting only furniture)
Figure 9: Creating Category Set using General Tab
2. If you are in a worksheet, go to Worksheet > Actions.
If you are in a dashboard, go to Dashboard > Actions.
3. In the Actions dialog box, click “Add Action” and choose "Change Set Values."
4. In the Add/Edit Set Action dialog box:
• Provide a descriptive name for the action.
• Choose a source sheet or data source. By default, the current sheet is selected. If you opt for a data source or dashboard, you can select specific sheets within it.
• Choose the desired method for users to execute the action:
- Hover: The action will trigger when a user hovers the mouse cursor over a mark in the view.
- Select: The action will activate when a user clicks a mark in the view.
- Menu: The action will initiate when a user right-clicks (or control-click on Mac) a selected mark in the view and then selects an option from the context menu.
• To specify the target set:
- First, choose the data source from the available options.
- Then, select the desired set from the Target Setlist.
Figure 10: Setting up set action
• Specify what happens when the action is run in the view:
- Assign values to set - Replaces all values in the set with selected values.
- Add values to set - Adds individually selected values to the set.
- Remove values from the set - Removes individually selected values from the set
• When the selection is cleared in the view:
- "Keep set values" will retain the current values in the set without any changes.
- "Add all values to set" will include all possible values in the set.
- "Remove all values from set" will remove all previously selected values from the set.
5. After configuring the desired behaviour, click "OK" to save the changes and return to the view.
6. To ensure the set action functions as intended, interact with the visualisation, and test its behaviour.
Benefits of Set Actions
- Filtering: Set actions can filter data based on user selections. For example, you could create a set step that filters the data to show only the top 10 customers in a particular region.
- Highlighting: Set actions can also highlight data based on user selections. For example, you could create a set action highlighting all the customers who have purchased in a particular month.
- Drill-downs: Set actions can create drill-downs that allow users to explore the data in greater detail. For example, you could create a set action enabling users to drill down from a high-level view of category by sales to a more detailed view of sales by sub-category. (Figure 11)

What Are Spatial Parameters?
Spatial parameters in Tableau allow you to dynamically interact with geospatial data within your visualizations. These parameters enable you to select spatial objects like points, polygons, multi-polygons, lines, or collections for calculations. Unlike traditional parameters, which work with values like text or numbers, spatial parameters offer the flexibility to work with geospatial data like coordinates and spatial shapes. You can create spatial parameters in two ways: 1. From a data source: If your data contains spatial fields (like latitude and longitude), you can load these as spatial parameters. 2. Using Well-Known Text (WKT) : This method allows you to manually input spatial data in text format to create custom spatial parameters. Spatial parameters can be used in the same way as other parameters in Tableau, including parameter controls, actions, and dynamic values. Note: Spatial parameters can only be created from spatial data fields (such as latitude and longitude). Creating spatial parameters from text string fields, like a "Country" field, is not feasible as it might be assigned as a geographic role but remains a text field.
Top Benefits of Using Spatial Parameters
Spatial parameters have offered immense possibilities for Tableau experts to analyze and visualize geospatial data. Key benefits are listed below: 1. Cross-Data Source Spatial Exploration With spatial parameters, you can explore spatial relationships between data sources that don't support joins. Unlike traditional data sources, which can be limited by join constraints, spatial parameters allow you to compare spatial regions from different datasets. This means you can dynamically analyze relationships across multiple data sources without the need for complex joins. 2. Skip Long Joins Previously, working with large spatial datasets required time-consuming spatial joins. Now, spatial parameters enable you to bypass these long joins and conduct spatial analysis much faster. You can use parameters to compare regions across multiple data sources instantly, even with vast datasets. 3. Interactive and Dynamic Analysis Spatial parameters allow users to visually interact with geospatial data in real time. Like other parameter types, you can use parameter controls to input points, lines, or polygons and adjust your analysis on the fly. This flexibility allows you to dynamically change spatial boundaries and relationships during your analysis. 4. Distance-Based Queries With spatial parameters, you can perform distance-based queries without complex calculations. For example, you can control the size of a buffer and see what lies within that buffer directly from the worksheet. This makes it easy to conduct proximity analysis without the need for complicated formulas. 5. Create Custom Regions Spatial parameters allow you to create custom regions by selecting points, lines, and polygons and combining them into a single parameter. For instance, you can create a sales region by combining multiple states into one spatial parameter. This enables you to tailor regions for specific analysis scenarios.
Spatial Calculations in Tableau 2024.3: What’s New
Tableau 2024.3 also introduces three new spatial calculations to help you evaluate spatial relationships: • SYMDIFFERENCE: Identifies areas that are unique between two regions. • INTERSECTION: Shows the overlap or intersection between two regions. • DIFFERENCE: Displays areas present in one region but not in the other. These new spatial calculations provide powerful tools to analyze and compare geospatial data.
Union Aggregation for Spatial Data
In previous versions of Tableau, the only aggregation available for spatial data was Collect, which groups spatial elements together. Union Aggregation has been introduced in Tableau 2024.3, allowing you to dissolve the boundaries between regions and providing even greater flexibility in working with spatial data.
Validating Spatial Calculations
Tableau 2024.2 introduced the Validate Calculation feature, which can help you detect and correct errors in your spatial data. This tool is handy when working with complex spatial datasets. Tableau's new Spatial Parameters and related features, such as spatial calculations and union aggregation, provide powerful capabilities for geospatial analysis. Whether comparing spatial regions, performing proximity-based queries, or creating custom areas, these features enable dynamic and flexible analysis beyond traditional methods.
How Beinex Can Assist You
Beinex, a premier Tableau partner, provides sustainable analytics solutions to organizations and helps to build superior data visual analytics capabilities internally through our bespoke training programs. Our team of Tableau-certified consultants are real-life Tableau business users passionate about Tableau and delivering a world-class experience. Connect with us for a free demo: https://www.beinex.com/free-tableau-software/