How AI Decision-Making is Improving Enterprise Outcomes
Blog
Share 
RecapAI: An AI-Powered Assistant for Priority Tracking and Follow-Through
 4 December 2025
  Team Beinex
 What is RecapAI Agent
RecapAI is an AI-powered assistant that helps professionals quickly regain context after time away from work. It analyzes meetings, deadlines, communications, and updates to identify what has changed, what requires action, and what should be prioritized next. Instead of reviewing multiple tools and threads, users receive a clear, structured overview of critical follow-ups, key discussions, and upcoming priorities.
Connect With Us for a Free Demo!
How RecapAI Supports You
While you are away, RecapAI quietly keeps your workspace running. It monitors your inbox, tracks meeting updates, notes shifting deadlines, and identifies what needs your attention. It works like a calm, thoughtful assistant who knows exactly what matters and what can wait.
Our RecapAI agent welcomes you with a brief, clear summary – no scrolling, no searching, no overwhelm. You open your workspace, and everything makes sense instantly.
Your:
- • Shifted deadlines
- • Key meeting
- • Follow-ups you need to send
- • People to catch up
- • Upcoming priorities – all sorted for you.
It feels like someone has already organised your day and highlighted only what matters. RecapAI Agent isn't just a summarizer – It understands your priorities. You return after a break and instantly know what needs your attention.
Summing Up
RecapAI goes beyond simple summarization by aligning information with the user’s responsibilities and priorities. It supports focused decision-making and quicker re-engagement. The best part is that RecapAI makes sure users return to work informed, organized, and ready to act.
Connect with us if you want to know more about RecapAI: https://beinex.com/contact-us/
Imagine this- You finally take that long, overdue vacation. No meetings. No notifications. Zero stress. You wake up slowly, enjoy long breakfasts, spend unrushed time with your family, the kind of peace you’ve been postponing for months.
For a few days, work feels distant – exactly how a break should feel. Then you return to work. And boom, everything hits at once. Meetings have piled up. Clients are waiting. Deadlines have shifted. Suddenly, the quiet vacation starts to feel like a guilt trip as the next few days disappear into catching up. You skim emails halfheartedly, jump between threads, and try to piece together what you missed. Before you even settle in, the workload pulls you right back into the rush.
This is where we all wish things worked differently, so we built a solution.
Meet RecapAI Agent, your intelligent work companion who’ll keep track of your tasks while you recharge.
Related Articles
Coming Soon: Tableau 2022.1 – What Does It Offer New
- List the unused data sources: Data sources imported in a workbook but not used are highlighted by the new feature. The developer can remove these data sources from the data source list to make the workbook faster.
- List of unused fields or data columns: Just like the data sources, workbook optimizer also highlights the data columns not used across the workbook. Removing these at the data source level can help improve the overall performance of the workbook.
- List of sheets not used in the dashboard: It is a common practise that developers tend to create sheets not used in the final dashboard. This creates unnecessary clutter and makes the dashboard slower. The workbook optimiser feature gives a list of such sheets which the user can delete to optimise the performance of the workbook further.
- Highlights lengthy calculations: The feature provides a list of calculations which are too complex and in turn reduce the performance of the dashboard. Simplifying a few of these can improve performance to a great extent.
 Ask Data Phrase Builder: This feature is available on Tableau Server and Tableau Online
Add field would look like as shown in the below screenshot:
Ask Data Phrase Builder: This feature is available on Tableau Server and Tableau Online
Add field would look like as shown in the below screenshot:
 Customize View Data: This feature is available on Tableau Server, Desktop and Tableau Online
This feature enables to reshape the tabular data behind your visualisation in the View data interface. One can create new columns, remove columns from the default view, change the order and sort the data using this feature. This reshaped data can also be exported as csv file to be shared with the team.
Change the root table: This feature is available on Tableau Server, Desktop and Tableau Online
Managing multiple data tables becomes easier and flexible with this new feature. One can swap any table to be the root table with a single click. This allows one to change the layout of the table quickly, reshape the data with a different root table and delete a specific table without deleting child nodes. For e.g., let us assume a user had to create a data source for an analysis using 3 tables namely ‘customers’, ‘orders’ and ‘returns’. The user creates the data model such that ‘customers’ is the root table followed by ‘orders’ and ‘returns’. But after performing some analysis the user realises that ‘orders’ should be the main root table. In such cases the user would have to re-create the data again from scratch but with the new ‘Swap with root table’ feature user can do the changes with a few clicks.
Parameter Enhancements in Tableau Prep
In version 2022.1 Tableau Prep is adding even more places where one can use parameters in the flow as well as user enhancements. Now, one can:
Customize View Data: This feature is available on Tableau Server, Desktop and Tableau Online
This feature enables to reshape the tabular data behind your visualisation in the View data interface. One can create new columns, remove columns from the default view, change the order and sort the data using this feature. This reshaped data can also be exported as csv file to be shared with the team.
Change the root table: This feature is available on Tableau Server, Desktop and Tableau Online
Managing multiple data tables becomes easier and flexible with this new feature. One can swap any table to be the root table with a single click. This allows one to change the layout of the table quickly, reshape the data with a different root table and delete a specific table without deleting child nodes. For e.g., let us assume a user had to create a data source for an analysis using 3 tables namely ‘customers’, ‘orders’ and ‘returns’. The user creates the data model such that ‘customers’ is the root table followed by ‘orders’ and ‘returns’. But after performing some analysis the user realises that ‘orders’ should be the main root table. In such cases the user would have to re-create the data again from scratch but with the new ‘Swap with root table’ feature user can do the changes with a few clicks.
Parameter Enhancements in Tableau Prep
In version 2022.1 Tableau Prep is adding even more places where one can use parameters in the flow as well as user enhancements. Now, one can:
- Get a list of all the parameters in one place rather than finding them in the flow. One can delete these parameters directly from the parameter window rather than to find it in the flow first.
- Include parameter names in exported output files.
- Include parameters in SQL scripts that you run before or after writing the flow output to a database. Include parameters in worksheet names when writing the flow output to Microsoft Excel.
- 1. Improvements in Esri Data Connector
- 2. Addition of new Accelerators
- 3. Added connectors to connect to more data sources

Geo Spatial Analysis Using Map Layers, Buffer Calculations, and Parameter Actions
For instance, the dashboard given below mirrors a project undertaken for a client seeking insights into the pandemic's impact on their business across specific areas. They wanted to determine the number of stores stocking their product within a defined radius, highlighting the local business impact amid the pandemic.
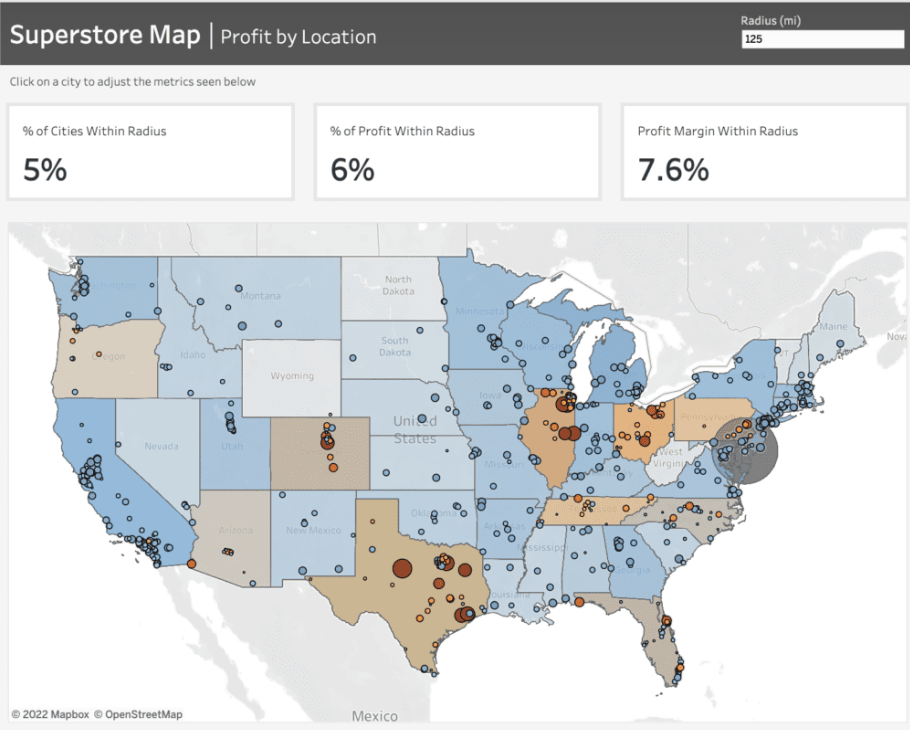 To craft the map showcased in this dashboard, we leverage Tableau's map layers feature introduced in version 2020.4. For further insights into this functionality, additional details can be found here.
Prior to initiating the map creation process, frequently refer to the Profit Margin field. Here's the calculation for this field: it computes the percentage of Sales that translates into Profit. This calculation enables us to gauge the profitability derived from our sales figures.
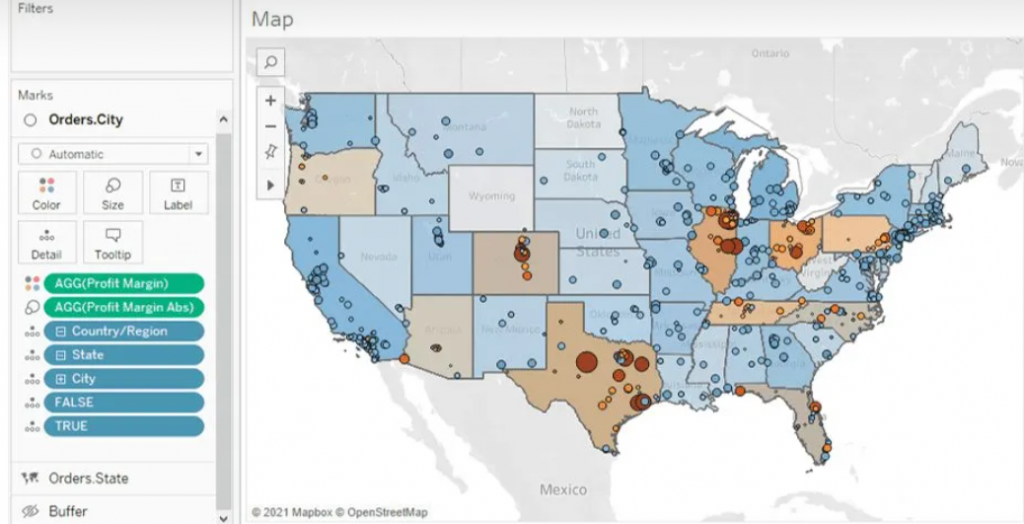
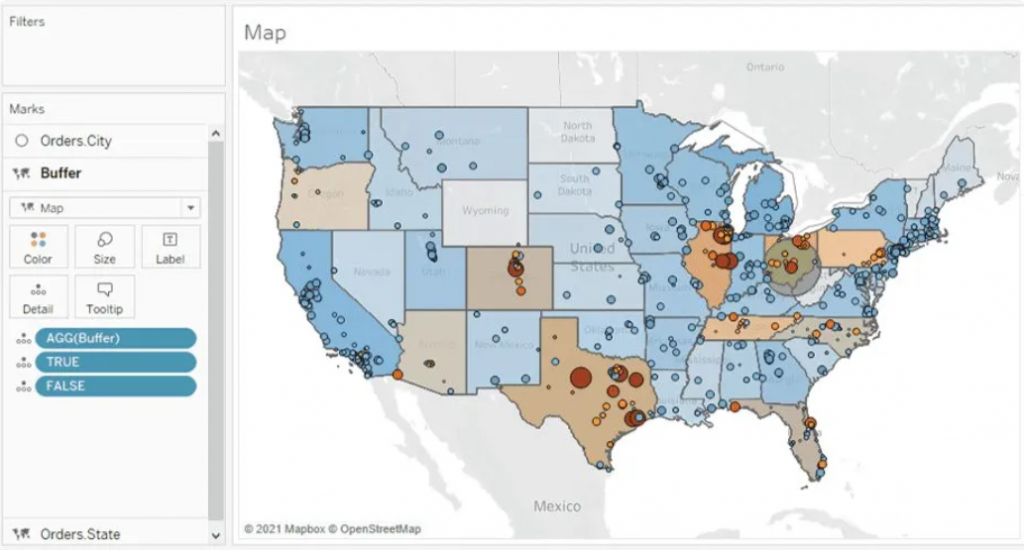
 For the States map layer, the State field is utilized and placed on the 'Detail' shelf. Each state is color-coded based on its Profit Margin.
Moving to the Cities layer, the City field is added onto the top left area labeled "Add a Marks Layer." To ensure the visibility of every city, the State level of detail is included as well. This accounts for cities existing in multiple states, displaying every city/state combination. Cities are color-coded using the Profit Margin field, with additional color based on the absolute value of the Profit Margin. This helps visualize the range and direction of profitability for each city.
Buffer Calculation
The Buffer calculation generates a radius, known as a "buffer," around a specific map point, defined within the syntax parameters. Here's the syntax breakdown for the Buffer: The initial part determines the center location, followed by the distance around the point, and finally, the chosen unit of measurement.
 To establish the desired centroid point, we employ the Makepoint function. This function simply utilizes latitude and longitude coordinates to generate a point on the map. Below is the calculation illustrating its usage.
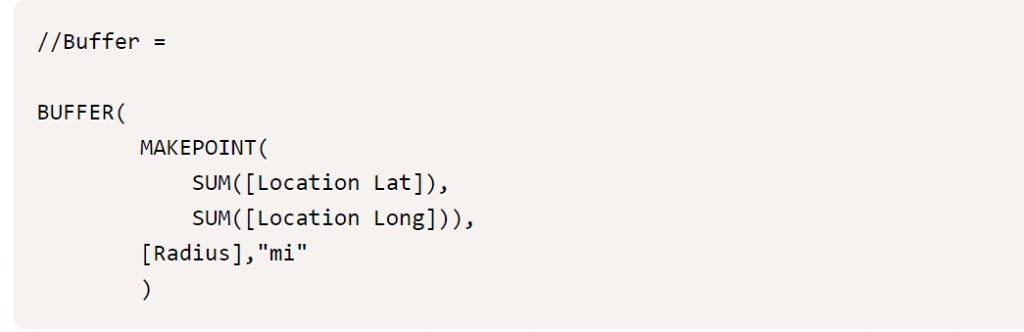
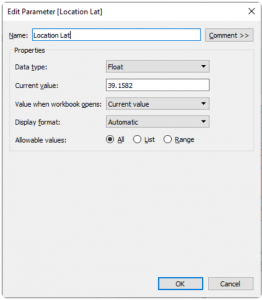
To achieve the interactivity you desire, you'll begin by creating three parameters: [Location Lat], [Location Long], and [Radius]. These parameters offer flexibility, allowing you to adjust them within the dashboard interface.
As you click on different cities, the [Location Lat] and [Location Long] fields dynamically change, altering the central point. Meanwhile, the [Radius] field, functioning as an input parameter, enables you to modify the radius distance according to your preferences. This setup grants you personalized control over these parameters directly within the dashboard.
With the creation of the final map layer field, you can now drag this field to the top left of the map and add it to the existing layers. Once done, you'll have all the map layers integrated into the map, allowing you to recreate the dashboard as depicted below. This comprehensive setup will mirror the dashboard layout and functionality.
Parameter Actions
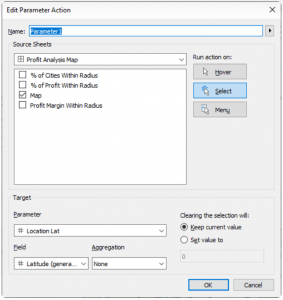
Parameter Actions are essential at this stage to ensure dynamic interaction within the map layers. By implementing parameter actions, we enable the Location Lat and Location Long fields to adjust dynamically when clicking on a city. This action directly affects the MAKEPOINT() field within the Buffer calculation, effectively altering the radius location. Below, you can observe the setup of the parameter action and how it facilitates this dynamic transformation.
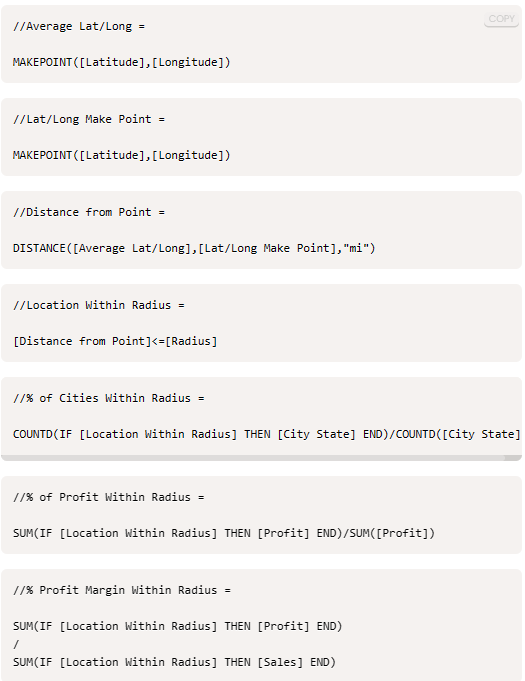
 Finally, we aim for these parameters to influence the available metrics showcased at the top of the dashboard. These metrics offer insights into the concentration of profit and profit margin within the selected radius. Below, you'll find the supporting calculations and the formulae for the metrics displayed on the dashboard. These metrics serve as indicators of profitability and profit margin concentration within the chosen radius.
Wrapping up, creating interactive data visualizations opens doors to explore and comprehend information, fostering informed decision-making and exploration of new analytical paths.
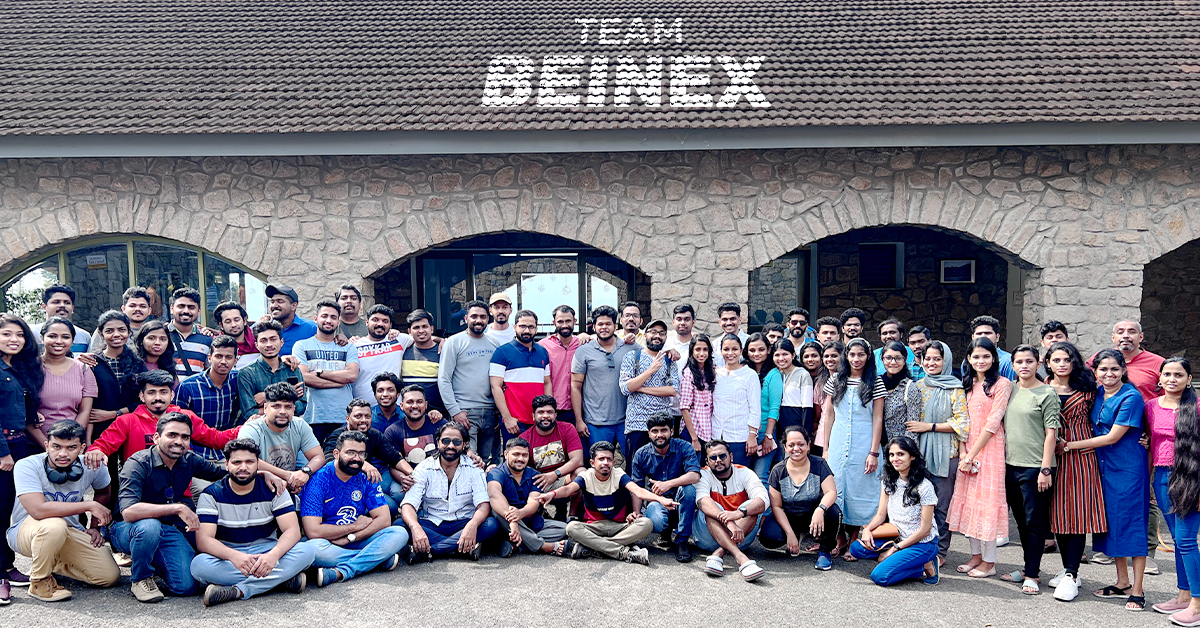
Just Go Wild: Beinex Offsite Visit to Munnar
We all boarded after breakfast from Edapally into the buses waiting as planned. Our journey to Munnar resembled the long-lost college trips, filled with songs, dances and ‘Antaksharis’. Finally, we reached our destination passing vast expanses of tea estates and dewy mountains.
Munnar is an exotic place with a breath-taking landscape and scenic spots. The chilly hill station stole our minds with its exotic flora and fauna. Our team stayed in a luxury resort: Mountain Club. The cottages chosen for us resembled the colonial architecture from the bygone era. The bedrooms were cosy, with a balcony open to the rustic surroundings.
The lunch was a luxurious affair that included starters to desserts. We used the mealtime to get to know more about each other. Then, we all attended the motivation speech by Sibu Varghese which was quite insightful, followed by an interactive session. Then, we interacted with and introduced each other. Personal interaction creates tight bonds and has an integral role in team building. We all broke the ice by sharing our stories and telling jokes. It was fun to get to know each other.
 In the evening, we had a wild-theme based gala party, and all got dressed up in sync with the theme, ‘Just Go Wild’. It was fun to watch everyone from the Manager to the employees dressed up in the same theme. We had an exhilarating DJ party manned by Darryl Gaulbert which made us all shake a leg to the tune. We danced and roared to the music. It was indeed wild!
The following day after breakfast, we met our founder Indumon Das, who had a chat with us regarding the journey of Beinex and his vision. It inspired us all to have a dream and pursue it fearlessly. Some of us accessed the infinity pool late afternoon and had great fun swimming and playing pool ball.
It was a blissful evening based on an ethnic wear theme. We competed for the best ethnic outfit of the evening. The different hues and styles made the evening stunning. Everyone flaunted the traditional wear in style. We had a musical evening with a live barbeque and a sumptuous dinner.
Finally, the day of leaving Munnar dawned; March 19. We all had breakfast in the morning and packed our backpacks. Most of us were pretty reluctant to leave Munnar as we were not ready to lose the bond we created together. Nonetheless, we vowed to stay connected. We boarded the buses around 10 AM and waved goodbye to Munnar.
When we reached Edapally in the evening, a surprise goody bag was waiting. It was an impressive and admirable gesture from our firm. Beinex has a culture of nurturing growth and spreading positivity, and employees’ comfort is the priority here.
In the evening, we had a wild-theme based gala party, and all got dressed up in sync with the theme, ‘Just Go Wild’. It was fun to watch everyone from the Manager to the employees dressed up in the same theme. We had an exhilarating DJ party manned by Darryl Gaulbert which made us all shake a leg to the tune. We danced and roared to the music. It was indeed wild!
The following day after breakfast, we met our founder Indumon Das, who had a chat with us regarding the journey of Beinex and his vision. It inspired us all to have a dream and pursue it fearlessly. Some of us accessed the infinity pool late afternoon and had great fun swimming and playing pool ball.
It was a blissful evening based on an ethnic wear theme. We competed for the best ethnic outfit of the evening. The different hues and styles made the evening stunning. Everyone flaunted the traditional wear in style. We had a musical evening with a live barbeque and a sumptuous dinner.
Finally, the day of leaving Munnar dawned; March 19. We all had breakfast in the morning and packed our backpacks. Most of us were pretty reluctant to leave Munnar as we were not ready to lose the bond we created together. Nonetheless, we vowed to stay connected. We boarded the buses around 10 AM and waved goodbye to Munnar.
When we reached Edapally in the evening, a surprise goody bag was waiting. It was an impressive and admirable gesture from our firm. Beinex has a culture of nurturing growth and spreading positivity, and employees’ comfort is the priority here.
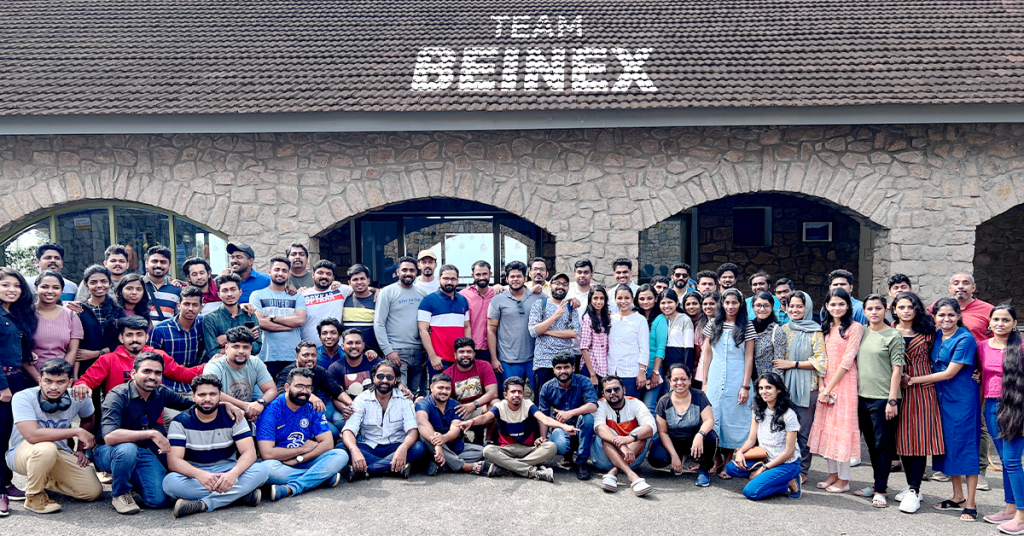 Yes, we had a fantastic time together. After this retreat, our rejuvenated and motivated minds are ready to bounce back to work with enhanced spirit. We are looking forward to more team building sessions in the future to meet each other more often.
In the evening, we had a wild-theme based gala party, and all got dressed up in sync with the theme, ‘Just Go Wild’. It was fun to watch everyone from the Manager to the employees dressed up in the same theme. We had an exhilarating DJ party manned by Darryl Gaulbert which made us all shake a leg to the tune. We danced and roared to the music. It was indeed wild!
The following day after breakfast, we met our founder Indumon Das, who had a chat with us regarding the journey of Beinex and his vision. It inspired us all to have a dream and pursue it fearlessly. Some of us accessed the infinity pool late afternoon and had great fun swimming and playing pool ball.
It was a blissful evening based on an ethnic wear theme. We competed for the best ethnic outfit of the evening. The different hues and styles made the evening stunning. Everyone flaunted the traditional wear in style. We had a musical evening with a live barbeque and a sumptuous dinner.
Finally, the day of leaving Munnar dawned; March 19. We all had breakfast in the morning and packed our backpacks. Most of us were pretty reluctant to leave Munnar as we were not ready to lose the bond we created together. Nonetheless, we vowed to stay connected. We boarded the buses around 10 AM and waved goodbye to Munnar.
When we reached Edapally in the evening, a surprise goody bag was waiting. It was an impressive and admirable gesture from our firm. Beinex has a culture of nurturing growth and spreading positivity, and employees’ comfort is the priority here.
Yes, we had a fantastic time together. After this retreat, our rejuvenated and motivated minds are ready to bounce back to work with enhanced spirit. We are looking forward to more team building sessions in the future to meet each other more often.
Best AWS Services & Practices Every Data Engineer Should Master in 2025: Everything You Need in Your AWS Toolkit
1. Start with Storage Using Amazon S3
Amazon S3 is a secure and reliable storage solution when you are dealing with massive datasets. It's highly scalable, extremely durable, and serves as a foundation for most data workflows. You can depend on it from initial data landing zones to backup archives.
2. Spin Up Power with Amazon EC2
When you need raw computing power for heavy-duty tasks, such as batch processing or running data pipelines, EC2 gives you the flexibility to choose instance types suitable for your workloads. You're in control of the compute environment, which is key for tuning performance.
3. Simplify ETL with AWS Glue
Managing extract-transform-load operations can be messy. AWS Glue resolves this with automated data discovery, code generation, and job orchestration. AWS Glue can support you if you're managing multi-source ingestion and need to clean and prepare your data for use.
4. Query at Speed with Amazon Redshift
Redshift offers the easiest and quickest way to run complex queries against large volumes of structured data. It's perfect for powering dashboards, reports, and business intelligence tools without the drag of traditional databases.
5. Tackle Big Data with Amazon EMR
If your workloads involve distributed computing using Apache Spark or Hadoop, EMR helps you deploy and manage those clusters in a fraction of the time. It is ideal for advanced data transformations and machine learning (ML) workloads, as it integrates easily with other AWS services.
6. Event-Driven Logic with AWS Lambda
Forget provisioning servers to process a few files. Lambda allows you to write lightweight, trigger-based code that responds to data events. It is an efficient serverless solution for processing files as they arrive or triggering downstream processes.
7. Streamline Real-Time Data with Amazon Kinesis
Modern data doesn't always arrive in neat batches; it streams in constantly. Kinesis helps you manage this chaos by capturing, processing, and analyzing real-time data. You can utilize it for use cases such as log monitoring, clickstream analysis, and sensor data processing.
8. Store Fast & Flexible Data with DynamoDB
DynamoDB is a fully managed, serverless database ideal for workloads where speed and uptime are paramount. It provides a NoSQL solution that works best in situations where low latency is essential, such as recommendation engines or personalized content delivery.
9. Keep Your Metadata in Check: Glue Data Catalog
The Glue Data Catalog can be considered as a metadata hub that consolidates information regarding datasets, schemas, and transformations for you. It improves discoverability and governance—two things no engineer should overlook.
10. Coordinate Workflows with AWS Step Functions
As you know, data workflows can span multiple tools, services, and dependencies. AWS Step Functions help you string those steps together into one cohesive flow, complete with retries and error handling. It's a visual way to orchestrate and manage complex processes with clarity and ease.
Best Practices for Using AWS Tools as a Data Engineer
AWS tools are powerful, but knowing what to use isn’t enough; how you use them is what drives real impact. That’s where the best practices for using AWS services come in:
• Scalability: Use services that grow with your data. Enable auto-scaling in EC2, EMR, and Lambda to handle variable workloads.
• Automation: Set up Glue jobs, Lambda triggers, and Step Functions to run tasks without manual effort.
• Security: Encrypt your data (both at rest and in transit) and adhere to least-privilege access with IAM roles.
• Cost Monitoring: Use spot instances, archive old data in S3 Glacier, and monitor costs with AWS Budgets.
• Smart Workflows: Break pipelines into smaller, reusable steps. Use Step Functions for clear orchestration.
• Track & Monitor Everything: Use CloudWatch and CloudTrail to keep an eye on performance, errors, and user actions.
• Organize Metadata: Keep your Glue Data Catalog updated and use clear naming so your data is easy to find and understand.
• Test Before You Trust: Validate your data and test your pipelines with sample loads before pushing to production.
• Document as You Go: You can easily maintain notes on your workflows, data sources, and transformations for smoother teamwork.
Wrapping Up: Why These Services Matter
Tools that enable speed, flexibility, and automation are not just desirable; they're essential. AWS offers a comprehensive toolkit that covers all stages of the data lifecycle. By staying up to date with these services, you not only improve your performance at work but also position yourself to take the lead in a data-driven, cloud-first future.
For data engineers seeking to excel in their roles, it is beneficial to become proficient in at least 10 AWS services. By serving as the foundation for scalable and effective data pipelines, these services help businesses transform unstructured data into actionable insights. Data engineers can significantly contribute to fostering innovation and informed decision-making within their companies by leveraging the potential of Amazon Web Services.
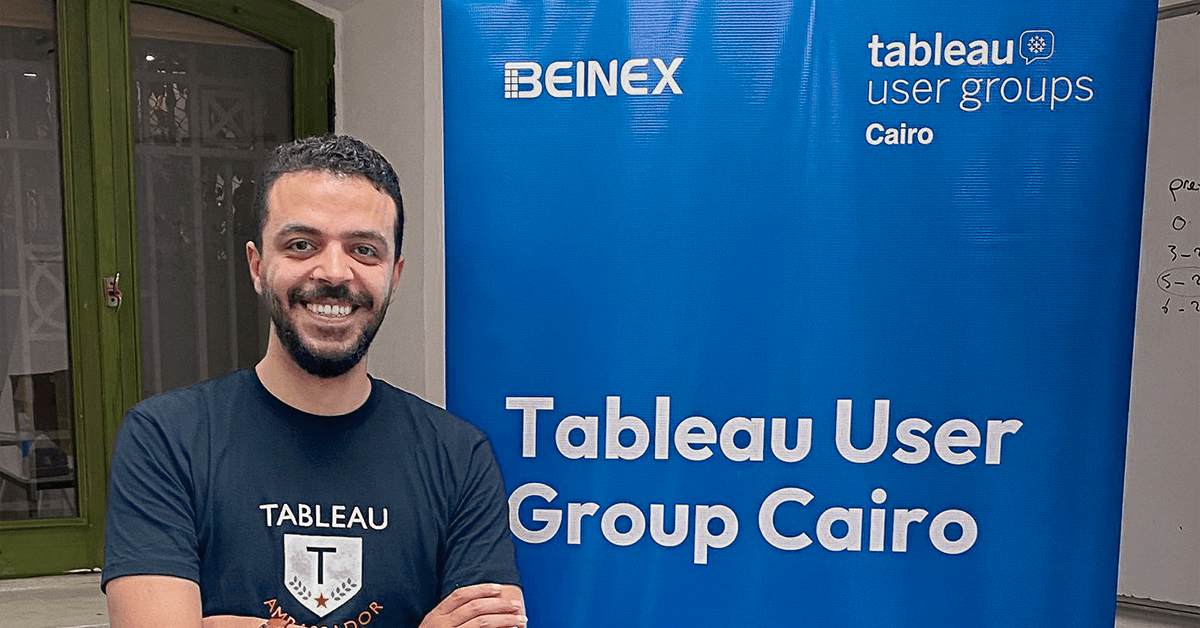
The Second TUG Meetup in Cairo: The Next Step into the Realm of Tableau Users
Looking to up your game in Business Intelligence and Data Visualization? Want to explore the endless possibilities of Tableau, showcase your work, and get valuable feedback from like-minded peers? Then TUG Meetup is the right event.
The Second TUG Cairo Meetup
Beinex has sponsored the second Tableau User Group Meetup in Cairo, and we are glad to initiate a thriving community that promotes learning, growth, and networking. TUG provides the perfect platform to connect with others, exchange ideas, and gain inspiration whether you're a beginner or an expert in Tableau. At the second TUG Meetup Cairo, the participants got the opportunity to showcase their work, receive constructive feedback, and be part of a community that shares their passion for data visualisation.
Date: March 11, 2023Venue: MQR, The GrEEK Campus Downtown, Cairo Governorate 11513
Time: 2 PM to 5 PM GST.
We had a great discussion with the following eminent speakers on the topics enlisted below:
| # | Speakers | Designation | Topics |
|---|---|---|---|
| 1 | Khaled Hoza | Data Analyst Team Lead, Fawry | Analyse the performance of your customer retention strategy |
| 2 | Martina Ghali | Senior CRM Specialist, Cartona | Overview of digital marketing and get it visualised in Tableau |
| 3 | Ahmed Ismail | NLP Engineer, Agolo | Visualise your text analytics in numerous ways |
Abdelaziz Mahjoub, Data Analytics Lead Consultant, Beinex was the leader of the TUG Cairo Meetup. He is the first and only Tableau Public Ambassador in Egypt and MENA Region, Tableau public featured author, 1x #VOTD, and Tableau certified associate with practical and academic knowledge of Essential Design Principles techniques.
Initiating a New Tribe that Helps to Grow
[sc name="quote" quote="“Since my early days in the field, I struggled to get help on how to start, a lot. I know how hard it’s to fully understand a certain technology or a tool to a mastery level without proper guidance and mentoring. Here in Cairo TUG, I try my best to help other people not to find themselves in my position back then. That’s why I started Cairo TUG, to build a strong community that everyone can rely on to get help and find the proper guidance”" author="Abdelaziz Mahjoub, Lead Consultant, Analytics at Beinex Consulting,He is the master brain behind the Cairo TUG."][/sc]