How AI Decision-Making is Improving Enterprise Outcomes
Blog
Share 
Predictive Analytics in Tableau: A Crystal Ball for Business Success
What is Predictive Analytics?
Predictive analytics is a branch of advanced analytics that uses historical data, statistical algorithms, and machine learning techniques to identify the likelihood of future outcomes based on historical data. The primary goal is to go beyond knowing what has happened to provide the best assessment of what will happen in the future.
Benefits of Predictive Analytics
- Enhanced Decision Making: Make informed decisions based on data-driven insights rather than gut feelings.
- Cost Savings: Optimize resources and reduce waste by predicting demand and managing inventory effectively.
- Risk Management: Identify potential risks and take preventive measures to mitigate them.
- Improved Customer Satisfaction: Anticipate customer needs and preferences, leading to better products and services.
Predictive Analytics Techniques
Predictive analytics techniques offer a wide range of applications powered by various types of models that generate valuable insights. To determine the best predictive analytics techniques for your organization, start with a clearly defined objective. Once you know the specific question you want to answer, you can select the most suitable model.
List of Predictive Analytics Models
- Regression Models: Used to predict continuous outcomes.
- Classification Models: These models categorize data into predefined classes.
- Clustering Models: Group similar data points together based on defined criteria.
- Time Series Models: Analyze data points collected or recorded at specific time intervals to forecast future values.
1. Regression Models in Predictive Analytics
Regression models estimate the relationship between variables, tracking how independent variables impact dependent variables to predict future outcomes. These models range from simple (one independent and one dependent variable) to multiple linear regression (multiple independent variables). Various regression techniques can be applied based on the specific use case.
By defining variable relationships, organizations can conduct scenario or 'what-if' analysis, testing how changes in independent variables affect outcomes.
Application of Regression Models
For example, a company might use a regression model to analyze how product qualities influence purchase likelihood, such as identifying a correlation between blue shirts and higher sales. These insights help refine marketing strategies and product development, optimizing future performance.
2. Classification Models in Predictive Analytics
Classification models categorize data based on historical knowledge. Using a labeled training dataset, the classification algorithm learns correlations between data and labels and then categorizes new data. Popular techniques include decision trees, random forests, and text analytics.
These models are highly adaptable and can be retrained with new data, making them useful across various industries.
Application of Classification Models
For example, banks use classification models to detect fraudulent transactions. By analyzing millions of past transactions, the algorithm identifies patterns indicative of fraud and alerts customers to suspicious activity.
3. Clustering Models in Predictive Analytics
Clustering models group data based on similar attributes. Using a data matrix that associates items with relevant features, the algorithm clusters items with shared features, uncovering hidden patterns. Organizations use clustering models to group customers for personalized targeting strategies.
Application of Clustering Models
A restaurant might cluster customers by location and mail flyers only to those within a certain driving distance of a new location.
4. Time-series Models in Predictive Analytics
Time series models analyze data points in relation to time, making time one of the most common variables in predictive analytics. These models use historical data to predict future metrics. For example, analyzing data from the past year can help forecast the upcoming weeks.
Time series analyses are versatile, used for applications like seasonality analysis (predicting how assets are affected by certain times of the year) and trend analysis (determining asset movements over time).
Application of Time-series Models
Forecasting sales for the next quarter, predicting store visitor numbers, or even determining peak flu seasons.
Predictive Analytics with Tableau
Tableau empowers users to not only visualize their data but also to gain actionable insights through advanced predictive capabilities. Whether you're looking to forecast sales, predict customer behavior, or optimize business operations, Tableau is the right choice.
3 Ways to do Predictive Analytics in Tableau
1. Forecasting in Tableau Desktop
Tableau Desktop offers robust forecasting features that allow users to make data-driven predictions effortlessly. Using exponential smoothing models, Tableau enables you to forecast future data points based on historical trends. Here’s what you can do: Let’s explore the ways to forecast data in Tableau Desktop: • Creating a Forecast: Users can add a forecast to a view by simply dragging a time dimension to the Columns shelf and a measure to the Rows shelf. By right-clicking on the view and selecting "Show Forecast," Tableau generates a forecast based on the selected model. • Customizing Forecasts: Forecast settings can be customized to adjust the prediction length, forecast model, and season length. Users can access these settings through the "Forecast Options" dialog box. • Evaluating Forecasts: Tableau provides a forecast description that includes details about the model, prediction intervals, and underlying statistics. This helps users understand the reliability and accuracy of their forecasts. • Visualizing Forecasts: Forecasts are visualized as shaded areas or lines on the chart, making it easy to compare predicted values with actual data.
2. Bringing R/Python Calculations into Tableau
Integrating R and Python into Tableau Desktop enhances its analytical capabilities, allowing users to perform complex statistical analysis and machine learning tasks. Users can create calculated fields using MODEL calculations, or by using SCRIPT functions that include R or Python scripts to perform custom calculations. These scripts can be used for various purposes, such as regression analysis, clustering, and predictive modeling. Tableau connects to R using Rserve and to Python using TabPy.
3. How to Do Predictive Analytics with Tableau Prep
Tableau Prep enhances your data preparation process by integrating with Einstein Discovery, Salesforce's AI-powered analytics tool. This integration allows you to infuse your data workflows with advanced predictive capabilities. • Einstein Discovery in Tableau Einstein Discovery, part of Salesforce's suite of AI (Artificial Intelligence) tools, is integrated into Tableau to provide advanced predictive analytics capabilities. In Tableau Prep, Einstein Discovery can be used to build and integrate predictive models directly within the data preparation workflow. This feature is available in Tableau Desktop as well. • Generate predicted values by integrating R/Python in Tableau Prep Tableau Prep allows for the integration of R and Python to perform advanced data transformations and generate predicted values.
Here's how you can do it: • Script Steps:
- Tableau Prep includes a "Script" step that lets users run R or Python scripts as part of their data flow.
- This step can be used to perform complex transformations, calculations, and predictions.
- Similar to Tableau Desktop, Tableau Prep connects to R using Rserve and to Python using TabPy.
- Users need to set up these servers and connect them to Tableau Prep to execute scripts.
- Users can import trained models from R or Python into Tableau Prep.
- The "Script" step allows these models to be applied to the data, generating predicted values as part of the data preparation process.
- Using R and Python, users can create dynamic and flexible data preparation workflows that include predictive analytics.
- This enhances the overall data preparation process by integrating advanced analytical techniques.
Real-life Scenarios/ Use cases of Predictive Analytics
Predictive analytics can be applied in numerous business scenarios to enhance decision-making, efficiency, and customer satisfaction. Here are some real-life examples:
- Customer Churn Prediction: • Scenario: A telecom company wants to reduce the number of customers leaving for competitors. • Application: By analyzing customer usage patterns, support interactions, and billing history, the company can predict which customers are at risk of churning and take proactive measures, such as targeted promotions or personalized outreach.
- Fraud Detection: • Scenario: A financial institution wants to identify fraudulent transactions. • Application: By examining transaction histories, user behavior, and other data points, predictive models can flag suspicious activities in real-time, allowing for immediate investigation and action.
- Sales Forecasting: • Scenario: A manufacturing company needs to predict future sales to plan production and manage resources. • Application: Leveraging past sales data, market trends, and economic indicators, the company can generate accurate sales forecasts to inform production schedules and supply chain management.
- Marketing Campaign Optimization: • Scenario: A marketing team wants to improve the effectiveness of their campaigns. • Application: Predictive analytics can help segment customers based on their likelihood to respond to different types of campaigns, enabling more targeted and effective marketing efforts.
- Risk Management: • Scenario: An insurance company needs to assess risk for new policy applicants. • Application: By analyzing historical claims data and applicant information, the company can predict the likelihood of future claims and set premiums accordingly.
Tableau offers a powerful platform for integrating predictive analytics into your data strategy. With its robust forecasting capabilities, seamless integration with R and Python, and advanced features in both Tableau Desktop and Tableau Prep, you can transform raw data into actionable insights. Whether you are aiming to predict future trends, optimize operations, or make data-driven decisions, Tableau equips you with the tools needed to gain the full potential of your data. To know more, connect with us: https://www.beinex.com/tableau-beinex
Predictive analytics is like having a crystal ball that uses past information to tell you what’s likely to happen in the future. Just as weather forecasts help you plan your activities by predicting whether it will be sunny or rainy, businesses use predictive analytics to plan their strategies and operations.
Many effective business courses emphasize the importance of being proactive and strategic. In today’s competitive environment, reacting to changes isn't enough. Organizations must anticipate outcomes, seize opportunities, and prevent losses. With increasing data volumes and user-friendly software, predictive analytics is now more accessible, enabling organizations to be more proactive and boost their bottom line. Predictive analytics in Tableau makes your job a lot more easier.
Related Articles

How Atlantis Dubai Standardized Interactive Data Visualization By Implementing The Tableau Server Platform On AWS That Drove Faster and Smarter Decisions Leading to 11 Increment In H
While sharing the content, permissions can be given to each user that restricts them from editing, applying different types of filters, and sharing it further. Users can create apps and add specific visuals to create live dashboards that can be accessed through smartphones and tablets. Moreover, one can collaborate with other designers and administrators to work together and create highly customized reports for a particular field.
Challenge
- The IT infrastructure of Atlantis where the Tableau Server platform was hosted was in an on-premise datacenter which was designed to be scalable and robust with multi node physical clusters including the server, storage and network components. However, most of the physical hardware was quite old and not equipped with the latest generation of physical servers.
- Frequent hardware crashes and portal downtime kept troubling the availability of the Tableau Server application. Assigning a touch hand support person to power on the hardware that was down seemed quite impossible due the restrictions during covid period. Hence, Atlantis wanted to look for another viable solution.
- Though the hardware setup at Atlantis was well equipped to meet the occasional spikes in the traffic, it was observed that over a course of 6-month time, most of the IT infra was underutilized than predicted. It was realized that spending huge amount of money on an old hardware plus software maintenance, license costs, internet bandwidth, datacenter cooling and maintenance, touch support personnel and electricity costs – were keeping the business operations challenging.
- There was an attempt by Atlantis to select a cost-effective solution that can host Tableau Server application servers, web servers and archival data. This way IT infra can be re-provisioned to host sensitive data on-premise and the rest on the cloud, thereby reducing the overall physical hardware costs spent on a yearly basis.
Why AWS
- Atlantis decided to migrate Tableau Server, database servers, and archival data to AWS.
- The Tableau Server’s AWS architecture includes Amazon Elastic Compute Cloud (Amazon EC2), that provides complete control of its computing resources, updates to tables in Amazon Relational Database Service (Amazon RDS) and AWS Elastic Load Balancer was used to distribute the traffic to the underlying EC2 instances based on the load.
Benefits
- Atlantis uses AWS services to provision infrastructure and deploy the Tableau Server platform to other departments within it. In addition, the Tableau Server resources that are no longer required to be run all the time are made to auto shutdown thus saving cost. Atlantis reported a 28% cost reduction after implementation of AWS for the Tableau Server platform.
- The implementation of Tableau Server on AWS made Atlantis confident in the security of its data, and its accreditation team is enthusiastic about the monitoring and auditing capabilities provided by AWS tools. With the implementation of IAM roles, Atlantis IT team was able to isolate systems and tightly control user accesses. These capabilities were harder to achieve within the existing infra but were available out of the box with AWS
- By adopting AWS to host the Tableau Server platform, Atlantis has been able to innovate and experiment to a degree previously impossible. For example, Atlantis compared the performance and cost-effectiveness of three different cloud solutions. Without moving to the AWS, the costs associated with running an outdated on-premise hardware would have creeped up and the alternative way of upgrading the existing on-prem infrastructure to the latest hardware models and then hosting the Tableau Server application on top of it would have taken months.

BEINEX CONSULTING WINS ALTERYX 2020 PARTNER OF YEAR AWARDS, MIDDLE EAST
Beinex Consulting has been awarded as the Alteryx 2020 Partner of the Year, Middle East at the Alteryx Partner Summit and Awards virtual event along with 15 other winners from North America, LATAM, and EMEA.
 During the Alteryx Summit, ‘Your Road to Revenue’, Alteryx celebrated the achievements and commitment of their partners to the Alteryx business and its customers. Beinex Consulting was awarded on the level of engagement in the Alteryx partner program and its efforts around driving innovation, growing revenue, and empowering Alteryx customers to solve our world’s most pressing business and societal issues in the Middle East Region.
Selected among top Middle East Alteryx partners, Beinex demonstrated excellence in delivering end-to-end analytics transformation services that revolutionised multiple industries in the Middle East.
Beinex Consulting Founder and Managing Director, Indumon Das indicates further growth for the digital transformation organisation soon: “Beinex continues to make strategic investments to enhance our association with Alteryx and clients in major Middle East markets. This award is a recognition to our continuous growth strategy and focus to be the best Middle East partner”
“Through their ongoing pledge to the Alteryx Partner Program, our partners have demonstrated their commitment to helping Alteryx customers break down barriers and deliver game-changing insights.” – Josh Lewis, VP, Global Channels, Alteryx
About Beinex Consulting
Beinex is a digital transformation organization with a broad range of analytics modernization and training services. As a pioneer in analytics and cloud transformation, Beinex’s mission is to transform the way individuals and the organizations work with the data through innovation and experience. Beinex offers a broad range of robust and scalable business intelligence and analytics services to drive effective decision-making and create business value.
During the Alteryx Summit, ‘Your Road to Revenue’, Alteryx celebrated the achievements and commitment of their partners to the Alteryx business and its customers. Beinex Consulting was awarded on the level of engagement in the Alteryx partner program and its efforts around driving innovation, growing revenue, and empowering Alteryx customers to solve our world’s most pressing business and societal issues in the Middle East Region.
Selected among top Middle East Alteryx partners, Beinex demonstrated excellence in delivering end-to-end analytics transformation services that revolutionised multiple industries in the Middle East.
Beinex Consulting Founder and Managing Director, Indumon Das indicates further growth for the digital transformation organisation soon: “Beinex continues to make strategic investments to enhance our association with Alteryx and clients in major Middle East markets. This award is a recognition to our continuous growth strategy and focus to be the best Middle East partner”
“Through their ongoing pledge to the Alteryx Partner Program, our partners have demonstrated their commitment to helping Alteryx customers break down barriers and deliver game-changing insights.” – Josh Lewis, VP, Global Channels, Alteryx
About Beinex Consulting
Beinex is a digital transformation organization with a broad range of analytics modernization and training services. As a pioneer in analytics and cloud transformation, Beinex’s mission is to transform the way individuals and the organizations work with the data through innovation and experience. Beinex offers a broad range of robust and scalable business intelligence and analytics services to drive effective decision-making and create business value.
We are thrilled to recognize Beinex Consulting for being named Alteryx Middle East Partner of the Year!https://t.co/xwmp7HbsMp#TogetherWeSolve pic.twitter.com/4zic9mdlgD
— Alteryx (@alteryx) October 1, 2020
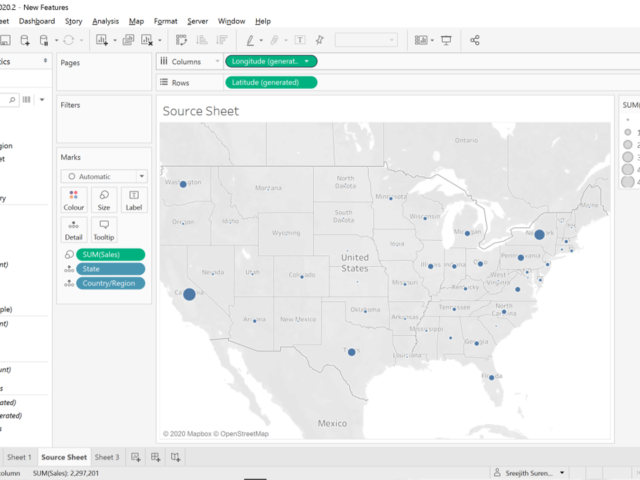
TABLEAU 2020.2 – A NEW LOOK AT VISUAL ANALYTICS
Tableau has been one of the most popular data visualization and analytics tools among the business users in the last decade. With the new features it is even simpler to see and understand data. It is evident that Tableau is made with the intention of appealing to everyone, even those with very limited technical know-how.
As always, the new version of Tableau is also packed with a punch. There are over 25 new features over the Desktop, Online, Prep and Mobile versions of the tool. Here are a few of them, that would significantly change the way you use this incredible platform.
I have been using this tool since the release on 6th May 2020. After a week of using it, I am convinced that the changes are significant and extremely useful. This new version seems a lot smoother (yes, that is the feeling you get when you use it), even compared to 2020.1, which was released last quarter. I will be focussing on some of the changes in the first blog, that would give you an overview and help you get started with this.
1. Relationships
As a trainer on Data Analytics for the last three years, I have experienced one struggle. It is about explaining the concepts of ‘Joins’ to business users. They find it confusing to know when to use ‘left join’ and when to use ‘full join’. (IT users and students had very limited issues since they have learned these concepts). Challenges like duplicate / repeating records in one of the tables (one to many mapping) is definitely hard to tackle unless you master the concepts and other techniques. However, in Tableau 2020.2, it uses ‘Relationships’ which is a much simpler and easier concept to understand, and Tableau does the heavy lifting if you are unsure
In this version, you can create logical relationship with data, visually. Relationship creates aggregations when you build the visualizations, rather than joining them in the database. This means that you can forget worrying about having to keep the data in the same level of details and the complications that would arise if it is not. For those who are familiar with the tool, the visual difference itself is quite significant. As soon as you drag and drop the second and subsequent tables, a relationship line (‘Noodle’ is what Tableau named these lines) appears and makes it easy to define the connection.
Once you add the table, a pop-up box suggests the best connection, where you can define further details (Cardinality and Referential Integrity) if needed. You can also view each of the tables independently even after defining the relationship. All you need to do, is just click on the table. You can also use the existing concepts of Union and Joins as well. Below is a simple example using Sample Superstore data.
2. Metrics
Metrics is a concept that would appeal to the higher management and executives. This is an option where you can track all metrices of your interest in one place, despite of it being included in multiple Tableau workbooks. Instead of creating a ‘Master Workbook’ with all the metrics, which involved development and maintenance effort, we can now do it with a simple click. It will add the Metrics or KPIs to the main Project folder itself. In addition, you can also see the trend of that particular metric over the period when the data refreshes.
In the example below, I have one Project in Tableau Online, which has got multiple dashboards catering to different business areas. I am adding two metrics: the number of male employees in the organization, and the YTD Sales. Since the data is not refreshed, the timeline will be empty. Just check out how easy it is to add the Metrics to monitor it continuously and effectively.
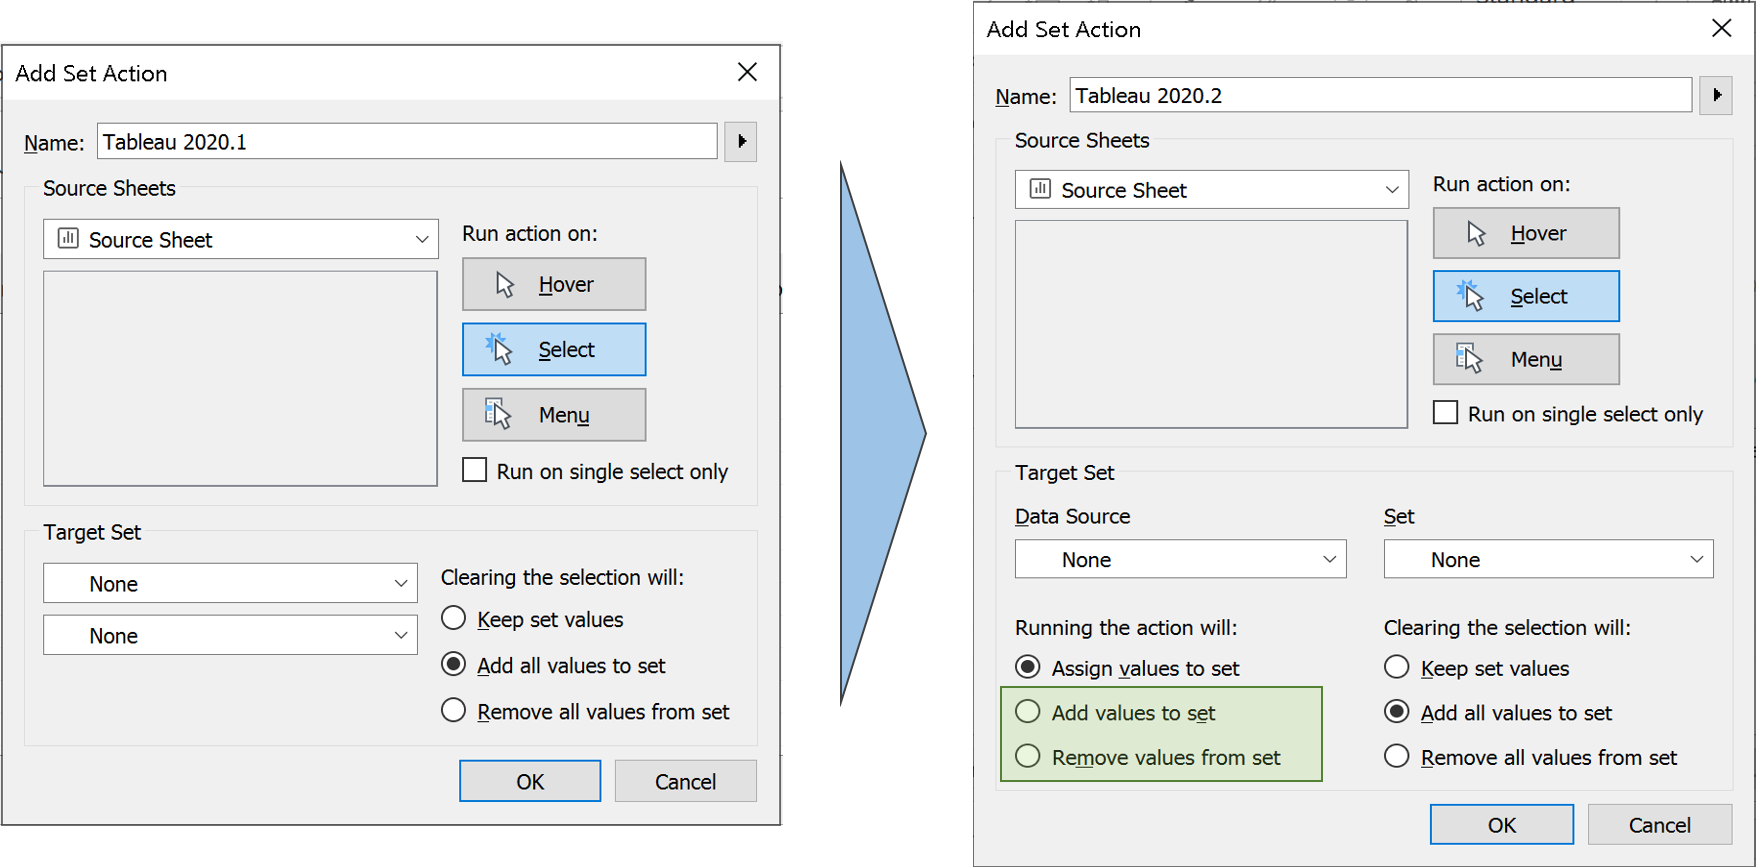
3. Set Controls and Set Action Updates
While this might be described as a new feature, it, in fact, opens a whole new set of opportunities to interact with your visualizations. If I try to describe set Controls in Tableau 2020.2, it can be simplified as an option in which we can include or exclude elements in a set in a simple drop-down (similar to ‘Filters’). The addition or deletion or new values in a set can significantly change the way we see the data.
This means that the end user can perform a variety of analysis in the front end. Check out the video below.
Set actions also has got two new selection modes as well in the new version. Tableau 2020.2. Instead of only assigning the set values, Set Action can now add or remove values incrementally, by interacting with the marks.
 Zen Masters ‘The Flerlage Twins’ have a blog that explains all the features in details about this new set action option. You can check it out.:
4. Other Changes
No Dimensions or Measures:
One of the noticeable differences compared to the previous version, is the absence of sections for Dimensions and Measures. While there is separation line, it is less distracting than the previous versions. It is not only the Dimensions and Measure that got combined, but also the section for Sets. In this version, when you add a Set it will be added as another field in the table, just like a calculated field. This also makes complete sense, since the Sets already have a separate icon to denote them, and it can be clearly understood before using it for any analysis. However, there is a separate section for Parameters.
Always on Search Bar:
Also, the Search bar is now always visible and cannot be hidden, unlike the previous version. I prefer this option since I almost always enable the search and never hides it afterwards. The Search bar sits comfortably in the space that is created when the titles for Dimensions and Measures are removed. In addition, when you type a field name after selecting any field, it automatically goes to that field despite of whether it is Measure or a Dimension. This is similar to us typing a folder or filename to find it in a Windows Folder Explorer.
No more ‘Number of Records’:
Another difference is the absence of ‘Number of Records’ field. This is now replaced with a non-editable and non-removable field: ‘Tablename (Count)’. Since the data is defined by relationship and not joined, there will be multiple such fields if you use multiple data sources. Similarly, when we choose ‘View Data’, there will be multiple tabs based on the number of data sources we use.
I have tried to show these in the image below.
Zen Masters ‘The Flerlage Twins’ have a blog that explains all the features in details about this new set action option. You can check it out.:
4. Other Changes
No Dimensions or Measures:
One of the noticeable differences compared to the previous version, is the absence of sections for Dimensions and Measures. While there is separation line, it is less distracting than the previous versions. It is not only the Dimensions and Measure that got combined, but also the section for Sets. In this version, when you add a Set it will be added as another field in the table, just like a calculated field. This also makes complete sense, since the Sets already have a separate icon to denote them, and it can be clearly understood before using it for any analysis. However, there is a separate section for Parameters.
Always on Search Bar:
Also, the Search bar is now always visible and cannot be hidden, unlike the previous version. I prefer this option since I almost always enable the search and never hides it afterwards. The Search bar sits comfortably in the space that is created when the titles for Dimensions and Measures are removed. In addition, when you type a field name after selecting any field, it automatically goes to that field despite of whether it is Measure or a Dimension. This is similar to us typing a folder or filename to find it in a Windows Folder Explorer.
No more ‘Number of Records’:
Another difference is the absence of ‘Number of Records’ field. This is now replaced with a non-editable and non-removable field: ‘Tablename (Count)’. Since the data is defined by relationship and not joined, there will be multiple such fields if you use multiple data sources. Similarly, when we choose ‘View Data’, there will be multiple tabs based on the number of data sources we use.
I have tried to show these in the image below.
 5. Explain Data and Ask Data Improvements
There are significant improvements in these features in every version and this time is no different. Even with all the AI capabilities, there would be times when we want to take control. Explain Data in the new version gives you that extra control that was missing in the earlier version. Authors can now choose which fields to be included in modelling Explain data, giving you the option to input your business logic to it. Explain data also allows you analyse more than just one outlier in the latest version. However, this option seems to be missing for relational databases.
5. Explain Data and Ask Data Improvements
There are significant improvements in these features in every version and this time is no different. Even with all the AI capabilities, there would be times when we want to take control. Explain Data in the new version gives you that extra control that was missing in the earlier version. Authors can now choose which fields to be included in modelling Explain data, giving you the option to input your business logic to it. Explain data also allows you analyse more than just one outlier in the latest version. However, this option seems to be missing for relational databases.
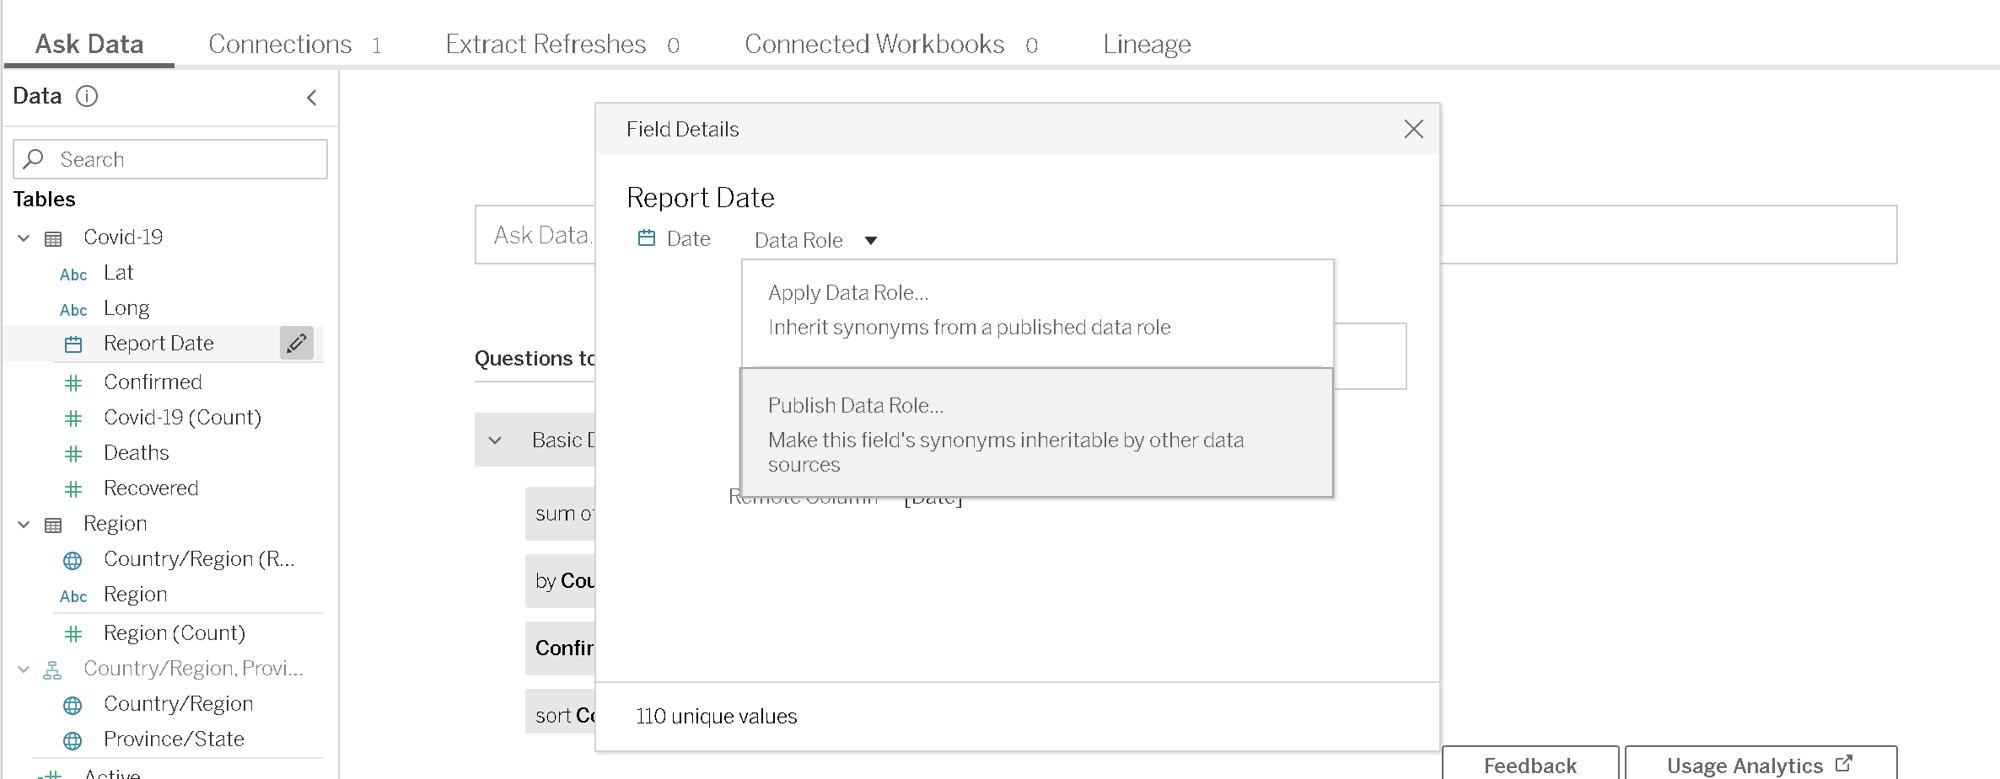
 When it comes to Ask Data, you can now provide custom suggestions based on data roles. In addition, the synonyms applied for one field can be published to use across data sources. It also supports scripted data sources in the new version and has some improvements on enterprise controls.
As mentioned at the beginning, there are several other features in Tableau 2020.2. It would be extremely difficult to include all those in just one post. There are other changes like Recommendations on Mobile, Manual sorting of Favourites, publishing directly from the browser without having to open the dashboard on Tableau Desktop etc. and so on.
I hope you got an overview to some of the new features and want to explore more. Let us know your thoughts and how these features were beneficial to you.
When it comes to Ask Data, you can now provide custom suggestions based on data roles. In addition, the synonyms applied for one field can be published to use across data sources. It also supports scripted data sources in the new version and has some improvements on enterprise controls.
As mentioned at the beginning, there are several other features in Tableau 2020.2. It would be extremely difficult to include all those in just one post. There are other changes like Recommendations on Mobile, Manual sorting of Favourites, publishing directly from the browser without having to open the dashboard on Tableau Desktop etc. and so on.
I hope you got an overview to some of the new features and want to explore more. Let us know your thoughts and how these features were beneficial to you.
 As mentioned at the beginning, there are several other features in Tableau 2020.2. It would be extremely difficult to include all those in just one post. There are other changes like Recommendations on Mobile, Manual sorting of Favourites, publishing directly from the browser without having to open the dashboard on Tableau Desktop etc. and so on.
I hope you got an overview to some of the new features and want to explore more. Let us know your thoughts and how these features were beneficial to you.
As mentioned at the beginning, there are several other features in Tableau 2020.2. It would be extremely difficult to include all those in just one post. There are other changes like Recommendations on Mobile, Manual sorting of Favourites, publishing directly from the browser without having to open the dashboard on Tableau Desktop etc. and so on.
I hope you got an overview to some of the new features and want to explore more. Let us know your thoughts and how these features were beneficial to you.
Zen Masters ‘The Flerlage Twins’ have a blog that explains all the features in details about this new set action option. You can check it out.:
4. Other Changes
No Dimensions or Measures:
One of the noticeable differences compared to the previous version, is the absence of sections for Dimensions and Measures. While there is separation line, it is less distracting than the previous versions. It is not only the Dimensions and Measure that got combined, but also the section for Sets. In this version, when you add a Set it will be added as another field in the table, just like a calculated field. This also makes complete sense, since the Sets already have a separate icon to denote them, and it can be clearly understood before using it for any analysis. However, there is a separate section for Parameters.
Always on Search Bar:
Also, the Search bar is now always visible and cannot be hidden, unlike the previous version. I prefer this option since I almost always enable the search and never hides it afterwards. The Search bar sits comfortably in the space that is created when the titles for Dimensions and Measures are removed. In addition, when you type a field name after selecting any field, it automatically goes to that field despite of whether it is Measure or a Dimension. This is similar to us typing a folder or filename to find it in a Windows Folder Explorer.
No more ‘Number of Records’:
Another difference is the absence of ‘Number of Records’ field. This is now replaced with a non-editable and non-removable field: ‘Tablename (Count)’. Since the data is defined by relationship and not joined, there will be multiple such fields if you use multiple data sources. Similarly, when we choose ‘View Data’, there will be multiple tabs based on the number of data sources we use.
I have tried to show these in the image below.
5. Explain Data and Ask Data Improvements
There are significant improvements in these features in every version and this time is no different. Even with all the AI capabilities, there would be times when we want to take control. Explain Data in the new version gives you that extra control that was missing in the earlier version. Authors can now choose which fields to be included in modelling Explain data, giving you the option to input your business logic to it. Explain data also allows you analyse more than just one outlier in the latest version. However, this option seems to be missing for relational databases.
When it comes to Ask Data, you can now provide custom suggestions based on data roles. In addition, the synonyms applied for one field can be published to use across data sources. It also supports scripted data sources in the new version and has some improvements on enterprise controls.
As mentioned at the beginning, there are several other features in Tableau 2020.2. It would be extremely difficult to include all those in just one post. There are other changes like Recommendations on Mobile, Manual sorting of Favourites, publishing directly from the browser without having to open the dashboard on Tableau Desktop etc. and so on.
I hope you got an overview to some of the new features and want to explore more. Let us know your thoughts and how these features were beneficial to you.
Google Cloud Platform: The Future of Business Transformation
Google Cloud Platform is a Google-delivered complete set of cloud computing services. The services extend to networking, storage, application development, computing, Big Data and even more, which operate on the same cloud infrastructure used internally by Google for Gmail, YouTube, and others. What makes GCP a reliable and secure cloud infrastructure to build, test and run applications is the fact that its server has not gone down in years. IT professionals, software developers and cloud administrators can access GCP services online.
Why choose the Google Cloud Platform?
In 2022, Gartner Magic Quadrant Cloud Infrastructure and Platform services named Google as a leader for the fifth time in a row. Google Cloud Platform's global network of data centres spans multiple continents, ensuring low-latency access and redundancy for your applications and data. Therefore, GCP can be the perfect choice for organisations looking for a globally renowned cloud platform known for its wide array of services and offerings. GCP's extensive catalogue of services with unique features can be attributed to the global expansion and recognition of the platform. Some of GCP's significant services include Computing, Storage, Networking, Big Data, Cloud AI, Security and Identity Management, Management Tools, and IoT.
Besides, the following aspects also add to the reasons why GCP is a viable cloud provider for businesses:
- Provides multi-level security to safeguard resources like assets and operating systems
- Has a network infrastructure comprising physical, logistical, and human-resource-related elements, like wiring, routers, switches, and firewalls
- Has proficient experts who provide support on installation and maintenance
Key Benefits of Google Cloud Platform
GCP enables customers to access computer resources located in Google's global data centres at no cost or on a pay-per-use for the services and resources used. GCP hosting plans are cost-effective compared to other platforms and offer superior features.
With features like data encryption, multi-factor authentication, and identity and access management, GCP prioritises the security of client data and applications.
Google's web-based applications provide users with complete accessibility to GCP from virtually anywhere.
GCP delivers enterprise-grade solution architectures and tech strategies to provide scalability and expedite digital transformation.
Google boasts its proprietary network infrastructure, granting users greater control over the functions of GCP. As a result, users experience seamless performance and heightened efficiency across the network.
GCP offers tools for automation, compliance and governance and a secure cloud environment to navigate challenges in cloud operations.
GCP enables organisations to harness the power of AI to automate processes, gain data-driven insights and employ machine learning for innovation.
With services like Bigtable and Cloud Storage, GCP benefits organisations in managing extensive data and facilitating real-time data processing and analysis.
Real-World Business Challenges & GCP Solutions
GCP’s suite of solutions assists organisations in tackling challenges in the dynamic business landscape effectively. Some common challenges in business and their respective GCP solutions are briefed below.
GCP equips your business with analytics tools and robust data storage to manage extensive data effectively and derive valuable insights.
With development and deployment tools like Cloud Functions and Google App Engine, GCP enables organisations to expedite development and gain a competitive edge.
GCP’s extensive global network infrastructure aids businesses by ensuring the applications reach across the world seamlessly.
With its suite of security tools for threat detection, data encryption and access and identity management, GCP safeguards data and applications with multi-level security.
In the event of unanticipated disruptions that halt business operations, GCP ensures business continuity with its backup options and disaster recovery solutions, making critical applications and data accessible.
X (formerly Twitter), eBay, PayPal, and 20th Century Fox are some of the top users who have leveraged the transformative potential of Google Cloud Platform. Being a globally recognised brand for its speed, performance, security, reliability and innovation, the Google Cloud Platform is a beacon of digital transformation for businesses navigating the challenges of the data-driven digital era. As companies venture on their journey with GCP, the prospects are endless. This partnership empowers businesses with the tools, resources, and support needed to thrive in a dynamic landscape. Whether achieving operational efficiency, reducing costs, or delivering superior customer experiences, GCP catalyses change.
What can Beinex do for you?
Beinex is now a service partner of GCP and is helping businesses advance their digital transformation endeavours by leveraging GCP’s AI capabilities, cloud infrastructure, and data analytics. Beinex offers clients expert guidance in deploying proactive solutions and using Google Cloud to make more informed data-driven decisions. This approach enables them to overcome business challenges and fosters competitiveness, efficiency, and growth. At Beinex, we deploy Google Cloud Platform as a service and the infrastructure as a service, enabling organisations to streamline access to a broader array of services and resources, resulting in cost efficiency and improved quality.
A DEEP DIVE INTO TABLEAU 2019.3
TABLEAU CATALOG
What could be better than a feature that could provide better visibility and better data management at the same time, and also ensure that the right data is always used for analysis. This is possible with the new feature -Tableau Catalog.
 This feature provides a complete picture of the data and how each data is connected.
Another use of Tableau Catalog is linear and impact analysis. This not only shows which assets will change but also who will be affected by it, which makes work easier for many and avoids wastage of time.
EXPLAIN DATA
Tableau 2019.3 is up with a new Al-driven feature called the “Explain Data”, which helps people go from the “what” of the data to the “how” of it. With explain data, we can get an explanation for each unexpected value in the data by just a single click. On selecting the desired data point, the ‘explain data’(lightbulb) icon appears.
For each value there might be a number of explanations. Each of these explanations are checked and only the most likely ones are provided as visualizations.
This feature provides a complete picture of the data and how each data is connected.
Another use of Tableau Catalog is linear and impact analysis. This not only shows which assets will change but also who will be affected by it, which makes work easier for many and avoids wastage of time.
EXPLAIN DATA
Tableau 2019.3 is up with a new Al-driven feature called the “Explain Data”, which helps people go from the “what” of the data to the “how” of it. With explain data, we can get an explanation for each unexpected value in the data by just a single click. On selecting the desired data point, the ‘explain data’(lightbulb) icon appears.
For each value there might be a number of explanations. Each of these explanations are checked and only the most likely ones are provided as visualizations.
 Now these visualizations can be used for further explorations.
TABLEAU SERVER MANAGEMENT ADD-ON
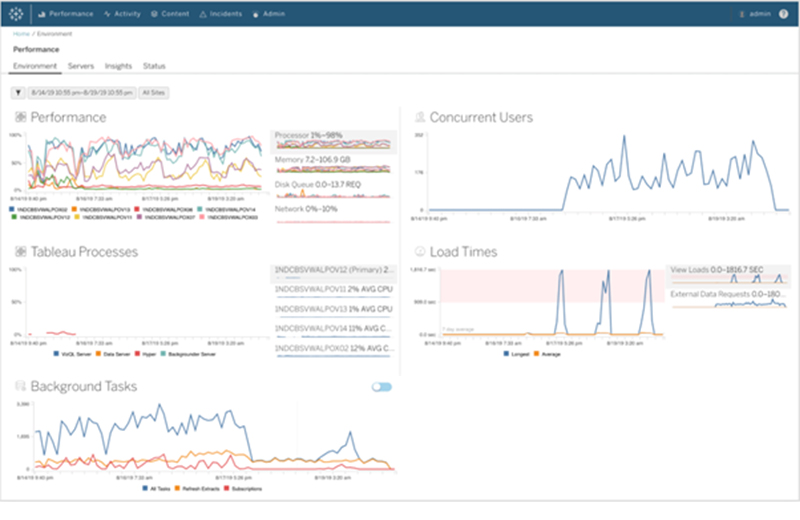
Organizations that run critical deployment of Tableau Server at a large scale, have mentioned concerns over manageability and scalability. They have been in search for tools that could organize the management process in an efficient way, which could save a lot of time. Tableau solved this problem by introducing the Tableau Server Management Add-on – a new feature designed to help organizations manage the deployment of Tableau Server. With this, they can quickly react to the changing needs of the business as well as save time by organizing the management process in the most efficient way. Tableau Server Management Add-on, which makes running the critical deployment of tableau at a large-scale server much simpler.
Now these visualizations can be used for further explorations.
TABLEAU SERVER MANAGEMENT ADD-ON
Organizations that run critical deployment of Tableau Server at a large scale, have mentioned concerns over manageability and scalability. They have been in search for tools that could organize the management process in an efficient way, which could save a lot of time. Tableau solved this problem by introducing the Tableau Server Management Add-on – a new feature designed to help organizations manage the deployment of Tableau Server. With this, they can quickly react to the changing needs of the business as well as save time by organizing the management process in the most efficient way. Tableau Server Management Add-on, which makes running the critical deployment of tableau at a large-scale server much simpler.
 The server management add-on feature can help in optimising the performance of deployment by customizing which nodes process background jobs such as extract refreshes and subscriptions and isolating these workloads, to specific nodes. This makes it easier to scale deployments to the needs of their organization.
This feature has a few tools, including two for better reliability and scalability and one for content migration, all of which helps the organizations to govern their data effectively.
If you are interested in learning more about the latest Tableau release and use cases, please contact us at training@beinex.com/ info@beinex.com and we would be happy to schedule a Tableau demo or training for you and your company.
The server management add-on feature can help in optimising the performance of deployment by customizing which nodes process background jobs such as extract refreshes and subscriptions and isolating these workloads, to specific nodes. This makes it easier to scale deployments to the needs of their organization.
This feature has a few tools, including two for better reliability and scalability and one for content migration, all of which helps the organizations to govern their data effectively.
If you are interested in learning more about the latest Tableau release and use cases, please contact us at training@beinex.com/ info@beinex.com and we would be happy to schedule a Tableau demo or training for you and your company.
This feature provides a complete picture of the data and how each data is connected.
Another use of Tableau Catalog is linear and impact analysis. This not only shows which assets will change but also who will be affected by it, which makes work easier for many and avoids wastage of time.
EXPLAIN DATA
Tableau 2019.3 is up with a new Al-driven feature called the “Explain Data”, which helps people go from the “what” of the data to the “how” of it. With explain data, we can get an explanation for each unexpected value in the data by just a single click. On selecting the desired data point, the ‘explain data’(lightbulb) icon appears.
For each value there might be a number of explanations. Each of these explanations are checked and only the most likely ones are provided as visualizations.
Now these visualizations can be used for further explorations.
TABLEAU SERVER MANAGEMENT ADD-ON
Organizations that run critical deployment of Tableau Server at a large scale, have mentioned concerns over manageability and scalability. They have been in search for tools that could organize the management process in an efficient way, which could save a lot of time. Tableau solved this problem by introducing the Tableau Server Management Add-on – a new feature designed to help organizations manage the deployment of Tableau Server. With this, they can quickly react to the changing needs of the business as well as save time by organizing the management process in the most efficient way. Tableau Server Management Add-on, which makes running the critical deployment of tableau at a large-scale server much simpler.
The server management add-on feature can help in optimising the performance of deployment by customizing which nodes process background jobs such as extract refreshes and subscriptions and isolating these workloads, to specific nodes. This makes it easier to scale deployments to the needs of their organization.
This feature has a few tools, including two for better reliability and scalability and one for content migration, all of which helps the organizations to govern their data effectively.
If you are interested in learning more about the latest Tableau release and use cases, please contact us at training@beinex.com/ info@beinex.com and we would be happy to schedule a Tableau demo or training for you and your company.
Note: The Server Management Add-on is not available for Tableau Online, as they manage everything from scaling, performance, and security on behalf of their Tableau Online customers. The Tableau Server Management Add-on can be separately purchased from the Tableau Server deployment.