How AI Decision-Making is Improving Enterprise Outcomes
Blog
Share 
بينيكس تفتتح مكتبها الرسمي في المملكة العربية السعودية
 4 January 2023
  Team Beinex
 خلال السنوات القليلة الماضية، شهد سوق المملكة العربية السعودية طفرة تحوّل هائلة في أدوات الخدمة الذاتية التي تسهم في إتاحة استخدام البيانات للجميع (Data Democratization). وتشكّل هذه الطفرة التحوّلية أهمية بالغة لمنتجات الذكاء الاصطناعي والتعلّم الآلي، التي يمكن نشرها والتوسّع فيها ضمن نطاق الشركات والمؤسسات، بالإضافة إلى غيرها من المنتجات التي يمكنها التغلب على تحديات حوكمة البيانات وإدارة الجودة.
كذلك، تعدّ هذه الطفرة التحوّلية هامة أيضًا بالنسبة إلى محفّزات التحوّل المؤسّسي التي تعتمد على نهج المنظومة في أسلوب تطبيقها، مصحوبة بخبرة مثبتة في تطوير وتنفيذ استراتيجيات البيانات الشاملة والموحّدة، وهندسة البيانات، ونماذج حوكمة البيانات.
من هذا المنطلق، حان الوقت لكي تتولّى مؤسسة تعتمد في عملها على الابتكار والخبرة، مثل "بينيكس"، زمام قيادة التحوّلات الرقمية والتحليلية في المملكة العربية السعودية.
[sc name="quote" quote='“"يطيب لشركة بينيكس ترسيخ وجود رسمي لها في سوق المملكة العربية السعودية من خلال فتح مكتبها في العاصمة السعودية - الرياض. إننا، كمؤسسة، نحرص على أن تتماشى جهودنا مع رؤية 2030 التي وضعتها المملكة، ونتوقّع تحقيق قيمة هائلة بالتزامن مع تحقيق هذه الرؤية على أرض الواقع. كما نتطلّع إلى ترك بصمة أكبر لنا في مجالات الذكاء الاصطناعي، والاستدامة، والتحوّل الرقمي، والتحليلات، فضلاً عن أي مجالات مصاحبة لها. وإذ تحرص المملكة على أن تكون في طليعة الاقتصادات التي تقوم على أساس البيانات والذكاء الاصطناعي، تلتزم بينكس بأداء دورها في دعم هذه الرؤية وتحقيقها".,”' author='"إندومون داس"، المؤسس والعضو المنتدب لشركة "بينيكس" في معرض تعليقه بمناسبة افتتاح المقرّ الجديد.'][/sc]القمّة المعنيّة باستخدام تقنيات الذكاء الاصطناعي وتحليل البيانات في المعاملات المصرفية في منطقة الشرق الأوسط
يطيب لشركة "بينيكس" المشاركة في القمّة المعنية باستخدام تقنيات الذكاء الاصطناعي وتحليل البيانات في المعاملات المصرفية في منطقة الشرق الأوسط التي تأتي هذا العام في إصدارها السادس، والمزمع عقدها في 10 مايو 2023. وتُعقد القمّة تحت شعار "تسريع الابتكار في المعاملات المصرفية باستخدام استراتيجيات الذكاء الاصطناعي وتحليل البيانات"، وتستهدف إحداث طفرة ثورية في القطاعين المالي والمصرفي في المملكة العربية السعودية بالاستعانة بتقنيات الذكاء الاصطناعي. وتتأهّب "بينيكس" للدخول والمشاركة في حلقات النقاش، والحوارات غير الرسمية، والعروض التقديمية الرئيسية، والمناقشات التباحثية، وجلسات الأسئلة والأجوبة الحوارية مع الحضور من قادة الفكر، والتي تدور حول استغلال قوة الذكاء الاصطناعي وتحليل البيانات لإنشاء منظومة مصرفية مواكبة للمستقبل.
قمّة الشرق الأوسط للذكاء الاصطناعي والتحليل المؤسسي
علاوة على ما سبق، يسر شركة "بينيكس" المشاركة في قمّة الشرق الأوسط للذكاء الاصطناعي والتحليل المؤسسي، المقرر إقامتها في 11 مايو 2023. وتتمثّل رؤية القمّة في إنشاء منصّة عالمية تضمّ كبرى الشركات الرائدة العاملة في مجال التقنيات الحديثة في المنطقة بحيث تكون حلقة وصل لتكوين العلاقات والتواصل والتعاون فيما بينها. وتُقام القمّة تحت شعار "تسريع الابتكار في المؤسسات باستخدام الاستراتيجيات التطبيقية للذكاء الاصطناعي وتحليل البيانات". هذا، وتتطلّع "بينيكس" إلى التواصل مع كبار قادة الفكر وصنّاع القرار رفيعي المستوى في مجالي الذكاء الاصطناعي وتحليل البيانات خلال القمّة #MEEAI 2023، وكذلك المشاركة في المناقشات والحوارات معهم، فضلاً عن رغبتها في مصاحبتهم خلال رحلة التحوّل.
قوة بينيكس
تعمل "بينيكس" على قيادة وتوجيه منظومة رقمية متماسكة وموحّدة، تستهدف من خلالها مساعدة عملائها على تلبية احتياجاتهم، وتقييم المنتجات والعمليات، وفهم متطلبات السوق، بالإضافة إلى تقييم مستوى الأداء العام للأعمال.
ونظراً لأن "بينيكس" شركة متعددة الجنسيات، فقد ساعدها ذلك على استكشاف الإمكانات والقدرات اللامحدودة للبيانات في مجالات الحوسبة السحابية، والتحليلات، والذكاء الاصطناعي، والتعلم الآلي، والأتمتة. كذلك، تتولّى "بينيكس" - ضمن نطاق عملها - أداء مهام هندسة الحلول وتوجيهها وقيادتها وتنفيذها فيما يتعلق بتقنيات التحليلات والذكاء الاصطناعي والتعلّم الآلي وتطبيقها في مجالات التحوّل الرقمي، والحوكمة والمخاطر والامتثال، والتدقيق وإدارة المخاطر.
نظرًا لأن إقامة الشراكات تؤدي إلى تعزيز قوّة الشركة، تحظى "بينيكس" بمجموعة من الشراكات القويّة مع عدد من الشركات التقنية الرائدة، ومختبرات الأبحاث، والجامعات في جميع أنحاء العالم؛ حيث تستفيد تلك الشركات والمؤسسات من القوّة التي تتحلى بها منظومة شركاء "بينيكس" في تعزيز قيمة رحلتها بأكملها في عالم التحليلات.
تعدّ بينيكس الرقمية، جزءًا من بينيكس القابضة، وهي عبارة عن منشأة للتحوّل الرقمي، تتمتع بمجموعة شاملة من المنتجات المستقلة بذاتها التي تركّز على معالجة فجوات معينة للأعمال التجارية، وحالات الاستخدام، والاحتياجات. كما تتضمّن مجموعة من الحلول ذات الصلة بصحّة الموظفين وسلامتهم، وإدارة منتجات الشركة، وإدارة الأداء، والتدقيق وإدارة المخاطر.
تعدّ "بينيكس" أيضًا من أشدّ المروّجين لمنتج "أوريكس"- أي (تحليلات المخاطر المتزايدة والمراجعة) - وهو عبارة عن نظام متميّز يعتمّد في عمله على منصّة واحدة لإدارة المخاطر المتكاملة، والحوكمة، والتدقيق، والامتثال، وإدارة استمرارية الأعمال، ووظائف التحليلات. كما أنّه المنتج الأوّل من نوعه الذي يعمل على تبسيط الوظائف المتعلقة بالمخاطر والتدقيق للمؤسسات حول العالم، فضلاً عن أنّه يشكّل منظومة موحّدة للتأمين الرقمي.
تحظى "بينيكس" بحضور قوي في ثلاث قارات حول العالم، تعمل من خلالها على تمكين عملائها من تحليل البيانات، والحدّ من المخاطر، وتحديد الفرص، وأتمتة العمليات.
عنوان مكتب بينكس (المملكة العربية السعودية):
3141 ، أنس بن مالك ،8292 حي الملقا
13521 ،
الرياض - المملكة العربية
السعودية
بريد إلكتروني: Info@beinex.com
خلال السنوات القليلة الماضية، شهد سوق المملكة العربية السعودية طفرة تحوّل هائلة في أدوات الخدمة الذاتية التي تسهم في إتاحة استخدام البيانات للجميع (Data Democratization). وتشكّل هذه الطفرة التحوّلية أهمية بالغة لمنتجات الذكاء الاصطناعي والتعلّم الآلي، التي يمكن نشرها والتوسّع فيها ضمن نطاق الشركات والمؤسسات، بالإضافة إلى غيرها من المنتجات التي يمكنها التغلب على تحديات حوكمة البيانات وإدارة الجودة.
Related Articles
To Faster Insights and Beyond With Tableau 2021.1
Recognized as a leader in analytics and business intelligence platform for 9 consecutive years in Gartner Magic Quadrant, Tableau has a variety of options when it comes to analytics and visualizations and according to me, it keeps getting better and better with every update. The latest 2021.1 update comes packed with some impressive features and these are some of them that caught my eye:

 Quick LODs
LOD calculations are frequently used in Tableau to perform calculations on a fixed dimension. Where previously I had to mention the dimension to be fixed and the measures to be aggregated in a calculated field, now all I must do is select the dimension and measure in the data pane and right click to create an LOD calculation. Or even better, hold “Ctrl” to drag and drop the required measure field onto the dimension to be fixed. As simple as that.
I can modify the calculation with more dimensions or change the type of aggregation later, if required.
This feature is most beneficial as it reduces the chance of errors while creating complex LOD calculations, like misplacing a bracket, or adding any unnecessary characters by mistake.
Quick LODs
LOD calculations are frequently used in Tableau to perform calculations on a fixed dimension. Where previously I had to mention the dimension to be fixed and the measures to be aggregated in a calculated field, now all I must do is select the dimension and measure in the data pane and right click to create an LOD calculation. Or even better, hold “Ctrl” to drag and drop the required measure field onto the dimension to be fixed. As simple as that.
I can modify the calculation with more dimensions or change the type of aggregation later, if required.
This feature is most beneficial as it reduces the chance of errors while creating complex LOD calculations, like misplacing a bracket, or adding any unnecessary characters by mistake.
 More Data Connections
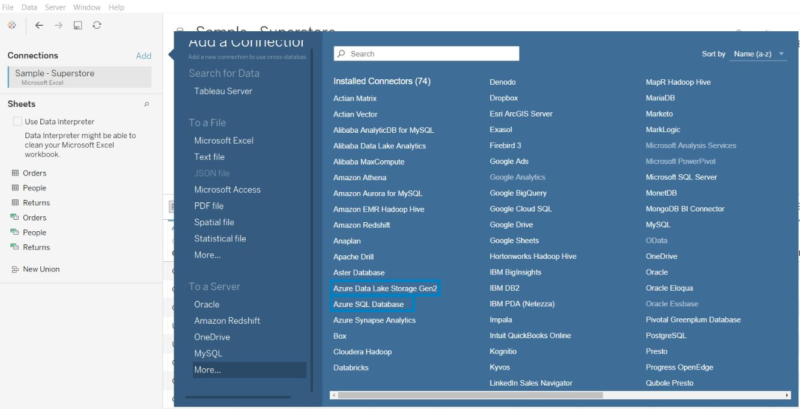
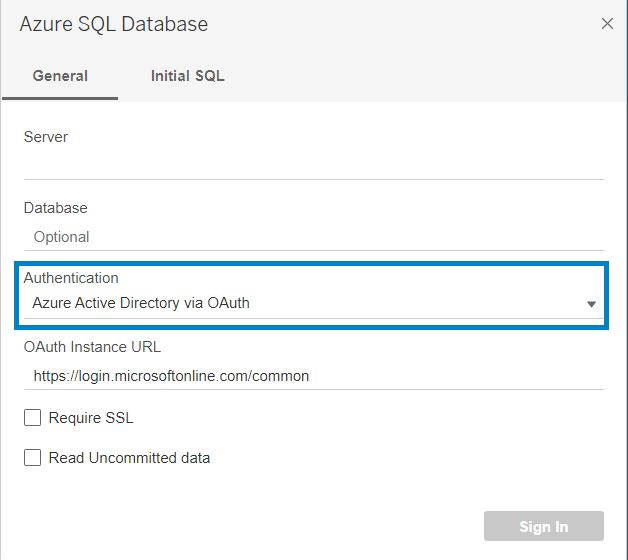
With the increase in popularity of Microsoft Azure services among users, Tableau has added multiple Azure connectors including Azure SQL Database and Azure Data Lake Gen 2 along with the existing Azure Synapse Analytics and Databricks. I can now connect to data that is stored in Azure’s SQL Database and Data Lake using the native Tableau connectors. Tableau has also introduced authentication to Azure services using the Azure Active Directory, making the connection more secure.
In addition to this, four new data connectors have been added to Tableau Online and Tableau Server. They are Amazon Athena, Apache Drill, OData and SharePoint Lists.
More Data Connections
With the increase in popularity of Microsoft Azure services among users, Tableau has added multiple Azure connectors including Azure SQL Database and Azure Data Lake Gen 2 along with the existing Azure Synapse Analytics and Databricks. I can now connect to data that is stored in Azure’s SQL Database and Data Lake using the native Tableau connectors. Tableau has also introduced authentication to Azure services using the Azure Active Directory, making the connection more secure.
In addition to this, four new data connectors have been added to Tableau Online and Tableau Server. They are Amazon Athena, Apache Drill, OData and SharePoint Lists.
 View Metrics
A difficulty that I had faced with the metric feature was that I was not able to know the other metrics that were created in the same dashboard. With this update I can see all the metrics associated with a particular dashboard and modify these metrics if required or create new ones within the metrics pane.
And previously, only if my site role were “Creator” or “Explorer”, I could see the metrics. But in this update, I can see all metrics connected to a dashboard irrespective of my site role.
View Metrics
A difficulty that I had faced with the metric feature was that I was not able to know the other metrics that were created in the same dashboard. With this update I can see all the metrics associated with a particular dashboard and modify these metrics if required or create new ones within the metrics pane.
And previously, only if my site role were “Creator” or “Explorer”, I could see the metrics. But in this update, I can see all metrics connected to a dashboard irrespective of my site role.
 Dashboard Extensions in Tableau
Earlier, to use an extension in a Tableau Dashboard, I had to drag and drop the extension object on the dashboard which would take me to its extension gallery web page and then I had to download it and then locate the downloaded extension on Tableau. Sounds tiring right?
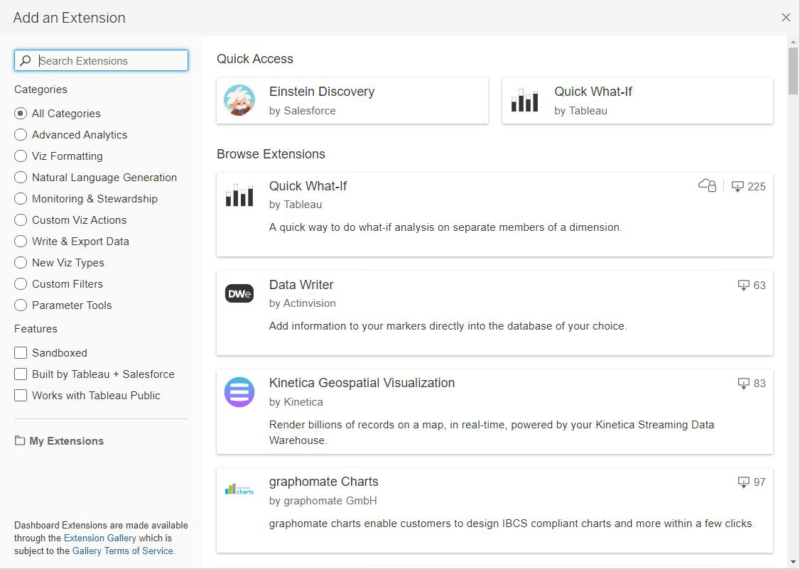
Not anymore! With this update, all I have to do is drag and drop the extension object onto the dashboard to select the required extension. I can now see all extensions and filter the list based on categories within the “Add an Extension” window in the Tableau screen.
Dashboard Extensions in Tableau
Earlier, to use an extension in a Tableau Dashboard, I had to drag and drop the extension object on the dashboard which would take me to its extension gallery web page and then I had to download it and then locate the downloaded extension on Tableau. Sounds tiring right?
Not anymore! With this update, all I have to do is drag and drop the extension object onto the dashboard to select the required extension. I can now see all extensions and filter the list based on categories within the “Add an Extension” window in the Tableau screen.
 Write to Excel in Tableau Prep
This is one feature that will prove useful to any regular Tableau Prep user. The days of exporting an output to csv and then converting it manually to an xlsx file are finally over.
Using the latest version of Tableau Prep, I can directly export the output of a workflow into an xlsx file.
Write to Excel in Tableau Prep
This is one feature that will prove useful to any regular Tableau Prep user. The days of exporting an output to csv and then converting it manually to an xlsx file are finally over.
Using the latest version of Tableau Prep, I can directly export the output of a workflow into an xlsx file.
 Device Designer for Web Authoring
Where before I could only generate device specific layouts in Tableau Desktop, now I can create custom phone or tablet views within the web itself. I no longer have to modify the device layout in Tableau Desktop and re-publish whenever a change in device layout is required.
Device Designer for Web Authoring
Where before I could only generate device specific layouts in Tableau Desktop, now I can create custom phone or tablet views within the web itself. I no longer have to modify the device layout in Tableau Desktop and re-publish whenever a change in device layout is required.
 Licensing Improvements
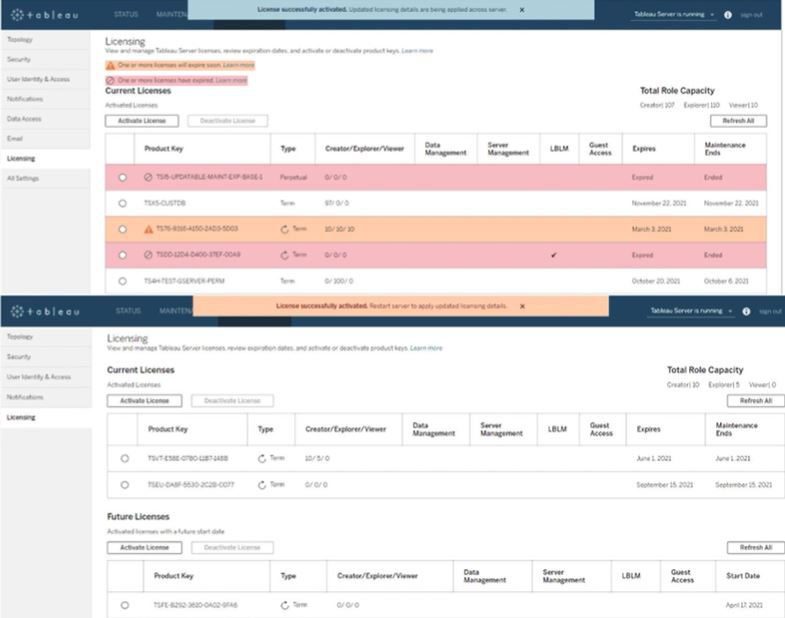
With this update, Tableau has introduced zero downtime licensing for the Tableau Server. Now for most of the tasks, whether it is the activation of a license or updating a feature that got added or applying some changes to user capacity, I no longer need to perform a server restart.
Licensing Improvements
With this update, Tableau has introduced zero downtime licensing for the Tableau Server. Now for most of the tasks, whether it is the activation of a license or updating a feature that got added or applying some changes to user capacity, I no longer need to perform a server restart.
 So, these are some features that have been helpful to me and these are just a few of the lot. To view all the new features in 2021.1, you can view it at Tableau 2021.1 New Features
In my view, Tableau has done a great job with its timely and inventive updates and seeing the rapid growth of AI and the increase of its application in numerous industries, I can predict for sure that Tableau will surprise the data science community with more innovative updates.
Images Courtesy: Tableau
So, these are some features that have been helpful to me and these are just a few of the lot. To view all the new features in 2021.1, you can view it at Tableau 2021.1 New Features
In my view, Tableau has done a great job with its timely and inventive updates and seeing the rapid growth of AI and the increase of its application in numerous industries, I can predict for sure that Tableau will surprise the data science community with more innovative updates.
Images Courtesy: Tableau
- Einstein Discovery
- Quick LODs
- More Data Connections
- View Metrics
- Dashboard Extensions in Tableau
- Write to Excel in Tableau Prep
- Device Designer for Web Authoring
- License Improvements
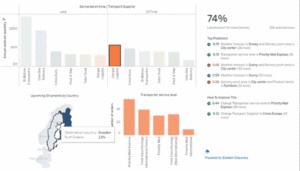
- Through Dashboard Extensions: To use “Einstein Discovery” in dashboards, I can just add an extension object on the dashboard and select Einstein Discovery. It will analyse the selected data and build predictive models. It shows me the top predictors in the view along with metrics that can be improved, and thus helping business decisions. This feature is available in Tableau Desktop, Tableau Server and Tableau Online.
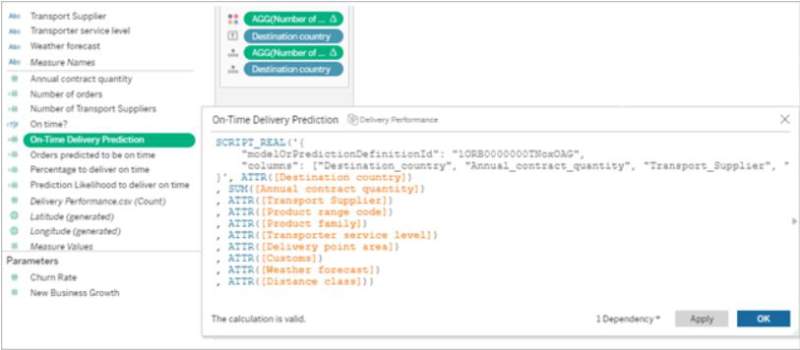
- Through Analytics Extension: With this feature, I can directly embed predictions into Tableau calculated fields. All I have to do is go to Salesforce, use Model Manager to generate a Tableau table calculation script and paste the script into the calculated field in Tableau. This script then accesses predictive models in Salesforce by passing the data required for the model. This saves my time since I don’t need to create a code for the model. This feature is only available in Tableau Desktop and Tableau Server.
- Through Tableau Prep: This feature was released in 2021.1.3 and its ingenuity is worth mentioning. With “Einstein Discovery” in Tableau Prep, I can now use predictions while preparing data. I can bulk score my data and create fields to show prediction outcomes, to show top predictors and to show recommendations for improvement of the output.
Quick LODs
LOD calculations are frequently used in Tableau to perform calculations on a fixed dimension. Where previously I had to mention the dimension to be fixed and the measures to be aggregated in a calculated field, now all I must do is select the dimension and measure in the data pane and right click to create an LOD calculation. Or even better, hold “Ctrl” to drag and drop the required measure field onto the dimension to be fixed. As simple as that.
I can modify the calculation with more dimensions or change the type of aggregation later, if required.
This feature is most beneficial as it reduces the chance of errors while creating complex LOD calculations, like misplacing a bracket, or adding any unnecessary characters by mistake.
More Data Connections
With the increase in popularity of Microsoft Azure services among users, Tableau has added multiple Azure connectors including Azure SQL Database and Azure Data Lake Gen 2 along with the existing Azure Synapse Analytics and Databricks. I can now connect to data that is stored in Azure’s SQL Database and Data Lake using the native Tableau connectors. Tableau has also introduced authentication to Azure services using the Azure Active Directory, making the connection more secure.
In addition to this, four new data connectors have been added to Tableau Online and Tableau Server. They are Amazon Athena, Apache Drill, OData and SharePoint Lists.
View Metrics
A difficulty that I had faced with the metric feature was that I was not able to know the other metrics that were created in the same dashboard. With this update I can see all the metrics associated with a particular dashboard and modify these metrics if required or create new ones within the metrics pane.
And previously, only if my site role were “Creator” or “Explorer”, I could see the metrics. But in this update, I can see all metrics connected to a dashboard irrespective of my site role.
Dashboard Extensions in Tableau
Earlier, to use an extension in a Tableau Dashboard, I had to drag and drop the extension object on the dashboard which would take me to its extension gallery web page and then I had to download it and then locate the downloaded extension on Tableau. Sounds tiring right?
Not anymore! With this update, all I have to do is drag and drop the extension object onto the dashboard to select the required extension. I can now see all extensions and filter the list based on categories within the “Add an Extension” window in the Tableau screen.
Write to Excel in Tableau Prep
This is one feature that will prove useful to any regular Tableau Prep user. The days of exporting an output to csv and then converting it manually to an xlsx file are finally over.
Using the latest version of Tableau Prep, I can directly export the output of a workflow into an xlsx file.
Device Designer for Web Authoring
Where before I could only generate device specific layouts in Tableau Desktop, now I can create custom phone or tablet views within the web itself. I no longer have to modify the device layout in Tableau Desktop and re-publish whenever a change in device layout is required.
Licensing Improvements
With this update, Tableau has introduced zero downtime licensing for the Tableau Server. Now for most of the tasks, whether it is the activation of a license or updating a feature that got added or applying some changes to user capacity, I no longer need to perform a server restart.
So, these are some features that have been helpful to me and these are just a few of the lot. To view all the new features in 2021.1, you can view it at Tableau 2021.1 New Features
In my view, Tableau has done a great job with its timely and inventive updates and seeing the rapid growth of AI and the increase of its application in numerous industries, I can predict for sure that Tableau will surprise the data science community with more innovative updates.
Images Courtesy: Tableau
Geo Spatial Analysis Using Map Layers, Buffer Calculations, and Parameter Actions
For instance, the dashboard given below mirrors a project undertaken for a client seeking insights into the pandemic's impact on their business across specific areas. They wanted to determine the number of stores stocking their product within a defined radius, highlighting the local business impact amid the pandemic.
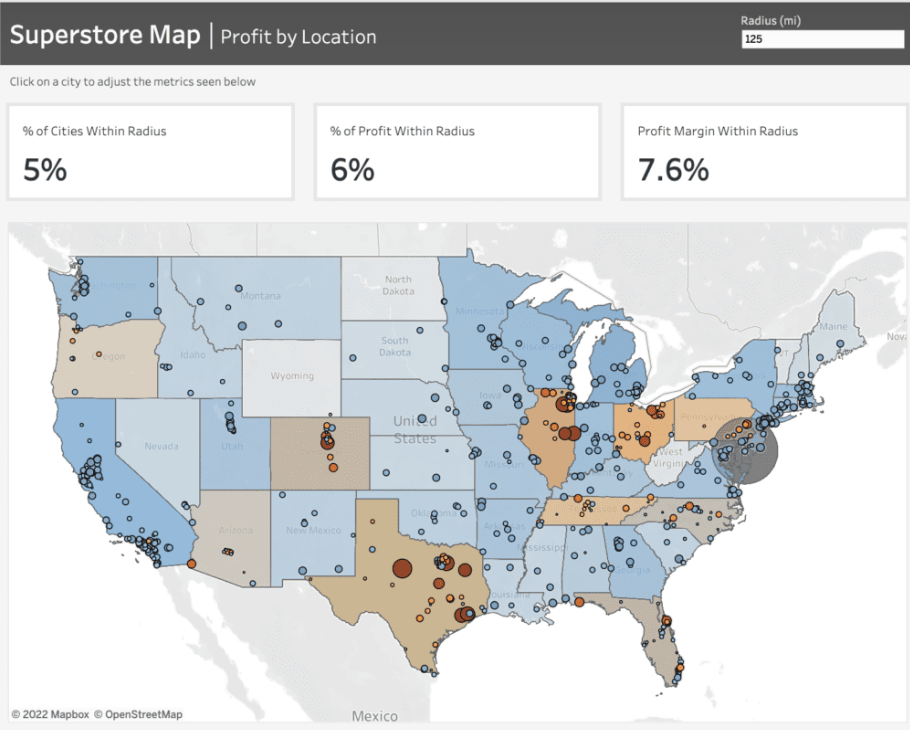 To craft the map showcased in this dashboard, we leverage Tableau's map layers feature introduced in version 2020.4. For further insights into this functionality, additional details can be found here.
Prior to initiating the map creation process, frequently refer to the Profit Margin field. Here's the calculation for this field: it computes the percentage of Sales that translates into Profit. This calculation enables us to gauge the profitability derived from our sales figures.
 For the States map layer, the State field is utilized and placed on the 'Detail' shelf. Each state is color-coded based on its Profit Margin.
Moving to the Cities layer, the City field is added onto the top left area labeled "Add a Marks Layer." To ensure the visibility of every city, the State level of detail is included as well. This accounts for cities existing in multiple states, displaying every city/state combination. Cities are color-coded using the Profit Margin field, with additional color based on the absolute value of the Profit Margin. This helps visualize the range and direction of profitability for each city.
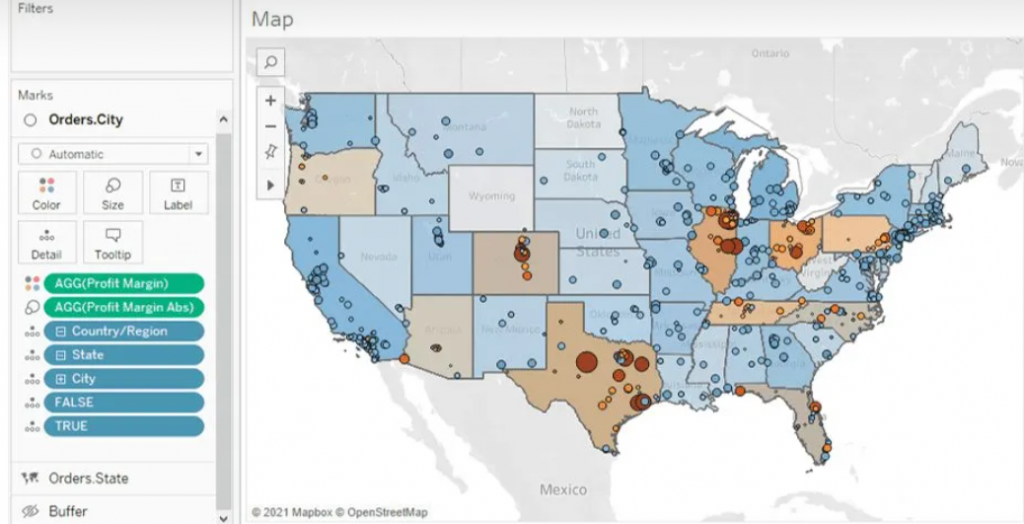
Buffer Calculation
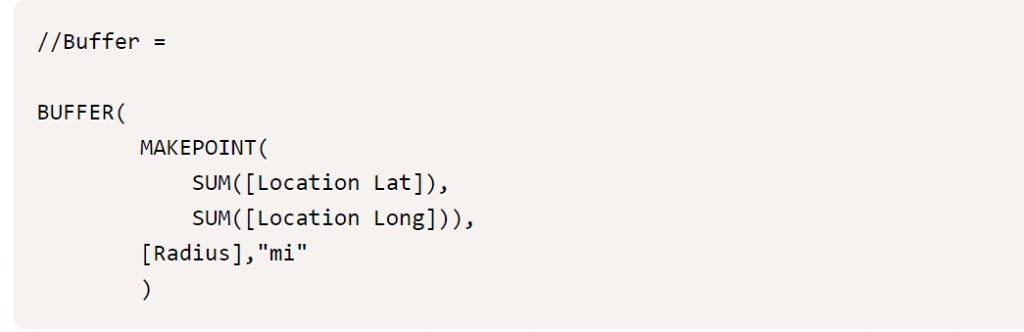
The Buffer calculation generates a radius, known as a "buffer," around a specific map point, defined within the syntax parameters. Here's the syntax breakdown for the Buffer: The initial part determines the center location, followed by the distance around the point, and finally, the chosen unit of measurement.
 To establish the desired centroid point, we employ the Makepoint function. This function simply utilizes latitude and longitude coordinates to generate a point on the map. Below is the calculation illustrating its usage.
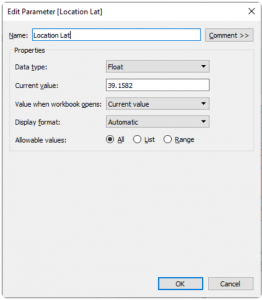
To achieve the interactivity you desire, you'll begin by creating three parameters: [Location Lat], [Location Long], and [Radius]. These parameters offer flexibility, allowing you to adjust them within the dashboard interface.
As you click on different cities, the [Location Lat] and [Location Long] fields dynamically change, altering the central point. Meanwhile, the [Radius] field, functioning as an input parameter, enables you to modify the radius distance according to your preferences. This setup grants you personalized control over these parameters directly within the dashboard.
With the creation of the final map layer field, you can now drag this field to the top left of the map and add it to the existing layers. Once done, you'll have all the map layers integrated into the map, allowing you to recreate the dashboard as depicted below. This comprehensive setup will mirror the dashboard layout and functionality.
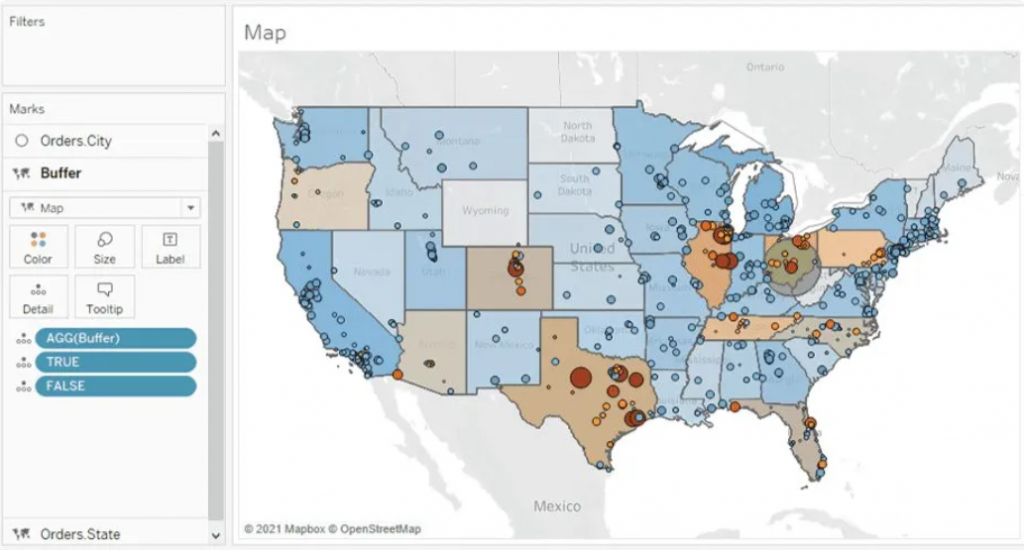
Parameter Actions
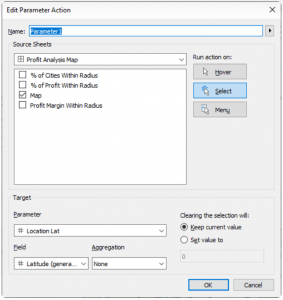
Parameter Actions are essential at this stage to ensure dynamic interaction within the map layers. By implementing parameter actions, we enable the Location Lat and Location Long fields to adjust dynamically when clicking on a city. This action directly affects the MAKEPOINT() field within the Buffer calculation, effectively altering the radius location. Below, you can observe the setup of the parameter action and how it facilitates this dynamic transformation.
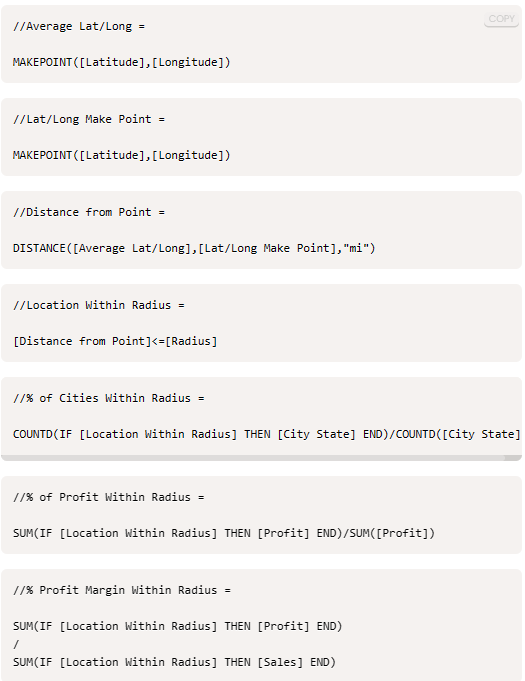
 Finally, we aim for these parameters to influence the available metrics showcased at the top of the dashboard. These metrics offer insights into the concentration of profit and profit margin within the selected radius. Below, you'll find the supporting calculations and the formulae for the metrics displayed on the dashboard. These metrics serve as indicators of profitability and profit margin concentration within the chosen radius.
Wrapping up, creating interactive data visualizations opens doors to explore and comprehend information, fostering informed decision-making and exploration of new analytical paths.

Predictive Analytics in Tableau: A Crystal Ball for Business Success
What is Predictive Analytics?
Predictive analytics is a branch of advanced analytics that uses historical data, statistical algorithms, and machine learning techniques to identify the likelihood of future outcomes based on historical data. The primary goal is to go beyond knowing what has happened to provide the best assessment of what will happen in the future.
Benefits of Predictive Analytics
- Enhanced Decision Making: Make informed decisions based on data-driven insights rather than gut feelings.
- Cost Savings: Optimize resources and reduce waste by predicting demand and managing inventory effectively.
- Risk Management: Identify potential risks and take preventive measures to mitigate them.
- Improved Customer Satisfaction: Anticipate customer needs and preferences, leading to better products and services.
Predictive Analytics Techniques
Predictive analytics techniques offer a wide range of applications powered by various types of models that generate valuable insights. To determine the best predictive analytics techniques for your organization, start with a clearly defined objective. Once you know the specific question you want to answer, you can select the most suitable model.
List of Predictive Analytics Models
- Regression Models: Used to predict continuous outcomes.
- Classification Models: These models categorize data into predefined classes.
- Clustering Models: Group similar data points together based on defined criteria.
- Time Series Models: Analyze data points collected or recorded at specific time intervals to forecast future values.
1. Regression Models in Predictive Analytics
Regression models estimate the relationship between variables, tracking how independent variables impact dependent variables to predict future outcomes. These models range from simple (one independent and one dependent variable) to multiple linear regression (multiple independent variables). Various regression techniques can be applied based on the specific use case.
By defining variable relationships, organizations can conduct scenario or 'what-if' analysis, testing how changes in independent variables affect outcomes.
Application of Regression Models
For example, a company might use a regression model to analyze how product qualities influence purchase likelihood, such as identifying a correlation between blue shirts and higher sales. These insights help refine marketing strategies and product development, optimizing future performance.
2. Classification Models in Predictive Analytics
Classification models categorize data based on historical knowledge. Using a labeled training dataset, the classification algorithm learns correlations between data and labels and then categorizes new data. Popular techniques include decision trees, random forests, and text analytics.
These models are highly adaptable and can be retrained with new data, making them useful across various industries.
Application of Classification Models
For example, banks use classification models to detect fraudulent transactions. By analyzing millions of past transactions, the algorithm identifies patterns indicative of fraud and alerts customers to suspicious activity.
3. Clustering Models in Predictive Analytics
Clustering models group data based on similar attributes. Using a data matrix that associates items with relevant features, the algorithm clusters items with shared features, uncovering hidden patterns. Organizations use clustering models to group customers for personalized targeting strategies.
Application of Clustering Models
A restaurant might cluster customers by location and mail flyers only to those within a certain driving distance of a new location.
4. Time-series Models in Predictive Analytics
Time series models analyze data points in relation to time, making time one of the most common variables in predictive analytics. These models use historical data to predict future metrics. For example, analyzing data from the past year can help forecast the upcoming weeks.
Time series analyses are versatile, used for applications like seasonality analysis (predicting how assets are affected by certain times of the year) and trend analysis (determining asset movements over time).
Application of Time-series Models
Forecasting sales for the next quarter, predicting store visitor numbers, or even determining peak flu seasons.
Predictive Analytics with Tableau
Tableau empowers users to not only visualize their data but also to gain actionable insights through advanced predictive capabilities. Whether you're looking to forecast sales, predict customer behavior, or optimize business operations, Tableau is the right choice.
3 Ways to do Predictive Analytics in Tableau
1. Forecasting in Tableau Desktop
Tableau Desktop offers robust forecasting features that allow users to make data-driven predictions effortlessly. Using exponential smoothing models, Tableau enables you to forecast future data points based on historical trends. Here’s what you can do: Let’s explore the ways to forecast data in Tableau Desktop: • Creating a Forecast: Users can add a forecast to a view by simply dragging a time dimension to the Columns shelf and a measure to the Rows shelf. By right-clicking on the view and selecting "Show Forecast," Tableau generates a forecast based on the selected model. • Customizing Forecasts: Forecast settings can be customized to adjust the prediction length, forecast model, and season length. Users can access these settings through the "Forecast Options" dialog box. • Evaluating Forecasts: Tableau provides a forecast description that includes details about the model, prediction intervals, and underlying statistics. This helps users understand the reliability and accuracy of their forecasts. • Visualizing Forecasts: Forecasts are visualized as shaded areas or lines on the chart, making it easy to compare predicted values with actual data.
2. Bringing R/Python Calculations into Tableau
Integrating R and Python into Tableau Desktop enhances its analytical capabilities, allowing users to perform complex statistical analysis and machine learning tasks. Users can create calculated fields using MODEL calculations, or by using SCRIPT functions that include R or Python scripts to perform custom calculations. These scripts can be used for various purposes, such as regression analysis, clustering, and predictive modeling. Tableau connects to R using Rserve and to Python using TabPy.
3. How to Do Predictive Analytics with Tableau Prep
Tableau Prep enhances your data preparation process by integrating with Einstein Discovery, Salesforce's AI-powered analytics tool. This integration allows you to infuse your data workflows with advanced predictive capabilities. • Einstein Discovery in Tableau Einstein Discovery, part of Salesforce's suite of AI (Artificial Intelligence) tools, is integrated into Tableau to provide advanced predictive analytics capabilities. In Tableau Prep, Einstein Discovery can be used to build and integrate predictive models directly within the data preparation workflow. This feature is available in Tableau Desktop as well. • Generate predicted values by integrating R/Python in Tableau Prep Tableau Prep allows for the integration of R and Python to perform advanced data transformations and generate predicted values.
Here's how you can do it: • Script Steps:
- Tableau Prep includes a "Script" step that lets users run R or Python scripts as part of their data flow.
- This step can be used to perform complex transformations, calculations, and predictions.
- Similar to Tableau Desktop, Tableau Prep connects to R using Rserve and to Python using TabPy.
- Users need to set up these servers and connect them to Tableau Prep to execute scripts.
- Users can import trained models from R or Python into Tableau Prep.
- The "Script" step allows these models to be applied to the data, generating predicted values as part of the data preparation process.
- Using R and Python, users can create dynamic and flexible data preparation workflows that include predictive analytics.
- This enhances the overall data preparation process by integrating advanced analytical techniques.
Real-life Scenarios/ Use cases of Predictive Analytics
Predictive analytics can be applied in numerous business scenarios to enhance decision-making, efficiency, and customer satisfaction. Here are some real-life examples:
- Customer Churn Prediction: • Scenario: A telecom company wants to reduce the number of customers leaving for competitors. • Application: By analyzing customer usage patterns, support interactions, and billing history, the company can predict which customers are at risk of churning and take proactive measures, such as targeted promotions or personalized outreach.
- Fraud Detection: • Scenario: A financial institution wants to identify fraudulent transactions. • Application: By examining transaction histories, user behavior, and other data points, predictive models can flag suspicious activities in real-time, allowing for immediate investigation and action.
- Sales Forecasting: • Scenario: A manufacturing company needs to predict future sales to plan production and manage resources. • Application: Leveraging past sales data, market trends, and economic indicators, the company can generate accurate sales forecasts to inform production schedules and supply chain management.
- Marketing Campaign Optimization: • Scenario: A marketing team wants to improve the effectiveness of their campaigns. • Application: Predictive analytics can help segment customers based on their likelihood to respond to different types of campaigns, enabling more targeted and effective marketing efforts.
- Risk Management: • Scenario: An insurance company needs to assess risk for new policy applicants. • Application: By analyzing historical claims data and applicant information, the company can predict the likelihood of future claims and set premiums accordingly.
Tableau offers a powerful platform for integrating predictive analytics into your data strategy. With its robust forecasting capabilities, seamless integration with R and Python, and advanced features in both Tableau Desktop and Tableau Prep, you can transform raw data into actionable insights. Whether you are aiming to predict future trends, optimize operations, or make data-driven decisions, Tableau equips you with the tools needed to gain the full potential of your data. To know more, connect with us: https://www.beinex.com/tableau-beinex

Google Cloud Platform: The Future of Business Transformation
Google Cloud Platform is a Google-delivered complete set of cloud computing services. The services extend to networking, storage, application development, computing, Big Data and even more, which operate on the same cloud infrastructure used internally by Google for Gmail, YouTube, and others. What makes GCP a reliable and secure cloud infrastructure to build, test and run applications is the fact that its server has not gone down in years. IT professionals, software developers and cloud administrators can access GCP services online.
Why choose the Google Cloud Platform?
In 2022, Gartner Magic Quadrant Cloud Infrastructure and Platform services named Google as a leader for the fifth time in a row. Google Cloud Platform's global network of data centres spans multiple continents, ensuring low-latency access and redundancy for your applications and data. Therefore, GCP can be the perfect choice for organisations looking for a globally renowned cloud platform known for its wide array of services and offerings. GCP's extensive catalogue of services with unique features can be attributed to the global expansion and recognition of the platform. Some of GCP's significant services include Computing, Storage, Networking, Big Data, Cloud AI, Security and Identity Management, Management Tools, and IoT.
Besides, the following aspects also add to the reasons why GCP is a viable cloud provider for businesses:
- Provides multi-level security to safeguard resources like assets and operating systems
- Has a network infrastructure comprising physical, logistical, and human-resource-related elements, like wiring, routers, switches, and firewalls
- Has proficient experts who provide support on installation and maintenance
Key Benefits of Google Cloud Platform
GCP enables customers to access computer resources located in Google's global data centres at no cost or on a pay-per-use for the services and resources used. GCP hosting plans are cost-effective compared to other platforms and offer superior features.
With features like data encryption, multi-factor authentication, and identity and access management, GCP prioritises the security of client data and applications.
Google's web-based applications provide users with complete accessibility to GCP from virtually anywhere.
GCP delivers enterprise-grade solution architectures and tech strategies to provide scalability and expedite digital transformation.
Google boasts its proprietary network infrastructure, granting users greater control over the functions of GCP. As a result, users experience seamless performance and heightened efficiency across the network.
GCP offers tools for automation, compliance and governance and a secure cloud environment to navigate challenges in cloud operations.
GCP enables organisations to harness the power of AI to automate processes, gain data-driven insights and employ machine learning for innovation.
With services like Bigtable and Cloud Storage, GCP benefits organisations in managing extensive data and facilitating real-time data processing and analysis.
Real-World Business Challenges & GCP Solutions
GCP’s suite of solutions assists organisations in tackling challenges in the dynamic business landscape effectively. Some common challenges in business and their respective GCP solutions are briefed below.
GCP equips your business with analytics tools and robust data storage to manage extensive data effectively and derive valuable insights.
With development and deployment tools like Cloud Functions and Google App Engine, GCP enables organisations to expedite development and gain a competitive edge.
GCP’s extensive global network infrastructure aids businesses by ensuring the applications reach across the world seamlessly.
With its suite of security tools for threat detection, data encryption and access and identity management, GCP safeguards data and applications with multi-level security.
In the event of unanticipated disruptions that halt business operations, GCP ensures business continuity with its backup options and disaster recovery solutions, making critical applications and data accessible.
X (formerly Twitter), eBay, PayPal, and 20th Century Fox are some of the top users who have leveraged the transformative potential of Google Cloud Platform. Being a globally recognised brand for its speed, performance, security, reliability and innovation, the Google Cloud Platform is a beacon of digital transformation for businesses navigating the challenges of the data-driven digital era. As companies venture on their journey with GCP, the prospects are endless. This partnership empowers businesses with the tools, resources, and support needed to thrive in a dynamic landscape. Whether achieving operational efficiency, reducing costs, or delivering superior customer experiences, GCP catalyses change.
What can Beinex do for you?
Beinex is now a service partner of GCP and is helping businesses advance their digital transformation endeavours by leveraging GCP’s AI capabilities, cloud infrastructure, and data analytics. Beinex offers clients expert guidance in deploying proactive solutions and using Google Cloud to make more informed data-driven decisions. This approach enables them to overcome business challenges and fosters competitiveness, efficiency, and growth. At Beinex, we deploy Google Cloud Platform as a service and the infrastructure as a service, enabling organisations to streamline access to a broader array of services and resources, resulting in cost efficiency and improved quality.

Tackling the Bias in Artificial Intelligence: Four Measures to Adopt
“AI bias” has been a trending hot subject of research and concern for a while. Recently ChatGPT, the latest language learning model released by OpenAI, has become a viral sensation. However, like many AI models before it, bias can be found in its output. AI bias is a phrase used to characterise circumstances in which ML-based data analytics algorithms exhibit bias towards specific categories of individuals. These biases are typically manifestations of pervasive societal biases about race, gender, biological sex, age, and culture.
In AI, there are two types of bias. The first is algorithmic AI bias, often known as "data bias," in which algorithms are trained with biased data. The other type of AI prejudice is societal AI bias. This is where our societal beliefs and conventions cause us to have blind spots or particular expectations in our thinking. Societal bias impacts algorithmic AI bias, but as the latter grows, we see things come full circle.
Some concerns should be addressed and resolved on a worldwide scale and other issues should be addressed locally. Every principle and standard, governing body, and people voting on things and algorithms should be verified from time to time. Making a more diverse data collection will not fix the problem. But that is just one factor.
In short, the fact is that an impartial human mind, as well as an AI system, will never be realised. After all, people are the ones who generate the skewed data, and humans and human-made algorithms are the ones who evaluate the data to find and rectify biases. However, we can overcome AI bias by validating data and algorithms and applying best practices to collect data, use data, and construct AI algorithms.
In AI, there are two types of bias. The first is algorithmic AI bias, often known as "data bias," in which algorithms are trained with biased data. The other type of AI prejudice is societal AI bias. This is where our societal beliefs and conventions cause us to have blind spots or particular expectations in our thinking. Societal bias impacts algorithmic AI bias, but as the latter grows, we see things come full circle.
What can We Do to Address AI Biases?
Here are some of the remedies:Algorithm Testing in a Real-World Situation
For example, take the case of job seekers. If the data used to train your machine learning system comes from a select group of job searchers, your AI-powered solution may be untrustworthy. While this may not be a problem if you apply AI to similar candidates, it becomes a problem when you apply it to a new group of candidates that aren't represented in your data collection. In this case, you simply ask the algorithm to apply the prejudices it learnt from the first candidates to a group of people where the assumptions may be inaccurate. To avoid this, as well as to discover and resolve these flaws, you should test the algorithm like how you would use it in the real world.Considering the So- called Counterfactual Fairness
The meaning of "fairness" and how it is calculated are up for debate. It may also change owing to external factors, implying that the AI must account for these changes as well. Researchers have also worked on a variety of approaches to ensure AI systems can meet them, such as pre-processing data, altering the system's choices after the fact, and including fairness definitions in the training process itself. A potential solution is "counterfactual fairness," which ensures that a model's choices are the same in a counterfactual world where sensitive attributes like ethnicity, gender, or sexual orientation have been altered.Consider Human-in-the-Loop Systems
The purpose of Human-in-the-Loop technology is to accomplish what neither a human nor a machine can do on their own. When a machine confronts a problem, humans must intervene and fix the problem for them. As a result of the continual feedback, the system learns and improves its performance with each consecutive run. Finally, human-in-the-loop leads to more accurate rare datasets of safety and precision.Change the Way People Learn About Science and Technology
A significant shift is required in the approach to how people are educated about technology and science. It is high time to restructure science and technology education. Science is currently taught objectively, and more transdisciplinary collaboration and educational rethinking are required.Some concerns should be addressed and resolved on a worldwide scale and other issues should be addressed locally. Every principle and standard, governing body, and people voting on things and algorithms should be verified from time to time. Making a more diverse data collection will not fix the problem. But that is just one factor.
Will Artificial Intelligence Ever be Unbiased?
The answer is both no, and yes. Well, it's feasible, but an impartial AI is only in dreams and probably it will never exist. This is because an impartial human intellect is unlikely to ever exist. An AI system is only as good as the data it gets as input. Assume you can free your training dataset of conscious and unconscious biases regarding race, gender, and other ideological concepts. In such a situation, you'll be able to build an artificial intelligence system that makes objective data-driven decisions.In short, the fact is that an impartial human mind, as well as an AI system, will never be realised. After all, people are the ones who generate the skewed data, and humans and human-made algorithms are the ones who evaluate the data to find and rectify biases. However, we can overcome AI bias by validating data and algorithms and applying best practices to collect data, use data, and construct AI algorithms.