How AI Decision-Making is Improving Enterprise Outcomes
Blog
Share 
Let the force be with you: Data residency and Hyperforce
After two very long masked years, the world has slowly started to breathe, again!
With lockdowns on and work taking place from the very room you had slept a couple of hours back -- the human universe has been phenomenally re-engineered by a microscopic organism.
Your geographical location has been made immaterial in the digital world. But the same cannot be said about data, and this may sound paradoxical and ironic. For instance, an MNC’s location of the data now matters more than ever before. With a major chunk of data of many entities, especially government ones, on the public cloud, the airing of concerns related to data security, data sovereignty, data localisation/ data residency is growing louder in decibel terms.
This is where Hyperforce comes in.
Hyperforce is how Salesforce has reimagined its platform. It is now horizontally scalable, and through tie-ups with major cloud providers, the scalability has grown by leaps and bounds. Imagine you are a B2B company with 10,000 customers or a B2C company with tens of millions of customers: Hyperforce lets you scale up your capabilities and provides you with a single source of truth. But what if you are a multi-geographic business conglomerate in a heavily regulated industry like finance or health? How will you comply with data sovereignty, data localisation/ data residency requirements? Hyperforce’s collaboration with public cloud companies ensures that the data can be located at any specified place in the world, adhering to the local rules of data governance and storage locations. “Choose the location where your data will be stored to comply with regulations specific to your company, region, or industry — even in highly regulated industries like the public sector,” the store-data-locally-keep-it-compliant-globally mantra tells. Other features Hyperscalable: Hyperforce also enables you to scale the infrastructure as per the needs of the business by letting you access extra computing capacity as and when required. You can employ resources in the public cloud rather quickly. Yes, it is your decision whether to scale up or not, and the elasticity can be dictated by the nature of your requirements. Hypersecure: Also, trust is built-in, which puts security at the forefront of the architecture. Data privacy and security are sacrosanct. This leaves you with enough room to focus on innovation. Hypercompatible: And most important of all, backward compatibility ensures that all the extant Salesforce apps, customisations and integrations will continue to work on Hyperforce regardless of cloud. In the physical world, your geographical location assumes importance. But in the digital world, it is the location of the data that matters. Hyperforce, by virtue of its collaboration with major players in the cloud domain, ensures data residency requirements are adhered to when and where needed. The architecture is hyper-scalable, secure, and comes with backward compatibility. Hyperforce is soon to be launched in the UAE, and Beinex, a Salesforce partner, is all set to carry out implementation and consulting of and for Hyperforce.In the physical world, your geographical location assumes importance. But in the digital world, it is the location of the data that matters. Hyperforce, by virtue of its collaboration with major players in the cloud domain, ensures data residency requirements are adhered to when and where needed.
The architecture is hyper-scalable, secure, and comes with backward compatibility.
The architecture is hyper-scalable, secure, and comes with backward compatibility.
Related Articles

How Nissan Middle East FZE standardized interactive data visualization by implementing the “PowerBI Report Server” platform on AWS that drove faster and smarter decisions leading to 21% increment in net profit
Challenge
- The IT infrastructure of Nissan Middle East FZE where the PowerBI Report Server platform was hosted was in an on-premise datacenter which was designed to be scalable and robust with multi node physical clusters including the server, storage and network components. However, most of the physical hardware was quite old and not equipped with the latest generation of physical servers.
- Frequent hardware crashes and portal downtime kept troubling the availability of the PowerBI Report Server application. Assigning a touch hand support person to power on the hardware that was down seemed quite impossible due the restrictions during covid period. Hence, Nissan Middle East FZE wanted to look for another viable solution.
- Though the hardware setup at Nissan Middle East FZE was well equipped to meet the occasional spikes in the traffic, it was observed that over a course of 6-month time, most of the IT infra was underutilized than predicted. It was realized that spending huge amount of money on an old hardware plus software maintenance, license costs, internet bandwidth, datacenter cooling and maintenance, touch support personnel and electricity costs – were keeping the business operations challenging.
- There was an attempt by Nissan Middle East FZE to select a cost-effective solution that can host PowerBI Report Server application servers, web servers and archival data. This way IT infra can be re-provisioned to host sensitive data on-premise and the rest on the cloud, thereby reducing the overall physical hardware costs spent on a yearly basis.
Why AWS
- Nissan Middle East FZE decided to migrate PowerBI Report Server, database servers and archival data to AWS.
- The PowerBI Report Server’s AWS architecture includes Amazon Elastic Compute Cloud (Amazon EC2), that provides complete control of its computing resources, updates to tables in Amazon Relational Database Service (Amazon RDS) and AWS Elastic Load Balancer was used to distribute the traffic to the underlying EC2 instances based on the load.
Benefits

A Complete Guide on 360 Advanced Analytics with Tableau and Alteryx
How can You Use Alteryx and Tableau for Advanced Analytics
1. Data Preparation with Alteryx
Alteryx provides powerful data preparation capabilities, including data cleaning, data integration, and data transformation. You can make use of it for:
- Importing data from various sources such as databases, spreadsheets, or APIs.
- Creating data preparation workflows, connecting different tools to cleanse, filter, aggregate, and manipulate your data. Use Alteryx's visual workflow interface.
- Deriving additional insights from your data to leverage Alteryx's advanced analytics tools like predictive modelling, time series analysis, or clustering.
2. Advanced Analytics with Alteryx
Alteryx offers a list of advanced analytics tools, such as predictive analytics, spatial analytics, and text analytics, that can be utilised for:
- Building machine learning models and performing regression analysis or classification tasks.
- Analysing geographic patterns, performing spatial clustering, or conducting network analysis.
- Performing sentiment analysis or topic modelling and extracting insights from unstructured text data by using Alteryx's text mining tools
3. Data Visualization and Reporting with Tableau
Once your data is prepared and enriched in Alteryx, you can connect Tableau to the output data and create interactive visualisations, and perform the following:
- Use Tableau's drag-and-drop interface to create charts, graphs, dashboards, and reports to visualise your data.
- Leverage Tableau's advanced visualisation features like calculated fields, table calculations, or trend lines to enhance your analysis.
- Combine multiple data sources, including the output from Alteryx, to create comprehensive dashboards that provide a holistic view of your data and insights.
4. Integrating Alteryx and Tableau
When it comes to pushing data from Alteryx to Tableau, there are indeed a couple of approaches you can consider ensuring a smooth integration between the Alteryx and Tableau platforms. Alteryx allows you to export the prepared and enriched data as a Tableau Data Extract (.tde) or Tableau Hyper Extract (. hyper) file. You can make use of it for the following functions:
Publishing Data Source Directly to Tableau Server:
Writing Data in Tableau’s hyper Format:
To integrate Alteryx with Tableau, you can:
Beinex partnership with Tableau & Alteryx
As the premium partner of Alteryx and Tableau, Beinex offers a unique advantage in leveraging the combined power of these two tools for your business. Our experts can help you unlock the full potential of your data through sophisticated data preparation, advanced analytics, and compelling visualisations that provide deeper insights into your business operations.
With our expertise, you can effectively make data-driven decisions and communicate complex analytics. Whether you need help with implementation, training, or ongoing support, Beinex is your go-to partner for all your data analysis needs. Get in touch with us today and see how we can help you transform your business with the combined power of Alteryx and Tableau.
Top Picks: Tableau 2020.4
As a frequent user of Tableau Desktop and Server, check out my top picks from the list.
• Improved dynamic parameter
• Multiple marks layer support for maps
• Block comments in calculations
• Web authoring enhancements
• Offline map support for Tableau Server
• Tableau Server Management (TSM) improvements
• Multiple key activation on Tableau Server prior to TSM initialization
• Analytics Extension for Tableau Online
• Merge duplicate external assets
• Tableau Prep Builder in the browser
Tableau Desktop
Improved Dynamic Parameter
The dynamic parameter was one of the features which I used extensively starting from 2020.1. The feature allows us to populate parameter values based on a specified field whenever the workbook is opened. We will be able to select only the field with matching data types.
The feature update announced in Tableau 2020.4 gives me more privilege to customize the Dynamic Parameter. I can now set a parameter’s range to a field’s min and max value upon opening the workbook, or when the field’s data source is refreshed.
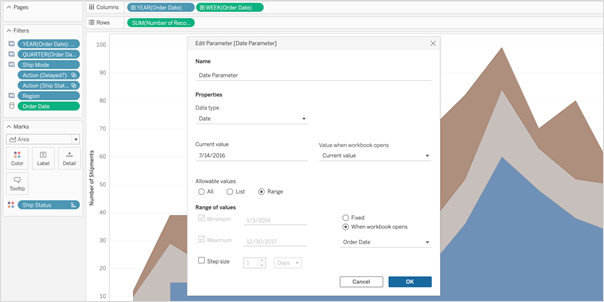 So, whenever I open the workbook or the extract is refreshed, Tableau displays the unique values within the range specified, giving more control over the parameter values displayed.
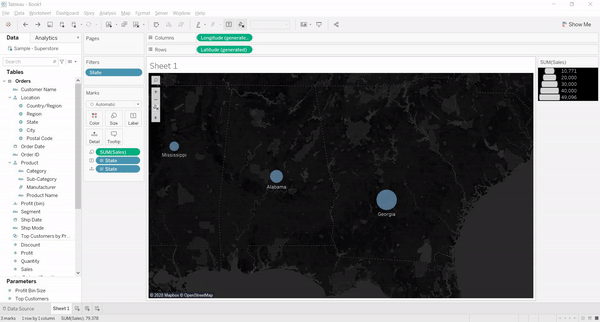
Multiple Marks Layer Support for Maps
This is an exceptional feature to bring multiple spatial layers and context together to better understand and analyze geospatial data and map views. I will be able to include multiple marks layers from a data source to map visualizations and enhance the geospatial analysis. I can present more context in a single map view and perform further analysis with this feature.
So, whenever I open the workbook or the extract is refreshed, Tableau displays the unique values within the range specified, giving more control over the parameter values displayed.
Multiple Marks Layer Support for Maps
This is an exceptional feature to bring multiple spatial layers and context together to better understand and analyze geospatial data and map views. I will be able to include multiple marks layers from a data source to map visualizations and enhance the geospatial analysis. I can present more context in a single map view and perform further analysis with this feature.
 Block Comments in Calculations
Block comments is a simple yet one of the most useful features for me, which Tableau has announced in 2020.4. I often used to add comments in complex calculations for easy understanding in future references. Earlier, only single-line comments were possible, limiting the description I could add. But from now on, I can add comments of any length to calculation windows with block comments by simply starting the comment with /* and ending with */.
What makes it unique is that the new multi-line block comment feature is consistent with other popular programming languages. This feature is an example of Tableau’s on-going effort to provide its customers with an intuitive user experience.
Block Comments in Calculations
Block comments is a simple yet one of the most useful features for me, which Tableau has announced in 2020.4. I often used to add comments in complex calculations for easy understanding in future references. Earlier, only single-line comments were possible, limiting the description I could add. But from now on, I can add comments of any length to calculation windows with block comments by simply starting the comment with /* and ending with */.
What makes it unique is that the new multi-line block comment feature is consistent with other popular programming languages. This feature is an example of Tableau’s on-going effort to provide its customers with an intuitive user experience.
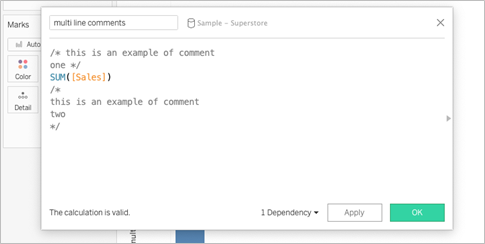 Tableau Server
Web Authoring Enhancements
Starting from Tableau 2020.4, it is possible to author dashboards from the browser just like how we design it in Tableau Desktop. With this web authoring enhancements, I can include Highlight actions, Format Mark Labels, apply filters to worksheets, create fixed sets, and even create extract in my workbooks from the browser itself. I no longer have to make changes from Tableau Desktop and publish it to the server. I can directly do it from the browser itself.
Tableau Server
Web Authoring Enhancements
Starting from Tableau 2020.4, it is possible to author dashboards from the browser just like how we design it in Tableau Desktop. With this web authoring enhancements, I can include Highlight actions, Format Mark Labels, apply filters to worksheets, create fixed sets, and even create extract in my workbooks from the browser itself. I no longer have to make changes from Tableau Desktop and publish it to the server. I can directly do it from the browser itself.
 Offline Map Support for Tableau Server
Rendering dashboards with maps is now faster compared to previous versions. Now, I can create maps using the offline map style in web authoring, ensuring the performance of map views in Tableau Server. Offline map support is a great deal for organizations with strict internet access restrictions, assuring that map view access to all its users.
Tableau Server Management (TSM) Improvements
Tableau Server Administration activities like installation, upgrade and backup are now easy like never before. I can retry installation or upgrade from the last checkpoint in case of an unexpected issue or error during installation or upgrade, saving my efforts to obliterate tableau server.
Backups can be performed twice as fast as previous versions, and I can monitor the progress with the new progress bar giving visibility into what step the backup is on and how much time is remaining.
Backups can also be scheduled using TSM command starting from 2020.4 and that is awesome. I no longer need to prepare batch script and depend on the windows task scheduler to schedule the backups on regular intervals; instead, I can schedule it with just a single command.
Multiple Key Activation on Tableau Server Prior to TSM Initialization
During Tableau Server installation, it is now possible to activate multiple license keys prior to TSM initialization. I will be able to save a lot of time by eliminating the need to restart after the installation is completed to activate multiple licenses and experience a smoother installation.
Analytics Extension for Tableau Online
The power of the Analytics extension is now unlocked in Tableau Online too. The feature was already available in Tableau Server, and it helped us dynamically perform advanced analysis with models and functions in R, Python and other platforms.
Analytics extension in Tableau Online significantly enhances the scope of using Advanced Analytics by the common users.
Merge Duplicate External Assets
Earlier, the Database or Table with similar names used to appear as multiple assets within Tableau Catalog. But, the new feature helps me to merge those multiple assets into a single one. I can manage assets easily and keep an organized view of External assets by merging the common ones.
Offline Map Support for Tableau Server
Rendering dashboards with maps is now faster compared to previous versions. Now, I can create maps using the offline map style in web authoring, ensuring the performance of map views in Tableau Server. Offline map support is a great deal for organizations with strict internet access restrictions, assuring that map view access to all its users.
Tableau Server Management (TSM) Improvements
Tableau Server Administration activities like installation, upgrade and backup are now easy like never before. I can retry installation or upgrade from the last checkpoint in case of an unexpected issue or error during installation or upgrade, saving my efforts to obliterate tableau server.
Backups can be performed twice as fast as previous versions, and I can monitor the progress with the new progress bar giving visibility into what step the backup is on and how much time is remaining.
Backups can also be scheduled using TSM command starting from 2020.4 and that is awesome. I no longer need to prepare batch script and depend on the windows task scheduler to schedule the backups on regular intervals; instead, I can schedule it with just a single command.
Multiple Key Activation on Tableau Server Prior to TSM Initialization
During Tableau Server installation, it is now possible to activate multiple license keys prior to TSM initialization. I will be able to save a lot of time by eliminating the need to restart after the installation is completed to activate multiple licenses and experience a smoother installation.
Analytics Extension for Tableau Online
The power of the Analytics extension is now unlocked in Tableau Online too. The feature was already available in Tableau Server, and it helped us dynamically perform advanced analysis with models and functions in R, Python and other platforms.
Analytics extension in Tableau Online significantly enhances the scope of using Advanced Analytics by the common users.
Merge Duplicate External Assets
Earlier, the Database or Table with similar names used to appear as multiple assets within Tableau Catalog. But, the new feature helps me to merge those multiple assets into a single one. I can manage assets easily and keep an organized view of External assets by merging the common ones.
 Tableau Prep
 Builder in the Browser
Prepare the data for visualizations from anywhere using a browser! Starting from 2020.4, Tableau is bringing the data prep process into one integrated platform on the web. Now I can easily prepare and manage prep flows from anywhere using a browser.
Tableau Prep
Tableau Prep Builder in the Browser
Prepare the data for visualizations from anywhere using a browser! Starting from 2020.4, Tableau is bringing the data prep process into one integrated platform on the web. Now I can easily prepare and manage prep flows from anywhere using a browser.
 Conclusion
Tableau is progressively evolving as a single platform for data preparations, visualization, and collaboration with every update and version release.
Author : Firdous Maqbool
Images Courtesy : Tableau
Conclusion
Tableau is progressively evolving as a single platform for data preparations, visualization, and collaboration with every update and version release.
Author : Firdous Maqbool
Images Courtesy : Tableau
So, whenever I open the workbook or the extract is refreshed, Tableau displays the unique values within the range specified, giving more control over the parameter values displayed.
Multiple Marks Layer Support for Maps
This is an exceptional feature to bring multiple spatial layers and context together to better understand and analyze geospatial data and map views. I will be able to include multiple marks layers from a data source to map visualizations and enhance the geospatial analysis. I can present more context in a single map view and perform further analysis with this feature.
Block Comments in Calculations
Block comments is a simple yet one of the most useful features for me, which Tableau has announced in 2020.4. I often used to add comments in complex calculations for easy understanding in future references. Earlier, only single-line comments were possible, limiting the description I could add. But from now on, I can add comments of any length to calculation windows with block comments by simply starting the comment with /* and ending with */.
What makes it unique is that the new multi-line block comment feature is consistent with other popular programming languages. This feature is an example of Tableau’s on-going effort to provide its customers with an intuitive user experience.
Tableau Server
Web Authoring Enhancements
Starting from Tableau 2020.4, it is possible to author dashboards from the browser just like how we design it in Tableau Desktop. With this web authoring enhancements, I can include Highlight actions, Format Mark Labels, apply filters to worksheets, create fixed sets, and even create extract in my workbooks from the browser itself. I no longer have to make changes from Tableau Desktop and publish it to the server. I can directly do it from the browser itself.
Offline Map Support for Tableau Server
Rendering dashboards with maps is now faster compared to previous versions. Now, I can create maps using the offline map style in web authoring, ensuring the performance of map views in Tableau Server. Offline map support is a great deal for organizations with strict internet access restrictions, assuring that map view access to all its users.
Tableau Server Management (TSM) Improvements
Tableau Server Administration activities like installation, upgrade and backup are now easy like never before. I can retry installation or upgrade from the last checkpoint in case of an unexpected issue or error during installation or upgrade, saving my efforts to obliterate tableau server.
Backups can be performed twice as fast as previous versions, and I can monitor the progress with the new progress bar giving visibility into what step the backup is on and how much time is remaining.
Backups can also be scheduled using TSM command starting from 2020.4 and that is awesome. I no longer need to prepare batch script and depend on the windows task scheduler to schedule the backups on regular intervals; instead, I can schedule it with just a single command.
Multiple Key Activation on Tableau Server Prior to TSM Initialization
During Tableau Server installation, it is now possible to activate multiple license keys prior to TSM initialization. I will be able to save a lot of time by eliminating the need to restart after the installation is completed to activate multiple licenses and experience a smoother installation.
Analytics Extension for Tableau Online
The power of the Analytics extension is now unlocked in Tableau Online too. The feature was already available in Tableau Server, and it helped us dynamically perform advanced analysis with models and functions in R, Python and other platforms.
Analytics extension in Tableau Online significantly enhances the scope of using Advanced Analytics by the common users.
Merge Duplicate External Assets
Earlier, the Database or Table with similar names used to appear as multiple assets within Tableau Catalog. But, the new feature helps me to merge those multiple assets into a single one. I can manage assets easily and keep an organized view of External assets by merging the common ones.
Tableau Prep
Tableau Prep Builder in the Browser
Prepare the data for visualizations from anywhere using a browser! Starting from 2020.4, Tableau is bringing the data prep process into one integrated platform on the web. Now I can easily prepare and manage prep flows from anywhere using a browser.
Conclusion
Tableau is progressively evolving as a single platform for data preparations, visualization, and collaboration with every update and version release.
Author : Firdous Maqbool
Images Courtesy : Tableau
Beinex Opens its Corporate Office in the Kingdom of Saudi Arabia
In the last few years, the KSA market has witnessed a definitive shift to self-service consumption tools anchored in data democratization. The transition is of paramount importance for products that can scale at an enterprise level, AI-ML products, and those that can address data governance and quality management issues.
The shift is also significant for enterprise transformation catalysts that take an ecosystem approach with proven expertise in developing and executing comprehensive and unified data strategies, data engineering and data governance paradigms.
Thus the time is ripe for an innovation-led, experience-driven enterprise like Beinex to spearhead Digital and Analytics Transformations in KSA.
[sc name="quote" quote="“Beinex is pleased to formalize its presence in the KSA market by opening an Office in Riyadh. We, as an enterprise, are 100% aligned with Vision 2030 as put forth by the KSA and see tremendous value getting unlocked as the vision is realized. We look forward to expanding our footprint in the domains of Artificial Intelligence, Sustainability, Digital Transformation, Analytics and allied areas. The Kingdom envisions itself to be at the forefront of data and artificial intelligence-based economies, and Beinex is committed to playing its part in supporting and fulfilling this vision,”" author="Indumon Das, Founder and Managing Director of Beinex,marking the occasion of the office’s opening, noted."][/sc]
Middle East Banking AI & Analytics Summit
Beinex is super excited to be a part of the 6th Middle East Banking AI & Analytics Summit on May 10, 2023. With the motto, "Accelerating Innovation in Banking with AI and Analytics Strategies", the summit aims to revolutionise the financial and banking space in KSA using AI. We are ready to witness and participate in panel discussions, fireside chats, keynote presentations, roundtable discussions, and conversational Q&A sessions with thought leaders on exploiting the Power of AI and Analytics for a futuristic banking ecosystem.
Middle East Enterprise AI & Analytics Summit
Also, we are enthusiastic to participate in the Middle East Enterprise Al and Analytics Summit on May 11, 2023. Its vision is to curate a world-class platform for tech leaders in the region to connect, communicate and collaborate under the theme "Accelerating Innovation in Enterprises with Applied Al and Analytics Strategies". Beinex is looking forward to connecting with thought leaders and high-level decision-makers in Al, and Data Analytics at #MEEAI 2023 to participate in discussions and to be a part of the transformation journey.The Power of Beinex
Beinex drives a cohesive, unified digital ecosystem to help customers address their needs, assess products and operations, understand market requirements and evaluate overall business performance.
It is a multinational firm exploring the endless possibilities of data for Cloud, Analytics, Artificial Intelligence, Machine Learning, and Automation. In effect, Beinex architects, guides, leads, and implements solutions in Analytics, AI, and ML for the spheres of Digital Transformation, GRC, and Risk & Audit Transformation.
Partnerships make Beinex stronger. The company has solid partnerships with some of the leading technology firms, research labs, and universities around the globe. Businesses can leverage the power of the Beinex partner ecosystem to maximize the value of their end-to-end analytics journey.
Beinex Digital, a part of Beinex Holdings, is a digital transformation entity with a comprehensive suite of independent products focused on addressing specific business gaps, use cases, and needs. It incorporates a spectrum of solutions in the domains of Employee Health, Safety and Environment, Enterprise Product Management and Enterprise Performance Management.
Beinex is also the product champion for Aurex – Augmented Risk and Audit Analytics – a unique single-platform solution for Integrated Risk Management, Governance, Audit, Compliance, BCM, and Analytics functions. It is the first-of-its-kind product that streamlines risk and audit verticals for enterprises worldwide and is a Unified Digital Assurance Ecosystem.
Present in three continents, Beinex enables its clients to analyze data, mitigate risks, identify opportunities and automate processes.
Beinex Office Address (KSA):
Beinex Advanced Information Technology3141, Anas Bin Malik,
8292 Al Malqa Dist
P. O. Box 13521,
Riyadh, Kingdom of Saudi Arabia
Email: Info@beinex.com

Employee Churn Prediction Model: Experience Certainty in HR Matters
Many businesses make a concerted effort to create work cultures that increase job happiness, encourage people to find meaning and satisfaction in their work, reward and recognize employees for their actions, and foster both personal and professional growth.
While many tactics are adopted for the company’s benefit and to considerably increase retention, leaders cannot rely only on them. They must face the uncomfortable reality that they will eventually lose significant talent if they do not keep an open mind and a realistic outlook on the future. Influential leaders act daily to safeguard themselves, their teams, and their companies from the risk of attrition because wishful retention thinking is not a viable business strategy.
Is it possible to foresee attrition so that it only impacts the business a little less, given that it is impossible to stop employees from leaving? Well, with the help of technology, it is possible. The churn model, among others, can help in this situation. Are you wondering how? Through an employee churn prediction model, we can make it happen. After understanding which employees are on the verge of leaving using the churn model, it is possible to reach out to them and understand their grievances.
Employee Churn Prediction Model
It's a predictive model that calculates the likelihood (or vulnerability) of each employee leaving. It tells us how likely we will lose employees or a specific employee in the future at any given time. It classifies employees into two groups (classes): those who quit and those who don't. It will typically tell us the probability of the employee belonging to which of the groups in addition to placing them in one of the two groups. Thus, a churn model can be used to estimate the chances of resignation.
Explaining the Model
Modern churn models frequently draw their foundation from machine learning, more specifically from binary classification methods. There are several of these algorithms; therefore, it's important to test which one works best in each circumstance. Here we have made use of four machine learning models:
Random Forest
Supervised machine learning algorithms like random forest are frequently employed in classification and regression issues. On various samples, it constructs decision trees and uses their average for classification and majority vote for regression.
The Random Forest Algorithm's ability to handle data sets with both continuous variables, as in regression, and categorical variables, as in classification, is one of its most crucial qualities. In terms of classification issues, it delivers superior outcomes.
KNN
One of the simplest machine learning algorithms, based on the supervised learning method, is K-Nearest Neighbour. The K-NN algorithm assumes that the new case and the existing cases are comparable, and it places the latest instance in the category that is most like the existing categories.
A new data point is classified using the K-NN algorithm based on the similarities after storing all the existing data. This means new data can be quickly and accurately sorted into a suitable category using the K-NN method. Although the K-NN approach is most frequently employed for classification problems, it can also be used for regression.
Decision Tree
The supervised learning algorithms family includes the decision tree algorithm. The decision tree technique, in contrast to other supervised learning methods, can handle classification and regression issues.
By learning straightforward decision rules derived from previous data, a Decision Tree is used to build a training model that may be used to predict the class or value of the target variable (training data).
Support Vector Machine
One of the most well-liked supervised learning algorithms, Support Vector Machine, or SVM, is used to solve Classification and Regression problems. However, it is employed mainly in Machine Learning Classification issues.
The SVM algorithm's objective is to establish the best line or decision boundary that can divide n-dimensional space into classes, allowing us to quickly classify new data points in the future. A hyperplane is a name given to this optimal decision boundary.
SVM selects the extreme vectors and points that aid in creating the hyperplane. Support vectors representing these extreme instances form the basis for the SVM method.
A Step-By-Step View of the Process
Step 1: Loading data to databricks
In the initial stage, CSV data collected are loaded to the churn model. Any type of data sets can be employed here depending on the situation.
Step 2: Transformation: converting to the requisite format
While uploading, objective data sets are transformed into integers.Step 3: Feature selection
There are four feature selection algorithms from which we take the best one to filter out undesired features. The selection of filtering features differs for each type of data based on the algorithm.Step 4: Splitting the data
After the feature selection, the next step is to split the data for training and testing—then divide the data into a 7:3 ratio. In the training set, we train our model with data to understand the attrition patterns and later test it with data in the testing set.Step 5: Standardisation
In this step, data is converted into a standard format that allows for large-scale analytics.Step 6: Model selection
During model selection, datasets are provided to the machine algorithms like Random Forest, KNN, Decision tree and Support vector machine. Each algorithm produces its own sets of accuracy values; from that, the most accurate predictions are selected. Using the same procedure, we can categorize the employees into groups, for example, those who are planning to resign and those who are not.
Step 7: Result generation
The result is built on how each machine learning model performs with the dataset. The accuracy value depends on the performance of each model—the higher the accuracy, the higher the probability of accurately predicting the outcomes for each employee.