How AI Decision-Making is Improving Enterprise Outcomes
Blog
Share 
Infusing a Dash of Freshness in Tableau: Relaunching Tableau Online as Tableau Cloud!
 21 June 2022
  Sumi S
 Tableau Cloud is a web-based data visualization tool. It is a part of the futuristic notion that enabled the evolution of a completely hosted, cloud-based solution, enabling wiser decisions through quick, flexible, and simple analytics. Tableau Cloud helps more people and teams obtain insights and become more innovative and competent decision-makers by distributing reliable data across enterprises, eventually leading to better, data-driven outcomes.
Tableau Cloud takes pride in the fact that the system is built to fit any enterprise architecture, with industry-leading security features, the highest certification requirements such as SOCII and ISO, and best-in-class governance capabilities to guarantee your data is always in the right hands.
The expected features are all here, with solid and intelligent additions such as Advanced Management, Data Stories, new embedded functionality, etc. These vital advancements add to the advantages of moving Tableau to the cloud, such as time savings, flexibility, and decreased costs. Still, they also give insights that evolve scale without having to install or maintain any software or hardware.
The most wanted features are here:
Advanced Management - Advanced Management contains several operational insight elements to gain information into visualisation load times, user interactions, number of views, and more. Admin Insights delivers easy-to-understand visualisations derived from the environment's usage statistics, and the Activities Log gives granular event data to create a record of activity. The newly added feature helps to handle critical analytics with ease. Features like flexible control, better security and manageability, and limitless scalability are designed to help the business thrive.
Data Stories – Data stories help to get clear, automated explanations for dashboards in no time. Make dashboard analytics simple with clear, automatic explanations. Big data is divided into critical aspects, and insights are provided in simple terminology
Embedded Analytics – Embedded Analytics integrates analytics seamlessly into the products and applications, surfacing insights to the users wherever they are, including public domains. It's straightforward to configure, integrate, and deploy Embedded Analytics right into your applications, products, and online portals. Tableau Cloud will allow administrators to share their workbooks and visualisations with the public, enabling users to view their information without logging in.
Tableau Cloud is an easy-to-use self-service platform, and all you must do is prepare your data, author, analyze, collaborate, publish, and share on Tableau Cloud
 Source: https://www.tableau.com/products/cloud-bi
Tableau Cloud is user-friendly, and its activation can be done with a finger snap. The first step is to configure the authentication mechanism and securely publish interactive dashboards and data because it is managed and hosted by Tableau.
The material will then be accessible from any browser or mobile device, allowing the team to collaborate and share analytics with everyone, anywhere. Simple, right!
Feel free to request a free trial using this link.Who does not like a makeover? So is Tableau. Tableau Online is now Tableau Cloud! This makeover highlights the modern, sophisticated advances that enable everyone to make smarter, faster decisions.
Related Articles

All You Need to Know About Tableau Filters: Types of Filters in Tableau
Tableau filters allow their users to perform simple filtering using available metrics, as well as perform advanced filtering using complex calculations. While developing dashboards, Tableau offers the flexibility to view different types of filters such as drop-down filters, wildcard filters, list filters and many more. To enhance dashboard interactivity, Tableau has provided “Filter Actions” which allow users to filter an entire dashboard as per the value selected by the user in a particular visualization.
To create a filter that suits the user's requirements, Tableau engages several filtering techniques which also enhance data processing efficiency Each filter is designed for a specific function, and the order in which they are run can significantly impact performance.
6 Types of Filters in Tableau
Tableau employs six different types of filters, which are listed in the sequence of execution:
- Extract Filters
- Data Source Filters
- Context Filters
- Dimension Filters
- Measure Filters
- Table Calculation Filters
1. Extract Filters
Extract filters are utilised during the initial stage of data filtering. When datasets are uploaded to Tableau, we can utilise the extract filter to minimize the number of Tableau queries for the data source. By applying filters to the extract, we can further decrease the size of the data.
2. Data Source Filters
Data Source filters sort out any crucial or sensitive information while putting data into Tableau. It is compatible with both the Live and Extract connections.
We can add the data source filter to any column by selecting the ADD option. After selecting the ADD option, the ADD Filter dialogue box will appear, displaying all the fields. We can then select the field to which we wish to apply the filter and it is possible to change or delete data source filters as needed.
3. Context Filters
A context filter is generally used when we require this filter to be applied before any other filter. It has the potential to enhance the performance of massive data sources. They are made by dragging the dimension to the filter section box and selecting the Add to context option. This will make the dimension pill change its colour to “Grey”, indicating it is a context filter. Similarly, by clicking "Remove from Context", the filter becomes a simple dimension filter. A common use case for this filter would be when a user would like to find the top N products in any category.
4. Dimension Filters
Dimension fields include discrete categorical data, and we can remove or add the values we want to investigate. The process is simple as outlined below:
Step 1: Drag the dimensions from the dimension list to the filter section box.Step 2: From the Filter Dialog box, select the values that we want to analyze.
The Filter dialogue box contains four tabs:
- General: To select the members present in the dimension to either include or exclude
- Wildcard: To filter the result based on a particular pattern
- Condition: To filter the result based on a particular condition
- Top: To filter the Top N products belonging to a particular category.
5. Measure Filters
Measure filters are applied to the measure fields, which have quantitative data. It can be used as follows:- Drag the measured field from the Measure box to the Filter area
- Filter dialogue box with several functions will appear.
- Select the operation that needs to be performed and click Next.
In the subsequent dialog box, there are 4 types of filters:
- Range: To select the range of values to include in the result.
- At least: Select the minimum value of a measure to filter the data.
- At most: To select the maximum value of a measure to filter the data.
- Special: To select null or non-null values.
6. Table Calculation Filter
Table Calculation Filters, being the last type of filters to be executed in the sequence of execution, do not filter out the underlying data. It is mostly used to filter out contents in the current view. Table Calculations are functions that are utilised for building Calculated Fields like LOOKUP, WINDOW SUM, WINDOW AVG, and so on.Summing Up
Tableau Filters are the most commonly used feature by many organizations. It allows the clients to filter out confidential data and allows them to provide controlled view access to different internal users so that only data relevant to the user is accessed. Filtering out data means data processing becomes more efficient, which in turn makes the report generation process faster which in turn helps the organization arrive at quick and insightful business decisions.Use Cases Addendum
Let’s find out how Tableau filters work to solve various tasks :Use Case 1:
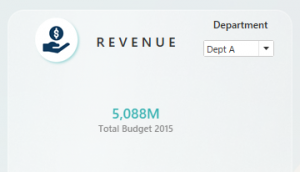

A simple drop-down filter can be used to filter the view of our requirements as shown in the visualization above.
In this example, Dept A has been selected such that the Total Budget is shown only for Dept A. Once we select Dept B, the Total Budget shows the respective value for Dept B
Use Case 2:

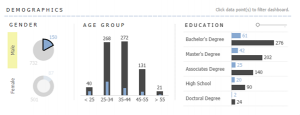
In the visualizations above, we can see the customer demographics related to gender, age group and educational status. With the help of Tableau’s Filter Actions, one can click on a particular segment and filter the rest of the visualizations as per the requirement.
For example, if we require to find how many customers in the age group of 35-44 are males, all we have to do is to click on the doughnut chart for “Male”, and the visualizations will show only the data for males. Now, we can find that the number of male customers in the age group of 35-44 is 272.
Use Case 3:
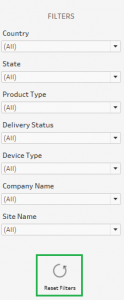
The Filter Action feature in Tableau can be leveraged to develop several creative solutions for customers. One such solution is the “Reset Filter” as shown in the above visualization.
With a combination of filters and filter actions, one can develop a reset filter that, on clicking, would reset all the currently applied filters on the dashboard and bring it back to its original unfiltered view. This comes in handy if the dashboard consists of multiple visualizations and contains heavy data.

Top 6 AMS Best Practices to Boost AWS Cloud Security in 2025
What is AWS Managed Services (AMS)?
AWS Managed Services (AMS) is a fully managed service that helps businesses run AWS environments at scale. It adheres to industry best practices for operational excellence, security, and compliance.
• Key Benefit of AWS: AMS enables your company to spend less time managing the complexities of cloud operations and more time focusing on business outcomes.
AMS handles:
• Infrastructure Management: Includes continuous monitoring, patching, and lifecycle management of your AWS resources.
• Security & Compliance: Generates automated compliance checks against NIST, PCI-DSS, GDPR, and HIPAA frameworks.
• Operational Support: 24×7 incident response, backup, disaster recovery, and governance.
• Automation & Optimization: Uses custom runbooks and built-in AWS features to reduce manual labor.
Why AMS Matters in 2025
Cloud adoption is growing, but so is the risk associated with it. Even though many businesses:
• Lack 24/7 monitoring.
• Struggle with regulatory audits.
• Depend on manual vulnerability patching.
AMS offers solutions to mitigate the risks associated with cloud adoption. It resolves the issue by utilizing automation, continuous monitoring, and best practices from AWS. You can implement AMS at scale, without overloading internal teams.
Top 6 AMS Cloud Security Best Practices
1. Prevention: Stop Threats Before They Happen
• Identity & Access Management (IAM): AMS provides real-time validation of modifications, enforces least-privilege policies, and automatically corrects deviations.
• Network Security: AMS configures AWS WAF, Firewall Manager, and Network Firewall to block malicious traffic.
• Patch & Vulnerability Management: AMS automates scanning and patching, including zero-day threats, with Systems Manager + Inspector.
• Backup & Disaster Recovery: With recovery testing and ransomware prevention, AMS fortifies AWS Backup & DRS.
2. Detection: Spot Threats in Real Time
• GuardDuty & Macie: Sensitive data is protected, and anomalous activity is detected.
• Security Hub: Assists with noise reduction, alert aggregation, and issue prioritization.
3. Monitoring & Incident Response
• 24×7 global monitoring with NIST-aligned runbooks.
• Automated incident response using Systems Manager + CloudWatch.
• Integrations with ServiceNow, Jira, Slack, and Teams for faster collaboration.
4. Compliance Made Simple
Adhering to compliance frameworks such as HIPAA, PCI-DSS, SOC, GDPR, and NIST is complex for all companies. AMS embeds compliance controls from day one.
• Continuous Compliance Monitoring: Automated checks via AWS Config rules.
• Audit Trails: CloudTrail & Athena queries for reporting.
• Certified Services: AMS itself is compliant with major frameworks.
5. Governance & Reporting
• Resource Tagging: For governance, cost allocation, and reporting.
• Self-Service Dashboards: Patch compliance, backup coverage, and incident stats.
• Monthly Business Reviews: Joint sessions with Beinex + AWS experts.
6. Security On-Demand: Flexibility When You Need It
AMS Operations on Demand (OOD) lets you scale support instantly for:
• Emergency vulnerability remediation.
• Legacy OS upgrades.
• Firewall operations.
Why You Should Opt for AMS Security?
AWS provides the platform. AMS provides the tools. It ensures:
• Faster ROI → measurable security improvements within 6–12 months.
• Local + Global Expertise → deep knowledge of GCC regulations + AWS global best practices.
• End-to-End Ownership → from planning to monitoring, audits, and response.
Secure Your AWS Cloud with Beinex
Beinex’s Cloud Engineering Services help organizations maximize their AWS investments through robust security frameworks and modernization strategies.
Our Core Offerings Include:
• Cloud Security
• Security Assessment
• Strategy & Implementation
• Well-Architected Review
• Migration & Modernization
• Cloud Migration
• Cloud Automation & DevOps
• Infrastructure Modernization
Whether you are in the early stages of cloud adoption or looking to optimize your existing AWS, we help you achieve your cloud goals.
Connect with us: https://beinex.com/cloud-engineering

Building Smarter Dashboards with Tableau's AI Features
The Rise of AI-Driven Analytics
Artificial intelligence (AI) has transformed the analytics landscape, enabling organizations to automate complex tasks, identify patterns, and predict future trends. Tableau's AI-powered capabilities are designed to augment human intelligence, streamlining the analytics process and uncovering new opportunities.
Tableau's AI Features: A Brief Dive
1. Tableau Pulse: Powered by AI, Tableau Pulse offers contextual, personalized, and intelligent insights at your fingertips. It redefines data experience by making data accessible to everyone despite their expertise in data visualization tools. The Insights Platform within Tableau Pulse automates the identification of contributors, trends, drivers, and outliers for relevant metrics and streamlines and democratizes data analysis. Tableau Pulse's Metrics Layer lets KPIs and key metrics and KPIs be defined and utilized consistently across the enterprise, creating a unified source of truth for decision-making. Tableau Pulse also offers a Next-Gen Experience by offering intuitive, user-friendly metrics directly into the tools users already work with, such as email or the Tableau web app, enabling users to engage with data in real-time and effortlessly scale insights.
Real-World Application: Employing Tableau Pulse in the supply chain helps track and monitor shipping times, inventory levels, and supplier performance in real time, facilitating informed and proactive decision-making.
2. Tableau Agent: A conversational AI assistant, Tableau Agent facilitates the data journey for new analysts using generative AI to expedite the analysis process from data collection to exploration. Tableau Agent is built on the Einstein Trust Layer, ensuring enterprises' data remains safe and accessible. It streamlines the stages of analysis by effortlessly creating calculations using natural language, making the process easier and faster for technical and non-technical users. It also creates AI-generated descriptions for data sources to convey their objective and essence consistently and informatively.
Real-World Application: In dealing with customer engagement, Tableau Agent helps personalize marketing strategies and campaigns to augment customer interaction based on customer preferences and behavior.
3. Einstein Copilot for Tableau: Quickly identify trends and explore data at every analysis phase with the reliable AI assistant, Eintein Copilot for Tableau. It doesn't matter if you are a novice or a seasoned analyst, as Einstein Copilot for Tableau enhances your Tableau experience by making analytics accessible to facilitate actionable insights and informed decisions. With this feature, you can easily produce AI-generated descriptions of data assets and explore data utilizing natural language directly from Tableau Cloud Web Authoring.
Real-World Application: Utilizing Einstein Copilot streamlines data analysis for business users by offering instant and expert-level insights to the questions asked without needing any technical expertise in data analysis.
4. Tableau Explorer: This feature employs machine learning algorithms to automatically identify key insights, patterns, trends, and correlations within your data. Discovering hidden data insights with AI offers intelligent recommendations for charts, dashboards, visualizations, and dashboards. Further, Tableau Explorer generates data-driven narratives, emphasizing key findings clearly and concisely. It enables users to grasp complex data insights and make informed decisions quickly.
Real-World Application: Using Tableau Explores optimizes operational efficiency by analyzing production data, facilitating the identification of areas of process improvement, and reducing costs.
5. Predictive Analytics: Tableau's predictive models enable you to forecast future outcomes, identify potential risks, and optimize business strategies. Regression analysis identifies relationships between variables while clustering groups similar data points for segmentation. Decision trees visualize complex decision-making processes, making understanding and optimizing outcomes easier.
Real-World Application: Predictive Analytics develops predictive models to forecast revenue and sales, allocate resources efficiently, and analyze data to check for potential setbacks.
6. Natural Language Processing (NLP): Tableau's NLP capabilities allow users to ask questions and receive answers in natural language, simplifying the analytics process. Tableau's Ask Data feature enables users to ask queries in everyday language and get answers instantly. The Explain Data feature automatically describes data patterns and trends and patterns, improving understanding and insight. Besides, text analysis facilitates sentiment analysis, entity recognition, and topic modeling, unlocking valuable insights from unstructured data.
Real-World Application: NLP facilitates the sentiment analysis of customer feedback, that is, analyzing the data from reviews, surveys, and social media to understand customers' sentiments and base decisions accordingly.
7. Automated Data Preparation: Tableau's AI-driven data preparation streamlines data cleaning, joining, and aggregation, freeing up valuable time for analysis. The AI-powered algorithms help identify and rectify errors, propose optimal data formats, and detect inconsistencies and missing values. It ensures data accuracy, completeness, and trustability, allowing users to concentrate on higher-level analysis and decision-making.
Real-World Application: Automating data preparation for financial reports simplifies the process by reducing manual effort and enhancing the accuracy of results.
Organizations across various industries have successfully leveraged Tableau's AI features to:
1. Enhance customer experience as predictive analytics helps identify customer churn patterns.
2. Optimize operations as automated data preparation streamlines supply-chain management.
3. Drive revenue growth as AI-driven insights uncover new business opportunities.
Dashboards that Talk: Revolutionizing Business Insights
Interactive dashboards that engage with you have revolutionized how businesses interact with data, ushering in an era of conversational analytics. Tableau, a pioneer in data visualization, has been at the forefront of this revolution, empowering organizations to unlock hidden insights and drive informed decision-making. With Tableau's natural language processing (NLP) capabilities, users can ask questions and receive answers in a conversational format, eliminating the need for tedious data analysis. This seamless interaction lets stakeholders focus on strategic decision-making rather than getting bogged down in data intricacies. Furthermore, Tableau's automated insights and predictive analytics capabilities allow businesses to forecast trends, identify potential risks, and optimize operations, giving them a competitive edge in today's fast-paced market. The implications of interactive dashboards extend far beyond data analysis, transforming the very fabric of business operations. Executive dashboards can now provide real-time strategic guidance, while sales dashboards can predict performance and identify areas for improvement. Operational dashboards can monitor processes in real time, enabling swift corrective action. Moreover, customer service dashboards can deliver personalized support, fostering enhanced customer experiences. As AI and NLP continue to advance, the possibilities for talking dashboards will only expand, enabling businesses to tap into unprecedented levels of insight and innovation. By embracing these cutting-edge technologies, organizations can unlock new avenues for growth, efficiency, and competitiveness, ultimately redefining the future of business intelligence. With Tableau at the helm, the era of conversational analytics has truly begun, and the potential for transformation is vast.
Building Smarter Dashboards
To harness the full potential of Tableau's AI features, consider the following best practices: 1. Define Clear Objectives: Align your dashboard with key business goals and objectives. 2. Select Relevant Data: Focus on high-quality, relevant data to ensure accurate insights. 3. Leverage AI-Driven Insights: Use Tableau Explorer and predictive analytics to uncover hidden trends. 4. Design Intuitive Visualizations: Create clear, concise dashboards that facilitate decision-making. In today's data-driven landscape, building smarter dashboards is critical for business success. Tableau's AI features empower organizations to unlock hidden insights, drive informed decision-making, and stay ahead of the competition. By embracing these cutting-edge capabilities and following best practices, IT professionals, business leaders, and data analysts can create dashboards that propel business growth and innovation.
Beinex Bags the Title: Best in Data & Analytics at the 12th Edition of Digital Transformation Summit, UAE
Under the thematic area of “Decoding Barriers to Pave the Way for UAE’s Digital Future”, Digital Transformation Summit brings together UAE’s 200+ CTOs, CIOs, CISOs, heads of digital transformation, IT infrastructure, cyber security, information and communication technologies and other experts in the domain.
Beinex is a multinational firm exploring the endless possibilities of data for Cloud, Analytics, Artificial Intelligence, Machine Learning, and Automation.
Partnerships are what make Beinex stronger. The company has solid partnerships with some of the leading technology firms, research labs, and universities around the globe. Beinex has robust, substantive business alliances at multiple levels with Microsoft, Salesforce, AWS, Tableau, Alteryx, Snowflake and other leading techno-ecosystems.
By virtue of these partnerships and its constant urge to drive past excellence benchmarks, Beinex became a deserving candidate to win this prestigious award.
And the Award Goes to Beinex
In effect, Beinex architects, guides, leads, and implements solutions in Analytics, AI, and ML for the spheres of Digital Transformation, GRC, and Risk & Audit Transformation. Present in three continents, Beinex enables its clients to analyze data, mitigate risks, identify opportunities and automate processes.
The award recognizes the relentless pursuit of excellence by Team Beinex in the domains it is into.
“It is a moment of pride and happiness for Beinex. The award secured in the Best in Data & Analytics category at the Digital Transformation Summit, UAE, 2022, is a testimony to the fact that Beinex has continuously and without fail pursued business excellence powered by innovation and experience. We acknowledge and understand that with great recognition comes responsibilities of a greater degree, a calling of a higher order. And we will continue to honor and live up to them. On this joyous occasion, I would love to thank Team Beinex for what they have achieved! This award belongs to them”, noted Indumon Das, the Founder & Managing Director, Beinex.
Beinex Holdings is a group of six companies. As an organization, Beinex believes in the power of ideas, innovation, and unparalleled customer service to change the world for good. Beinex Digital, a part of Beinex Holdings, is a digital transformation entity with a comprehensive suite of independent products focused on addressing specific business gaps, use cases, and needs.
It incorporates a spectrum of solutions related to employee health and safety, enterprise product management, performance management, and audit & risk management.
Tableau New Features Unveiled: Tableau 2023.1 Release
[sc name="quote" quote="“As a practitioner, I believe that the major game changer in the latest version, Tableau 2023.1, is Accelerator Data Mapping. With Data Mapping you can jump-start your analytics even faster by reducing the time and effort required to set up an Accelerator’s ready-to-use dashboards. Now, when configuring an Accelerator, the Data Mapper allows users to pull outside data into the Accelerator and map fields from their data source into the fields the Accelerator expects. This will be made possible via the Data Mapping UI - a hybrid dialogue box that opens by default with any Data Mapping enabled Accelerator”" author="Sanchit Katiyar, Solution Architect at Beinex."][/sc]
Let’s catch up with Tableau’s brand-new capabilities:
1. Tableau for Slack EnhancementsThe Tableau app for Slack has been improved to enhance collaboration on insights. These updates make it simpler to prioritize data in every conversation and decision. New features include the ability to share Tableau content with context using link previews, which helps teams quickly identify and act on pertinent information. Additionally, it's now easier to search for and share Tableau content in direct messages and channels. Finally, you can quickly access your recent and favourite items from the App homepage, making it faster to get to insights.
2. Identity Pools for Tableau ServerIdentity Pools provide a way to go beyond the current restriction of having only one identity store on the Tableau Server. An Identity Pool consists of a "Source of Users" (previously known as the Identity Store) and an authentication mechanism. With this feature, you can add more pools where your source of users can belong to a local identity store and authenticate using OpenID Connect for modern authentication. This added flexibility will benefit organizations that have external users who need access to Tableau but cannot be added to their corporate Active Directory.
3. Dynamically Update Axis TitlesParameters are useful for adding interactivity and flexibility to a visualization. They allow viewers to select how they want to view the data. However, previously, it was not possible to automatically update the axis title.
Dynamic axis titles enable the axis title to be determined by the value of a parameter or a single-value field. This feature allows authors to provide better context for their data visualizations to their audience.
If you've found the single identity store limitation of Tableau Server to be limiting, you'll be pleased to know that Identity Pools offer a solution. In the past, there were only two types of identity stores, local and external, and changing the configuration required a complete reinstall of the Tableau Server.
Identity Pools allow you to overcome this limitation by creating additional pools that combine a "Source of Users" (previously known as the Identity Store) and an authentication mechanism. You can now have your source of users belonging to a local identity store and authenticate using OpenID Connect for modern authentication. This added flexibility allows you to support both internal and external users who are not part of the corporate Active Directory.
The new USER ATTRIBUTE (string) function is now available for personalized data access. This function passes login attributes in a calculation, which can be used as a data source filter for row-level security, beyond just username and group, such as department or region. This allows for the customization of a user's data access in embedded scenarios.
With this new function, you can include additional information about users and send it to Tableau when the users sign in. Tableau will automatically use this information as a filter, only showing corresponding data to the user.
When the filter is applied in your workbook or dashboard, Tableau searches for the value of the attribute in the viewing user's authentication token. Using Connected Apps and SSO for embedding users, you can include the attribute as a claim in the JSON Web Token (JWT) used for user authentication.
How Tableau 2023.1 can be Beneficial to the Tableau Users
With the added new features, you can enjoy the advantages enlisted below:- Greater Flexibility and Security for Both Internal and External Users: Tableau Server now offers greater flexibility and security for both internal and external users with the ability to add local identity stores and authenticate using OpenID Connect.
- Efficient Offline Environment Management: With an enhanced activation solution, managing offline environments is a breeze, thanks to the option to leverage login-based license management.
- Reliable Tableau Mobile: Tableau Mobile is now even more secure, due to added security policies that prevent screen sharing and screenshots on Android devices, as well as the detection of jailbreak and malware.
- Connect to Google BigQuery: Connecting to Google BigQuery is now more efficient than ever, be the new JDBC connector that uses BigQuery's Storage API.
- Resource Monitoring Tool: The tool, which is a component of Tableau Advanced Management, now comes with enhanced features that make logging in easier and allow for more customization options:
- Network Credentials Support: Users can now use their network credentials to log into the Resource Monitoring Tool instead of using a distinct username and password.
- Customizable Run As users: With this new feature, you can set up Run As users for the Resource Monitoring Tool Server and Agent on Linux operating systems to comply with your security policies and apply best practices.
- Tableau Data Management now offers enhanced features that enhance data reliability and flexibility for virtual connections:
- Data Warnings: Data quality warnings are now available in both web authoring and Data Details to help improve data trust. Users can receive warnings about data quality at the column level.
- Flexible Connectivity: With the latest update, users can choose to use either a live or extract connection for each table within a virtual connection. This allows them to refresh the data as needed to suit their needs.
Are you as excited as we are about these amazing new features? If so, be sure to get started with Tableau 2023.1 today!
About Beinex+ Tableau Partnership
As a quick, versatile, and easy-to-use self-service platform tailored to your organisational needs, Tableau streamlines the power of data. It enables users to make decisions more quickly and with greater confidence from anywhere, anytime.
As a premium partner, Beinex offers the best of Tableau services to grow your business. Our partnership with Tableau has unveiled several seamless possibilities for businesses. Tableau, with its user-friendliness, makes Data Analysis and Visualization an enjoyable, interesting and rewarding process.