IMAGE IN BAR CHART – NEW LEVELS OF TABLEAU VISUALIZATION!
The following blog depicts the technique created by Alex Jones (@jusdespommes) blog about “How to… create a chart from an image in Tableau!”.
Show/Hide Containers
Tableau 2019.2 has introduced an option to show/hide containers (when the container is a floating type). Many experts have come up with different use cases such as hiding and showing the filters, parameters, or even a worksheet with a click which occupies much space in the dashboard using this feature.
This feature is pretty simple to use and comes in handy when we want to save some space in our dashboards.
How to Swap image in Bar Chart?
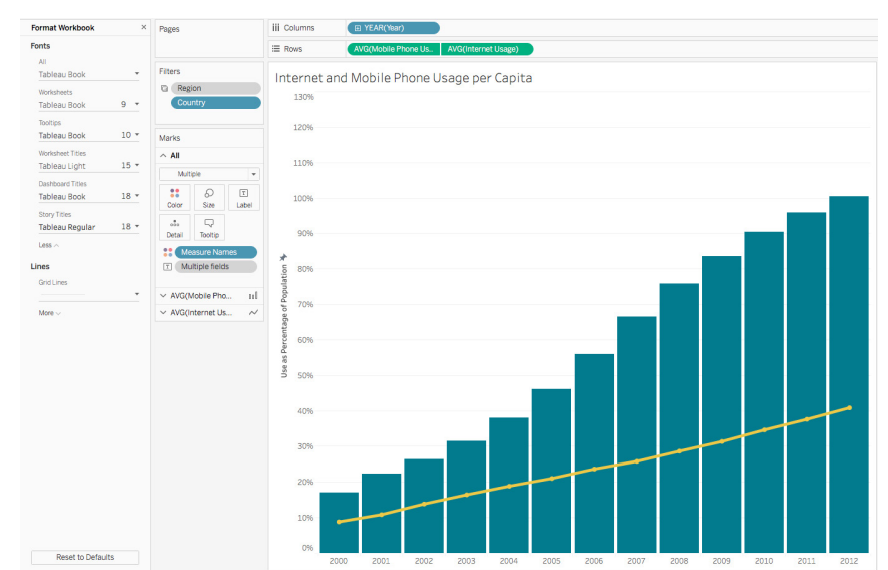
1.Create a simple bar chart in Tableau 2019.2. We have used “Top 5 Grossing Games Worldwide 2018” to create a bar chart and sorted based on the revenue.
2.Remove the label, header and export the worksheet to image. Worksheet > Export > Image (Choose ‘view’ in Export Image dialog box)
3. Open Photopea, which is an online photo editor and open the saved worksheet image.
File > Open > Image
4. Now, download 2 images from online which we are going to use for bar chart.
5.Copy and paste image 1 on top of the bar image. Now we will be having two layers of images one above another.
(We can even re-position, crop the image if needed)
6.Choose ‘Magic Wand’ from the tool bar at left side. Click on the image, and we can see the selection in dotted lines.
7.Choose the top layer (image 1) and click delete. Now we can able to get the below image.
8.The background of the image needs to transparent. So, delete the below layer (bar chart image) using delete icon at the bottom right corner.
9.Now, choose File > Export as > .PNG to save the image as .png format (this will retain the transparent layer)
10.Repeat the same steps with image 2 to get the same effect.
Note: Keep the same resolution and image size as the previous one.
10.1.Now, open Tableau Desktop and bring in the image as floating type.
11.We have to position the bar chart over the image. To make it easy, decrease the opacity of the bar chart and give border.
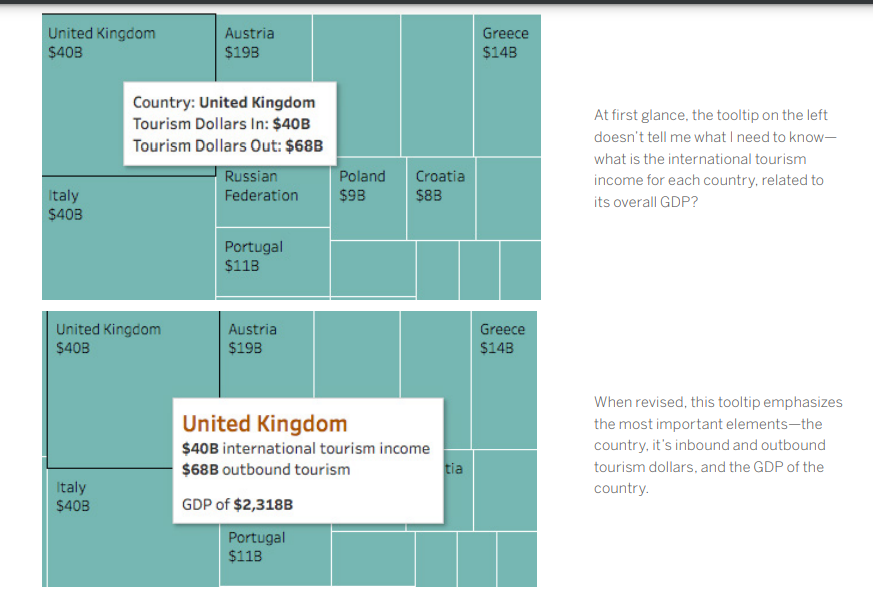
12. Add labels and tooltip to the bar chart.
13.Now the dashboard looks like this. We can able to hover on bars to see tooltip.
14.Now, comes the trick of using ‘Show/Hide Containers’ to swap image. Bring a container to floating and add image 2 to the container. (Set the padding to zero)
15.Next, we have to position the both images and the bar chart one above another. To make it easy, use x, y axes and size w, h to position accurately.
Note: Make sure the position of the 3 objects (Use Floating Order) follows the below order as all are in floating.
- Image 1 (Below layer)
- Image 2 inside container (Middle layer – where show/hide option is to be used)
- Bar Chart (Top layer)
16.Choose the container and right click at the top right corner. Enable ‘Add Show/ Hide Button.’ Now we can see a floating button.
17.We can customize the button by adding image and tooltip to buttons.
18.We have used below customized images (created with PowerPoint) for buttons to swap between 2 images.
19.Another simple trick is that we can control the transparency of the image by adjusting the opacity of the bars.
20.Take a look at the final dashboard….
Related Articles

In the evening, we had a wild-theme based gala party, and all got dressed up in sync with the theme, ‘Just Go Wild’. It was fun to watch everyone from the Manager to the employees dressed up in the same theme. We had an exhilarating DJ party manned by Darryl Gaulbert which made us all shake a leg to the tune. We danced and roared to the music. It was indeed wild!
The following day after breakfast, we met our founder Indumon Das, who had a chat with us regarding the journey of Beinex and his vision. It inspired us all to have a dream and pursue it fearlessly. Some of us accessed the infinity pool late afternoon and had great fun swimming and playing pool ball.
It was a blissful evening based on an ethnic wear theme. We competed for the best ethnic outfit of the evening. The different hues and styles made the evening stunning. Everyone flaunted the traditional wear in style. We had a musical evening with a live barbeque and a sumptuous dinner.
Finally, the day of leaving Munnar dawned; March 19. We all had breakfast in the morning and packed our backpacks. Most of us were pretty reluctant to leave Munnar as we were not ready to lose the bond we created together. Nonetheless, we vowed to stay connected. We boarded the buses around 10 AM and waved goodbye to Munnar.
When we reached Edapally in the evening, a surprise goody bag was waiting. It was an impressive and admirable gesture from our firm. Beinex has a culture of nurturing growth and spreading positivity, and employees’ comfort is the priority here.
Yes, we had a fantastic time together. After this retreat, our rejuvenated and motivated minds are ready to bounce back to work with enhanced spirit. We are looking forward to more team building sessions in the future to meet each other more often.
One of the highlights of Alteryx is Data Connections. It can be relied upon to generate and handle your data connections from a central location. The user can access it using their username and password.
The main advantages of Alteryx that set it apart :
- • data connectivity is high
- • direct access to the data sources/ bases
With the help of the Manage Data Connections window, it is possible to:
- • view connections you have already created
- • view connections shared with you
- • add new connections.
3 Steps to Create and Manage Your Data Connections with Alteryx
- Adding
- Testing
- Sharing
1. To Add a Data Connection
If the user wants to add a data connection, select Add New Data Connection on the Data Connections page. Then from the Connection drop-down select the connection type.
2. Testing Data Connections
The second step is to test the data connections. A controller and two or more worker machines make up a multi-node setup of the Server. With this arrangement, the test functionality examines the connection on the controller machine rather than the individual worker computers. One should verify the identical database drivers and driver versions are installed on every system to make sure the connection will function on any of them. Connection Test FailuresThe connection tests can fail due to multiple reasons. The user can save data connections even though they have failed the connection test.
These are the most typical causes of connection tests failing:
- • The server and database can be inaccessible to you in some circumstances. For instance, only the connection end user can access the server or database in certain cases.
- • Your ability to connect to the server or database may also be blocked by network security.
- • Sometimes the server is unable to connect to the host of the database server. At that time ping the database server host while logged into the server where Server is installed to check for network connectivity. The credentials for the database are incorrect or do not have the necessary access permissions. Get in touch with the database manager.
- • The database is unavailable. To ensure that the database is operational and performing as expected, get in touch with the database administrator.
- • The Server configuration you are using has several nodes.
3. To Share a Data Connection
After creating a Data Connection, go back to the Data Connections page to share it with users or custom groups for use in Designer.Note: Keep in mind that you must connect with a Curator or the gallery administrator to make sure that they have access to the necessary data connections if you want to allow the workflow to be used by particular users or groups.
Follow the steps mentioned below to share a Data Connection:
- • Choose the shareable data connection by clicking the pencil icon on the Data Connections screen.
- • Select Users or Custom Groups on the Modify Data Connections screen.
- • Enter a user's or a group's name here.
- • Choose the user or the group.
Note: Verify that the user's machine is installed with the same or a more recent version of the Microsoft SQL Server Native Client before initiating a Microsoft SQL Server connection. Go over to Troubleshooting.
a. Cancelling Access to a Data Connection
Choose the "x" icon next to a user's name to remove their access to a connection.
b. Modify a Data Connection
- 1. Choose the pencil icon on the Data Connections page.
- 2. Alter the Name or Connection String fields on the Modify Data Connections screen.
- 3. You can share the connection with people and groups using the Users or Custom Groups pages.
- 4. Choose Save.
1. Choose the trash can icon next to the connection name to remove the connection.
Tools in Alteryx Designer
Let’s have a look at the input tools available in Alteryx Designer:1. Input Data Tool
By connecting the Input Data tool to a file or database, you can utilise it to add data to your workflow. This tool has a wide range of configuration possibilities.2. Directory Tool

The Directory tool can be used to return a list of all the files present in the given directory. The tool returns file names along with additional details about each file, including file size, creation, and modification dates, and more.
3. Dynamic Input Tool

Using the Dynamic Input tool, it is possible to change file names, amend database queries, or alter input pathways that were created using data from your workflow are all possible If you're reading from a database, Alteryx will do it at runtime and will dynamically select which entries are read.
4. Connect In-DB Tool

When compared to conventional analysis techniques, the Connect In-Database tool can significantly enhance performance by allowing blending and analysis on large data sets without removing the data from the database.

1. Adjust the data sample size
- a. Boost the size of your data sample: Adjust the sample's row count by returning to the input stage. You can add more rows or include all the data but remember that doing so might make the performance slower. Another word of caution is that utilising a specified number of rows will only return the fastest method the underlying database can find to replace the given rows.
- b. Take random sampling: Tableau Prep automatically chooses the optimal number of rows to return based on the total number of fields in the collection and the data types of those columns. The database level random sampling occurs and returns the specified number of rows. The database returns a sample after inspecting each entry. Not all data sources provide this option, which could also affect performance.
- c. Add a step filter at the input stage: You may ensure that the information pulled into your data set is pertinent to your research by including a filter at the input stage. This improves performance while providing you with a more representative sample.
2.Evaluate the data
You'll probably want to start by counting the number of distinct values in each field. A simple check at the column header at the top reveals how many states are represented in the data set. You'll also want to understand how various values connect to identify data outliers or problems. You can utilise highlighting in Tableau Prep to find correlations between different fields. The data grid view is condensed to only display the records with the selected value in the chosen field when you click on a value in the profile pane. Tableau Prep highlights the corresponding values in blue, and the values span areas.
3.Filter the data
Limit the fields you import into Tableau Prep to those you'll need for your analysis to maximise the overall effectiveness of your data preparation process. By filtering your data, you can verify that you're performing the proper analysis while saving time. For instance, if you need to look at sales data from the previous two years, you may use the range or relative date filters to limit the date field to that period. You might want to eliminate any incorrect or irrelevant data. A value in the data pane can be excluded with a single click. You can do this at any time during your flow.
4.Assess and tidy up the data
Tableau's data types will have an impact on your analysis. Therefore, it's critical to correctly identify each field before beginning. Even though Tableau allows you to update aliases, alter data types, split lots, and create calculations, it is far simpler to carry out these tasks beforehand, particularly when preparing the data set for someone else. Tableau Prep includes built-in capabilities to aggregate and replace recurring characters or pronunciation, saving you from having to edit each one individually so that you don't have to; these solutions use algorithms to make cleaning easier. Or, if you foresee a missing value, you may manually add it so that it will be included when the flow processes the complete data set. You can apply a computation if you know that a field must be cleaned or filtered, but it takes more than the user interface offers.
5.Understand the data results
Deciding about the final data set's appearance while you begin to prepare your data can be difficult. For Tableau to effectively analyse your data, you might need to merge numerous data sources or pivot your data from columns to rows.
One technique to get beyond this obstacle is visualising the data pane in Tableau Desktop as to how it should appear. Do you have columns with the same value in several places? Should each product be in a single field with the sales transactions stated below, or should each product have its column with the sales transactions listed underneath? The latter is more likely, and a pivot is necessary for this situation.
You will be joining the data if you need to combine two tables. By using a join, you can increase the number of fields in your data source that you can investigate. Although a join can be added at any point during the data preparation process, the sooner you use it, the sooner you will comprehend the data set and identify areas that require immediate attention.
Like appending two data sets together, a union enables you to do so. For instance, you might have an Excel file where each sheet displays transactions from different years. You may maintain the same structure with extra rows by using a union rather than joining the tables.
After your data has been organised, processed, and filtered, it's time to interpret what it is trying to tell you. Tableau Prep connects with your entire business intelligence platform like many other data preparation products. To allow others to begin their analysis, publish the extract to Tableau Server or Tableau Cloud. Bring it into Tableau Desktop to start posing and investigating more in-depth queries. The hardest part of the data analysis process is now complete. It's time to share the breakthroughs that resulted from your hard work.
Dubai AI Seal, the first-of-its-kind initiative, was launched under the directives of His Highness Sheikh Hamdan bin Mohammed bin Rashid Al Maktoum. Awarded by the Dubai Centre for Artificial Intelligence (DCAI), this AI Seal cements Beinex’s status as a trusted partner in AI solutions. It underscores our commitment to driving transformative impact across government and private industry throughout Dubai and beyond.
Beinex: Your Trusted AI Partner
Beinex stands out as a trusted partner for government and private-sector organizations, driving future-ready AI solutions that align with Dubai’s strategic vision for AI leadership.
• Validation of Excellence: This Seal affirms Beinex’s AI governance, data security practices, and solution quality robustness.
• Expanded Collaboration: Government and private-sector entities can confidently engage with Beinex, knowing we meet Dubai’s exacting standards.
• Visibility & Credibility: The seal's display highlights Beinex’s alignment with Dubai’s strategic vision for AI and further distinguishes us in a competitive market.
Connect With Us to Kickstart Your AI Journey
Dubai AI Seal: A Vision Driving Responsible AI Innovation in the Emirates
Launched in January 2025 as part of the Dubai Universal Blueprint for AI, the Dubai AI Seal is a pioneering accreditation designed to:
• Promote trust in AI service providers through a rigorous evaluation framework
• Strengthen partnerships between government bodies and certified technology companies
• Reinforce Dubai’s leadership in ethical, secure, and high-impact AI deployment
Companies licensed in Dubai offering AI-related products or services undergo a detailed assessment covering their AI activities, team expertise, ongoing and upcoming projects, and collaboration track record. Successful applicants receive a unique serial number and tier classification, granting them the right to display the Seal across digital platforms and promotional materials.
Beinex: Heralding AI Excellence and Innovation across the Middle East
At Beinex, we help businesses achieve full potential through our bespoke solutions in Advanced Analytics, AI/ML/RPA, Risk and Audit Analytics, Digital Twin, Generative AI, Competitive Intelligence, Data Governance, Business Intelligence, Cloud Engineering, Modern Cloud Analytics, Alteryx APA, and Tableau. As a trusted AI partner, we spearhead transformation across healthcare, finance, IT, HR, education, oil & gas, and more. Our clientele includes government bodies and private enterprises, and we drive real impact efficiently, effectively, and at scale. Beinex has also been recognized by Consultancy-ME as one of the Top Consulting Firms in the Middle East for 2024. We’ve earned top-tier rankings in Business Intelligence, Data Science, and Cloud Services, underscoring our excellence across critical service domains. In addition, Beinex has secured leading positions in the Government, Oil & Gas, Public Sector, Technology, and Banking industries. These prestigious accolades reflect our unwavering commitment to delivering innovative, high-impact solutions that drive success across diverse sectors. Looking Ahead As Dubai accelerates its AI ambitions, Beinex remains committed to pioneering responsible innovation that enhances quality of life and drives sustainable growth. We look forward to leveraging this recognition to deepen our impact, delivering state-of-the-art AI solutions that empower organizations to meet tomorrow’s challenges today.
The Need for Automating Compliance
As business environments today are rapidly changing and highly regulated, it is important to automate compliance to boost accuracy, efficiency, and scalability. The following aspects emphasize why automating compliance is highly significant. • Amplifies security by complying with data privacy and safety regulations. • Saving time and effort by automating recurring tasks like monitoring, reporting, and audits. • Deploying the required infrastructure faster and in a standardized format. • Boosting accuracy by reducing the risks of human error and consistently adhering to industry standards.
What is an AWS Systems Manager?
A unified management system, an AWS Systems Manager, streamlines infrastructure management by improving visibility and giving you control over your AWS infrastructure. It delivers a suite of tools for managing configurations, automating repetitive tasks, patching systems, maintaining consistent configurations, and securely managing secrets and configurations. The primary features of AWS Systems Manager associated with compliance are: • Compliance Dashboards: They offer a centralized visualization of your compliance status, emphasizing resources that are non-compliant to facilitate faster remediation. • Patch Manager: It automates the deployment and monitoring of patches across your instances. • State Manager: It ensures that your systems are configured to a specific desired state.
Compliance Made Effortless: Automation with AWS Systems Manager
A comprehensive management service, AWS Systems Manager, allows you to automatically accumulate and aggregate data from your AWS resources. It provides a unified view of your AWS environment, making managing and monitoring your resources easier. Compliance, an AWS Systems Manager capability, enables the scanning for inconsistencies in compliance and configuration and offers real-time compliance insights. This capability facilitates drilling down into certain non-compliant resources from the data aggregated from multiple AWS accounts. The additional features and benefits Compliance provides are as follows: • Utilizing AWS Config to see compliance history and monitor changes. • Exporting data to Amazon Athena and Amazon QuickSight to generate organization-wise reports. • Using Amazon EventBridge, State Manager or Run Command to fix issues. • Customizing compliance to develop compliance types to fit your business needs. • Employing AWS Systems Manager for seamless integration of third-party compliance tools and automation of configuration management and vulnerability scanning. AWS Systems Manager facilitates the automation of intricate and recurring tasks associated with configuration, patching, and software installation. It allows businesses to run these tasks across systems simultaneously while minimizing the time needed to effect the changes and ensuring consistency in the process. This execution enables software compliance, including maintaining antivirus definitions up to date, implementing firewall policies, and setting patch baselines. The automation capability of AWS Systems Manager entails streamlining the deployment, maintenance, and remediations of AWS services like Amazon EC2, Amazon S3, and more.