How AI Decision-Making is Improving Enterprise Outcomes
Blog
Share 
How to Automate and Improve Your Data Governance Processes for Better Results
 17 February 2025
  Sumi S
 What is Data Governance?
Data governance is the process of managing the availability, usability, integrity, and security of data in an enterprise system. It establishes policies, procedures, and standards for how data is collected, stored, used, and shared. It's about ensuring the right data is available to the right people at the right time, in a secure and compliant manner.Why Automate Data Governance?
Automating data governance processes brings several benefits, including: • Improved Data Quality: Automation can identify and correct data errors, inconsistencies, and duplicates, leading to improved data quality and more reliable insights. • Increased Efficiency: Automation streamlines data governance processes, reducing manual effort, freeing up valuable time, and accelerating decision-making. • Reduced Costs: Automation helps reduce the costs associated with manual data governance processes, minimizing errors and the need for rework. • Enhanced Compliance: Automation helps ensure compliance with data privacy regulations, such as GDPR, CCPA, and HIPAA, minimizing risk and potential penalties. • Better Decision-Making: By improving data quality and accessibility, automation enables better, more data-driven decision-making. • Scalability: Manual processes struggle to keep up with growing data volumes. Automation allows your governance framework to scale effectively.How to Automate Data Governance Processes?
Several approaches exist for automating data governance, and often a combination is most effective: • Data Discovery and Classification: Automated tools, like data catalogs, can help discover and classify data based on its content, sensitivity, and other criteria. This is the foundation for understanding your data landscape. • Data Quality Monitoring: Automated tools can continuously monitor data quality, identify potential issues, and trigger alerts for remediation. • Data Lineage Tracking: Automated tools can track the origin and movement of data, providing a clear audit trail and helping to ensure data quality and compliance. This is crucial for understanding how data is transformed and used. • Data Access Control: Automated tools can enforce data access policies, ensuring that only authorized users can access sensitive data, protecting privacy and security. • Data Masking and Anonymization: Automated tools can mask or anonymize sensitive data to protect privacy while still allowing for data analysis and testing. • Metadata Management: Automated tools can capture and manage metadata, providing context and meaning to data assets, making them easier to find and understand.The Role of Data Catalogs like Alation
Data catalogs play a critical role in automating data governance. They act as a central inventory of all data assets, providing a single source of truth about your data. Modern data catalogs like Alation offer: • Automated Data Discovery and Profiling: Automatically scan and profile data sources to identify and catalog data assets. • Data Lineage: Visually map the journey of data from its origin to its consumption, showing transformations and dependencies. • Data Quality Rules and Monitoring: Define and enforce data quality rules and automatically monitor data for compliance. • Collaboration and Knowledge Sharing: Enable data users to collaborate, share knowledge about data assets, and contribute to data governance efforts. • Search and Discovery: Empower users to easily find the data they need, along with relevant metadata and context.Best Practices for Automating Data Governance
• Develop a Data Governance Strategy: Before automating, define clear goals, objectives, and metrics for your data governance program. • Identify Key Stakeholders: Engage business users, IT, compliance, and other stakeholders to ensure alignment and buy-in. • Choose the Right Tools: Select tools that meet your specific needs and integrate with your existing data infrastructure. Consider a platform approach that can address multiple aspects of governance. • Implement a Phased Approach: Start with a pilot project to demonstrate value and refine your approach before scaling to the entire organization. • Focus on Data Literacy: Train your employees on data governance policies, procedures, and the use of automated tools. • Monitor and Evaluate: Continuously monitor the effectiveness of your automated data governance processes and make adjustments as needed.How to Embrace Better Data Governance?
Data governance doesn’t have to be a bottleneck. Organizations can reduce manual workloads, improve compliance, and drive innovation by adopting automation and leveraging tools like data catalogs. Ready to transform your data governance strategy? Get a Free Assessment Now!Organizations are increasingly relying on data these days to make informed decisions, improve customer experiences, and drive innovation. However, with the ever-growing volume and complexity of data, it has become crucial to establish effective data governance processes to ensure data quality, compliance, and security. Manual processes simply can't scale, making automation a necessity.
Related Articles

Top 10 Game-Changing Benefits of Generative AI for Your Business
What is Generative AI
Generative AI is a subfield of Artificial Intelligence that utilizes patterns found in vast databases to produce original content, including text, images, music, and videos. GenAI aims to provide creative and human-like outputs, in contrast to classical AI, which primarily makes predictions or classifies data. Generative AI models, such as OpenAI's ChatGPT and DALL-E, utilize sophisticated neural networks, specifically transformer architecture, to produce content that is logical and sensitive.
Industries are transforming with the help of generative AI, and its benefits are innumerable. Marketers are using it to automate campaigns and generate personalized content at scale, while writers and creators rely on it to spark ideas and accelerate production. In healthcare, it's being explored for diagnostics, treatment planning, and medical research. At its core, Generative AI isn't just a tool; it's a transformative force reshaping how we create, innovate, and solve complex problems across sectors.
GenAI Solutions in the UAE
The Generative AI market in the UAE is on an impressive growth trajectory. Currently, the market is estimated to have reached USD 220 million and is expected to surpass USD 1.3 billion by 2030, growing at a CAGR of over 35%. With the UAE's commitment to becoming an AI-driven economy, including initiatives such as the UAE National AI Strategy 2031, the region is emerging as a hub for AI adoption and innovation.
Top 10 Benefits of Generative AI
Generative AI is reshaping how businesses create, operate, and innovate. Here are the top ten key benefits of GenAI that you can leverage for your business:
1. Automates Content Creation
Generative AI tools streamline content development, including blog posts, ad copy, social media content, and other types of content. Marketing teams use AI to generate drafts, brainstorm ideas, and iterate quickly. It speeds up production, improves quality through iterative feedback, and reduces the need for hiring additional staff. GenAI tools can craft landing page content or email campaigns that effectively highlight your brand's voice.
2. Delivers Hyper-Personalized Experiences
AI leverages customer and product data to generate personalized recommendations and messaging. In e-commerce, this can mean showing the right product to the right user at the right time. Personalized AI outputs enhance engagement and conversion rates.
To ensure ethical outcomes, businesses are auditing training datasets to prevent bias, which is particularly crucial in sensitive sectors such as healthcare, finance, and hiring.
3. Enhances Product Design and Innovation
AI models analyze market trends and customer behavior to guide product development. By processing vast datasets, they uncover unmet needs and help generate concepts that align with evolving consumer preferences. Many GenAI tools aid in rapid prototyping and idea testing.
4. Strengthens Cybersecurity
Generative AI boosts threat detection by identifying anomalies in network traffic and alerting teams in real time. It excels at identifying phishing patterns, malware signatures, and unusual behaviors more quickly than manual reviews. As attackers also begin using AI, this defense becomes increasingly critical.
5. Accelerates Healthcare Research
Generative AI is expediting drug discovery and diagnostics. AI also allows the generation of synthetic patient data, facilitating preclinical testing without privacy risks. It shortens development timelines and supports personalized medicine by analyzing genetic and clinical datasets. It can also predict diseases before they strike us.
Read Our AI in Healthcare Case Study on Cardiovascular Disease Prevention!
6. Streamlines Business Processes
AI automates repetitive tasks such as summarizing reports, drafting emails, or analyzing PDFs. GenAI Tools allow teams to focus on strategic work rather than data wrangling. For example, HR teams can auto-generate job descriptions, and sales teams can craft personalized follow-up emails using AI.
Book a Free Demo of Our Document Chatbot
7. Improves Customer Support
Generative AI chatbots offer 24/7 support, providing context-aware responses to resolve queries. Unlike traditional bots, these systems adapt in real time, understand tone, and escalate issues when necessary. Businesses utilize various tools to achieve faster resolution times and higher satisfaction scores.
8. Accelerates Market Innovation
By analyzing market signals, customer behavior, and industry shifts, AI uncovers opportunities for product, service, or business model innovation. It reduces risk and helps companies make data-backed decisions about where to invest. AI can forecast trends and simulate outcomes before committing resources, allowing for informed decision-making.
9. Drives Digital Transformation
AI encourages traditional industries, like oil & gas, construction, logistics, and agriculture, to adopt technology by demonstrating clear ROI. Predictive maintenance, supply chain optimization, and workflow automation are just a few areas where AI proves valuable. It helps leaders make faster, more informed decisions, accelerating digital adoption.
10. Accelerates Creative Innovation
Generative AI serves as a brainstorming partner. Designers utilize tools like Midjourney for rapid visual prototyping, while writers and product teams employ chatbots to refine their ideas. These tools provide novel starting points, enabling creators to break through mental blocks and explore new directions more quickly.
Summing Up
Beinex GenAI Solutions is at the forefront of transformation, helping organizations in the UAE explore the full potential of generative AI. As one of the recipients of the Dubai AI seal, Beinex is enabling businesses to innovate faster and operate smarter, from automating content generation to creating intelligent decision-making systems. Businesses that adopt it strategically are gaining a competitive edge, not just by saving time, but by reimagining what's possible.

Best Cloud Data Management Tools Fit for Businesses of All Sizes
What is Cloud Data Management?
Cloud data management refers to the framework that allows businesses to store, manage, and access their data using cloud-based services and applications. It encompasses the entire data lifecycle, from collection and storage to processing and analysis, while ensuring that data remains secure and compliant with regulatory standards. The flexibility of cloud data management allows organizations to scale up or down based on their needs and optimize data operations, which in turn leads to better decision-making and actionable business insights.
The Importance and Benefits of Cloud Data Management
Cloud data management has become a necessity in the data-centric world. Organizations are immersed with vast amounts of data, which must be efficiently stored, processed, and analyzed. Here are the key benefits:
- Scalability and Flexibility: One of the biggest advantages of cloud data management is its ability to scale as needed. Traditional data management systems often require substantial infrastructure investment, but cloud solutions allow businesses to pay only for the resources they use, making it cost-effective.
- Enhanced Data Security: With stricter regulations on data privacy (such as GDPR and HIPAA), cloud data management ensures that data is securely stored and compliant with global standards. Cloud service providers offer tools to protect data from unauthorized access and breaches.
- Improved Collaboration and Accessibility: Cloud data management allows users to access data from anywhere at any time, enabling remote work and collaboration across geographically dispersed teams.
- Disaster Recovery and Business Continuity: Cloud-based data management systems offer advanced disaster recovery options. By replicating data across multiple locations, organizations can ensure that their data is safe and accessible, even in the event of hardware failure or a catastrophe.
Cloud Data Management vs. Traditional Data Management
In contrast to traditional on-premises data management (TDM), cloud data management (CDM) provides enhanced flexibility and scalability. Traditional data management systems require a significant upfront investment in physical servers, storage, and IT staff, whereas CDM enables rapid scaling with minimal financial and physical overhead.
CDM also offers superior disaster recovery by distributing data across multiple locations, a benefit that is difficult to achieve with TDM’s centralized approach. Furthermore, CDM allows team members to access data remotely, enhancing collaboration—something that traditional systems often struggle to provide.
A Hybrid Approach to Data Management
For businesses looking to maintain control over sensitive data while leveraging cloud-based tools, a hybrid approach to data management combines the strengths of both cloud and traditional systems. A hybrid model allows organizations to store sensitive data on-premise while utilizing cloud resources for dynamic, less sensitive data. This approach offers scalability, cost-efficiency, and disaster recovery while keeping critical data secure and compliant with industry regulations.
Top Cloud Data Management Tools
Several leading cloud data management tools dominate the market, offering comprehensive solutions for businesses with various data needs. Here are the top three tools:
1. Amazon Web Services (AWS)
Amazon Web Services offers an extensive range of cloud-based tools and services that allow businesses to manage their data effectively. Notable AWS services include:
• Amazon S3: A scalable storage service designed for temporary and intermediate data storage.
• Amazon S3 Glacier: A low-cost cloud storage service ideal for long-term data archiving.
• Amazon Redshift: A fully managed data warehouse that makes analyzing large datasets using SQL simple.
• Amazon Athena: An interactive query service that allows users to analyze data in Amazon S3 using SQL.
• Amazon QuickSight: A scalable, serverless business intelligence service for building interactive dashboards.
AWS Pricing: AWS follows a pay-as-you-go pricing model, making it highly flexible for businesses of all sizes.
2. Microsoft Azure
Microsoft Azure provides a wide range of cloud-based tools for data management, making it a popular choice for enterprises. Key Azure services include:
• Azure Blob Storage: A massively scalable object storage solution for unstructured data.
• SQL Databases: Managed SQL database services that simplify data management without the need for complex infrastructure.
• Azure Data Explorer: A real-time data analytics service that can handle large datasets with minimal preprocessing.
• Private Cloud Deployments: For businesses looking for more control over their infrastructure.
Azure Pricing: Like AWS, Microsoft Azure also offers flexible pricing based on the services and resources used.
3. Google Cloud Platform (GCP)
Google Cloud Platform offers a range of cloud-based data management services, known for their strong integration with Google’s ecosystem and ease of use. Prominent services include:
• Google Cloud Storage: A fully managed service for storing unstructured data.
• Google BigQuery: A fully managed data warehouse that allows users to run SQL queries on large datasets.
• Cloud BigTable: A NoSQL database service designed for large-scale workloads.
• Google Data Studio: A business intelligence platform for building intuitive dashboards and visualizing data.
• Cloud Datalab: A powerful tool for machine learning and data science projects.
• Cloud Pub/Sub: A messaging service designed for real-time data ingestion and processing.
GCP Pricing: Google Cloud Platform offers competitive pricing with a flexible pay-as-you-go model that caters to various business needs.
Conclusion
Cloud data management is essential for modern businesses looking to stay competitive in the digital era. By offering scalability, enhanced security, improved collaboration, and disaster recovery, cloud data management tools like AWS, Microsoft Azure, and Google Cloud Platform provide a comprehensive solution to managing data efficiently and effectively. As data grows in volume and complexity, leveraging these tools will be key to driving innovation and maintaining a competitive edge.
Don’t Miss Out on These 6 New Features of Tableau 2023.2
List of Key Features in Tableau 2023.2
- Enhanced Multi-row calculations in Tableau Prep
- Line Patterns
- Personal Access Token Admin Control
- Editable Viz Alt Text
- Salesforce Data Cloud Connector
- Effortless Tracking of Known Issues
1. Enhanced Multi-row calculations in Tableau Prep
Gone are the days of complex formulas and tedious coding. With just a few clicks, Tableau Prep empowers you to perform multiple-row calculations, making your data preparation process a breeze. Calculate the difference from, percent difference from, or even execute moving calculations effortlessly without breaking a sweat.
Tableau Prep's enhanced calculation capabilities are like a magic wand in your hands, eliminating the need for intricate calculations or diving into complicated code. You're now equipped with the tools to effortlessly transform your raw data into actionable insights, paving the way for smarter decision-making and unlocking the true potential of your analytics journey.
Get ready to unleash the full potential of your data with LOOKUP calculations. Seamlessly compose complex expressions that enable you to access and analyse data across multiple rows, empowering you to unveil hidden insights and patterns.
2. Introducing Line Patterns
The next game-changing feature in Tableau 2023.2 is Line Patterns. This exciting addition provides a whole new level of flexibility and customisation when it comes to creating visually stunning data visualisations.
With Line Patterns, you now have the power to choose from a variety of line styles, including solid, dashed, or dotted lines. These patterns allow you to effortlessly highlight specific areas of interest within your visualisations, making it easier than ever to convey complex information with clarity and impact.
Imagine comparing actual data against modelled values with striking visual cues or effortlessly differentiating lines in dynamic or crowded visualisations. Line Patterns give you the ability to create eye-catching visuals that captivate your audience and make your data come to life. No longer will you be limited to static, monotonous lines. Line Patterns empower you to add a touch of creativity and personalisation to your visualisations.
3. Personal Access Token Admin Control
Gone are the days of compromising on security compliance. With this latest release, Site Admins are granted an array of tools to manage PAT creation privileges, tailor their validity periods to organisational needs, and wield their data protection prowess like never before. You hold the keys From a single dashboard to determine who can create PATs and fine-tune their lifespans, ranging from a day to a full year.
But the excitement doesn't stop there! We've taken proactive security measures to the next level. For Tableau Cloud sites created after version 2023.2, PATs come disabled by default, providing an additional layer of protection. Moreover, we've listened to your feedback, and the default expiration period has been thoughtfully shortened to 180 days, aligning with best practices and ensuring optimal data security.
4. Editable Viz Alt Text
With the latest feature, content authors have the power to edit the automatically generated alt text, opening the doors to endless possibilities. Whether through the Data Guide panel or the Accessibility option in the Worksheet drop-down menu, you can now add up to 2,500 characters of detailed alt text to craft captivating descriptions that bring your visualisations to life. Step into a realm of creativity and inclusivity, ensuring that everyone can fully comprehend and appreciate the story behind your data.
5. Salesforce Data Cloud Connector
With Tableau's enhanced Salesforce Data Cloud connector, say goodbye to complex installations as this driverless connector effortlessly connects your data sources. Use Data Spaces, where you can create customised visualisations tailored to specific contexts, organising metadata, data, and processes to empower stakeholders. Enjoy a user-friendly interface that replaces object API names with object labels, making table selection a breeze. With support for 11 additional functions, including datetime capabilities, supercharge your content creation and data analysis processes.
6. Effortless Tracking of Known Issues
We've streamlined the process of tracking known issues, making it effortless to stay in the loop. Discover the centralised Known Issues page, where you can effortlessly monitor the status of experiences, from working as expected to be in review, in progress, scheduled, or deployed. With intuitive drop-down filters, you can easily navigate through Tableau components and subscribe to specific issues for automatic email updates.
Additionally, our revamped Tableau Help now includes comprehensive "Release Notes" documentation, offering insights into new features and updates across Tableau Cloud, Tableau Server, Tableau Desktop, and Tableau Prep. Stay informed, empowered, and ahead of the curve with our enhanced status tracking and knowledge resources.
Upgrade to Tableau 2023.2
The release of Tableau 2023.2 brings a host of exciting features and enhancements that empower users to unlock the full potential of their data. With each release, Tableau continues to evolve and revolutionise the data analytics landscape, empowering users to discover insights, tell compelling stories, and easily make data-driven decisions. Upgrade to Tableau 2023.2 and embark on a data exploration and innovation journey like never before.
If you are interested in learning more about earlier versions of Tableau, click the links below:
Tableau New Features Unveiled: Tableau 2023.1 Release
Tableau Version 2021.4: Bringing Automation to Data Management
How Beinex Can Assist You
Beinex, a premier Tableau partner, provide sustainable analytics solutions to organisations and help to build superior data visual analytics capabilities internally through our bespoke training programs. Our team of Tableau-certified consultants are real-life Tableau business users who are passionate about Tableau and delivering a world-class experience. Connect with us for a Tableau free trial.

Data Sharing Best Practices in Snowflake
Snowflake Data Sharing
Data sharing in Snowflake equips you to share specific objects with another Snowflake account or a designated reader account. The beauty of this process lies in the fact that the data isn't duplicated or moved between accounts.
Now, why is this a game-changer for organisations? When constructing data pipelines and developing data products, it's a common practice to shuttle data between databases and diverse systems to blend different datasets.
Consider this scenario: You have transactional data within your online transactional processing (OLTP) database, and you wish to integrate it with external data for a machine learning model. Traditionally, organizations would export data into a data lake, import external data, and then employ tools like Apache Spark for analysis.
But what if, instead, you could simply deposit your data into Snowflake, and the external data source could seamlessly share its data with your organisation, eliminating the need to load it separately? This eradicates the challenge of keeping data copies synchronised, resulting in savings on storage, computing costs, and maintenance efforts.
Imagine your company possesses valuable information that can guide other companies in making informed decisions. For instance, let's say your company can provide precise estimates for product delivery times based on proprietary data, and you want to offer this information for sale to your customers.
Enter Snowflake data sharing—it empowers you to precisely do that.
Case Studies: Snowflake Data Sharing
Citing two instances where leading organisations use Snowflake to improve actionable data sharing, collaboration and reporting capabilities.
1. A Pioneering Technology Leader
A well-known Swedish-Swiss multinational corporation successfully implemented a streamlined data strategy using the Snowflake Data Cloud, adopting an "extract once, use everywhere" approach that simplified data consolidation and enablement. By transitioning from nightly extracts, which caused significant system overhead, to a single, near real-time Change Data Capture (CDC) process, the company achieved efficient replication of information to Snowflake with minimal impact. The utilisation of Snowflake Secure Data Sharing facilitated secure and governed data collaboration across the four business areas.
2. A Leading fast-food Restaurant Chain
Snowflake's data-sharing capabilities have revolutionised decision-making for a fast-food restaurant chain. They can effortlessly share crucial sales, inventory, and operational data with external entities, expanding from three to over 30 parties.
With a high-performance database platform hosting over 2 million transaction records, the restaurant chain has established a robust data management and analysis infrastructure through Snowflake, empowering its operational and marketing endeavours.
Moreover, by consolidating all data onto Snowflake, the organisation has achieved a remarkable 70% reduction in operational IT costs, demonstrating the platform's efficiency and cost-effectiveness.
Centralising and sharing data with Snowflake significantly eased the development of data products for various purposes, including marketing campaign analytics, quotation success metrics, production line tools, and supply chain dashboards. These data products are utilised by thousands of users globally, including internal stakeholders and external vendors, enhancing collaboration and efficiency across the organisation.
What are the best practices for Snowflake data sharing?
Optimize your Snowflake data sharing experience with these essential practices. Ensure data security by utilizing secure views to filter and mask sensitive information. Enhance clarity and understanding by employing descriptive names and comments for your shares. Monitor and fine-tune your sharing activities using Snowflake Information Schema or Account Usage views. Foster communication and collaboration with your consumers to create a seamless workflow.
Take command of your data sharing environment by setting quotas and limits with the ALTER SHARE command. Keep your consumers informed about any changes or updates to your shares, and actively seek feedback to refine your data-sharing strategy. Explore additional data sources through Snowflake Data Exchange or Data Marketplace to enrich your analytics.
These best practices safeguard sensitive data, ensure compliance with data privacy regulations, clarify the purpose of each share, and provide insights into usage and performance, ultimately enhancing your data analysis capabilities. Below are some best practices for data sharing with Snowflake:
- Understand Snowflake Data Sharing Familiarize yourself with Snowflake's data sharing features, such as Secure Data Sharing (SDS) and Sharehouse, to leverage the platform effectively.
- Role-Based Access Control (RBAC) Implement strong RBAC policies to control who can share data and who can access shared data. Define roles and permissions to ensure data security and compliance.
- Secure Data Sharing Use Secure Data Sharing (SDS) to securely share data with external parties without copying or moving the data. Implement encryption and access controls to protect sensitive information.
- Sharehouse Best Practices If using Sharehouse, follow best practices for creating and managing share objects. This includes defining share schemas, tables, and using the appropriate share options for your use case.
- Data Masking and Redaction Apply data masking or redaction policies to shared data to protect sensitive information. Ensure that shared data complies with privacy regulations and internal data governance policies.
- Query Performance Optimization Optimize query performance for shared data by using clustering keys, partitioning, and indexing. This helps enhance the efficiency of queries on large datasets.
- Versioning and Change Tracking Implement versioning and change tracking mechanisms to keep track of updates and changes in shared data. This ensures data lineage and helps with auditing and troubleshooting.
- Documentation and Metadata Maintain comprehensive documentation and metadata for shared datasets. Include information about the source, purpose, and any transformations applied. This helps users understand the shared data context.
- Governance and Monitoring Establish governance practices for data sharing, including regular reviews of shared data objects and access logs. Monitor data-sharing activities to identify any anomalies or potential security issues.
- Educate Users Provide training and documentation for users involved in data-sharing activities. Ensure they understand the best practices, security protocols, and the impact of data sharing on performance.
- Regular Audits and Reviews Conduct regular audits and reviews of shared data objects, permissions, and access controls. This helps maintain data integrity, security, and compliance with organizational policies.
- Cost Monitoring
By adhering to these best practices, you can:
1. Shield Sensitive Data: Employ secure views to fortify sensitive information.
2. Navigate Data Privacy Regulations: Ensure compliance with data privacy regulations by controlling access and usage.
3. Illuminate the Purpose of Each Share: Maintain transparency regarding the intended purpose and content of each shared dataset.
4. Efficiently Monitor Usage and Performance: Keep a finger on the pulse of usage patterns and optimize performance for streamlined data sharing.
5. Elevate Your Data Analysis Journey: Enrich your analytics by exploring diverse data sources and unlocking fresh perspectives.
What’s Next
1. Enhanced Data Collaboration Tools:
Best Way to Share Data for Your Business
For secure collaboration, old ways of copying data are no longer the best. If you're working with trusted partners and it's privacy-compliant, Snowflake Secure Data Sharing is a quick and secure option. But, if you're dealing with sensitive or regulated data, especially when the risk is high, consider using a data clean room for an extra layer of security and compliance.
Beinex + Snowflake Offerings
Beinex’s partnership with Snowflake enables us to offer you advanced features like automated tuning and elastic compute, along with analytics modernisation services, to help your organisation realise exponential Return on Investment.
Cohort Retention Analysis in Tableau
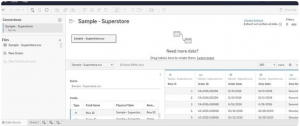
To start, access the Superstore Dataset, available for download on Kaggle. Use Tableau Public to connect to this dataset and explore the rows and columns to understand the documented data related to the Superstore. This exploration sets the stage for the subsequent cohort retention analysis.
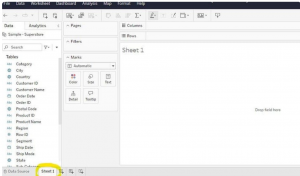
 Move over to the Sheet 1 tab; this will serve as your dedicated workspace where you'll craft your visualizations. This area will be your canvas to build and design the subsequent analyses and visual representations.
To perform cohort analysis effectively, specific data points are necessary:
Unique Identifier: Utilize the Customer ID as the unique identifier for each customer.
First Purchase Date: This marks the date when a customer made their initial purchase, a pivotal point for creating cohort groups.
Revenue Data: Information regarding the financial aspect of each transaction.
Creating Calculated Fields
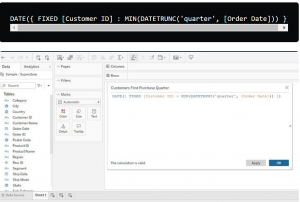
One crucial calculated field needed is the "Customers’ First Purchase Date (quarter)." Since the dataset doesn't contain the first purchase date field, a calculated field is essential. This field is derived from computations based on existing data in the dataset, enabling the identification of when each customer made their initial purchase. Calculated fields are instrumental in manipulating and analyzing data by performing calculations based on existing dataset information.

To create quarter and year cohorts based on the customers' first purchase date:
Defining Cohorts: In this dataset spanning four years (2014–2017), cohorts will be based on the quarter and year when customers made their initial purchase. This approach ensures a manageable cohort table for analysis.Calculation for Quarter Identification: The calculation to establish the quarter in which a customer made their first purchase involves determining the quarter and year from the purchase date.
This calculation utilizes the 'DATETRUNC' function to extract the quarter from the 'First Purchase Date' field, aligning customers based on the quarter they made their initial purchase.
Flexibility in Cohort Creation: While quarters and years are chosen for cohort segmentation in this scenario, other time parameters like days, weeks, or months could also be used for cohort creation, depending on the dataset and analytical objectives. However, for this particular dataset, quarters and years were deemed more practical for effective analysis.
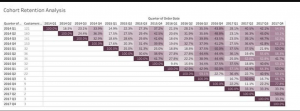
Assembling the cohort retention table involves using the calculated fields previously created to form a comprehensive table that illustrates cohort-based metrics, particularly the number of unique customers per first quarter and the retention rate.
Here's how to assemble the cohort table:


This formula divides the count of unique customers by the total number of customers from the first quarter, providing the retention rate for each subsequent period.
This table allows for a clear visualization of how customer retention varies across different cohorts over subsequent periods, providing insights into the effectiveness of retaining customers acquired in specific quarters.
This step-by-step guide is incredibly detailed for constructing the cohort table in Tableau. It breaks down the process systematically, ensuring proper visualization of the cohort analysis.
Interpreting the retention rates from this table involves examining both the rows and columns:
Rows (First and Second Columns): Here, you'll find different year and quarter groups representing cohorts, along with the count of customers who made their first purchase in each respective period.Columns (Third Column): As you move across the table, you'll encounter the percentages indicating how many customers continued making purchases at the Superstore across subsequent quarters after their initial purchase.
For instance, if 160 customers made their first purchase in 2014 Q2, you'd observe that 24.4% returned to make purchases in 2014 Q3, and 36.3% made purchases in 2014 Q4. This trend continues across the subsequent periods.
 In conclusion, creating calculated fields is an essential part of conducting cohort analysis in Tableau. It involves utilizing functions effectively. If you're new to Tableau functions, exploring articles or resources on Tableau functions could fill any knowledge gaps and provide a deeper understanding of their usage in data analysis and visualization. The provided Tableau article on functions might be particularly helpful for a more comprehensive understanding.