Geo Spatial Analysis Using Map Layers, Buffer Calculations, and Parameter Actions
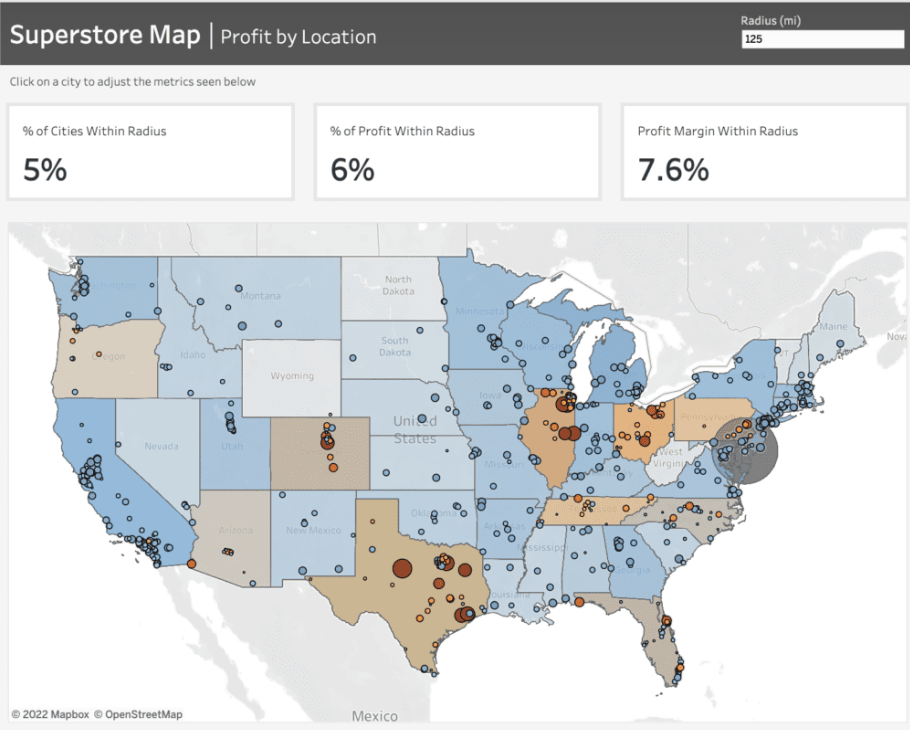
For instance, the dashboard given below mirrors a project undertaken for a client seeking insights into the pandemic's impact on their business across specific areas. They wanted to determine the number of stores stocking their product within a defined radius, highlighting the local business impact amid the pandemic.
To craft the map showcased in this dashboard, we leverage Tableau's map layers feature introduced in version 2020.4. For further insights into this functionality, additional details can be found here.
Prior to initiating the map creation process, frequently refer to the Profit Margin field. Here's the calculation for this field: it computes the percentage of Sales that translates into Profit. This calculation enables us to gauge the profitability derived from our sales figures.
For the States map layer, the State field is utilized and placed on the 'Detail' shelf. Each state is color-coded based on its Profit Margin.
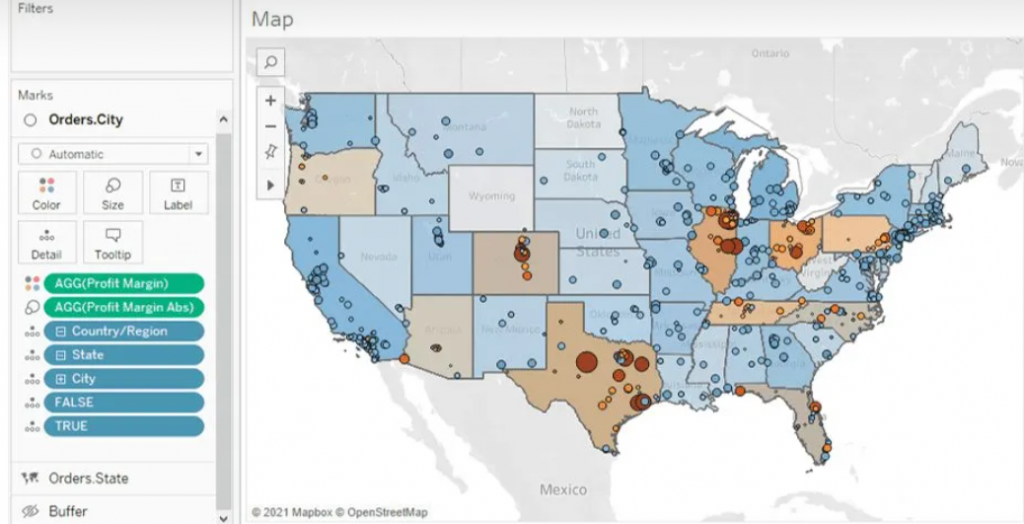
Moving to the Cities layer, the City field is added onto the top left area labeled "Add a Marks Layer." To ensure the visibility of every city, the State level of detail is included as well. This accounts for cities existing in multiple states, displaying every city/state combination. Cities are color-coded using the Profit Margin field, with additional color based on the absolute value of the Profit Margin. This helps visualize the range and direction of profitability for each city.

Buffer Calculation
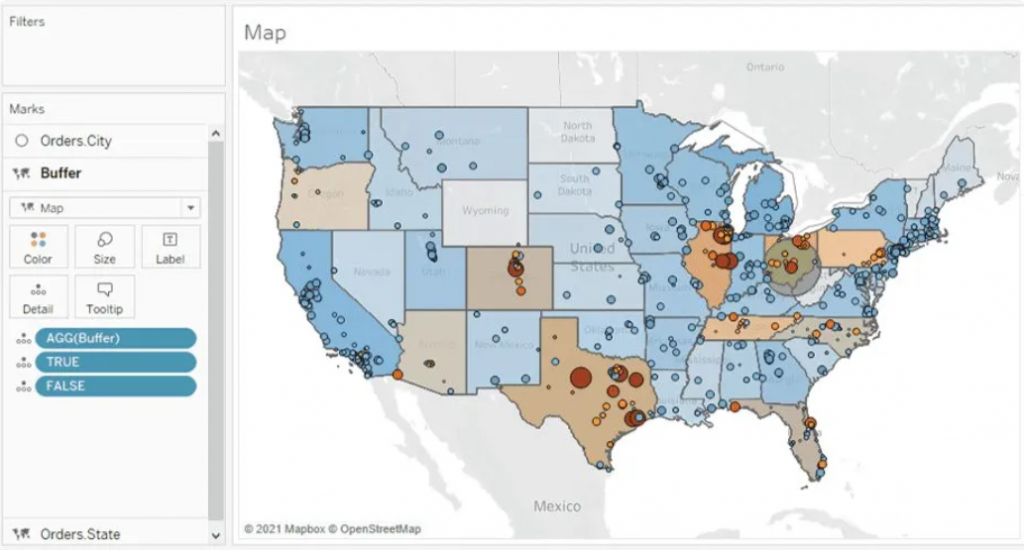
The Buffer calculation generates a radius, known as a "buffer," around a specific map point, defined within the syntax parameters. Here's the syntax breakdown for the Buffer: The initial part determines the center location, followed by the distance around the point, and finally, the chosen unit of measurement.
To establish the desired centroid point, we employ the Makepoint function. This function simply utilizes latitude and longitude coordinates to generate a point on the map. Below is the calculation illustrating its usage.

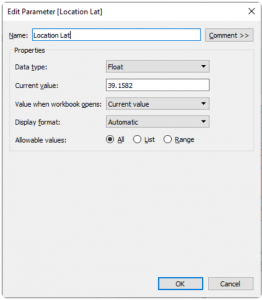
To achieve the interactivity you desire, you'll begin by creating three parameters: [Location Lat], [Location Long], and [Radius]. These parameters offer flexibility, allowing you to adjust them within the dashboard interface.
As you click on different cities, the [Location Lat] and [Location Long] fields dynamically change, altering the central point. Meanwhile, the [Radius] field, functioning as an input parameter, enables you to modify the radius distance according to your preferences. This setup grants you personalized control over these parameters directly within the dashboard.
With the creation of the final map layer field, you can now drag this field to the top left of the map and add it to the existing layers. Once done, you'll have all the map layers integrated into the map, allowing you to recreate the dashboard as depicted below. This comprehensive setup will mirror the dashboard layout and functionality.
Parameter Actions
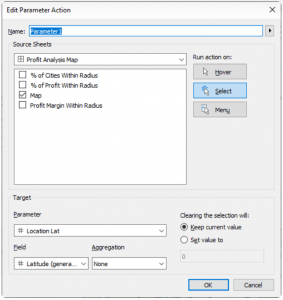
Parameter Actions are essential at this stage to ensure dynamic interaction within the map layers. By implementing parameter actions, we enable the Location Lat and Location Long fields to adjust dynamically when clicking on a city. This action directly affects the MAKEPOINT() field within the Buffer calculation, effectively altering the radius location. Below, you can observe the setup of the parameter action and how it facilitates this dynamic transformation.
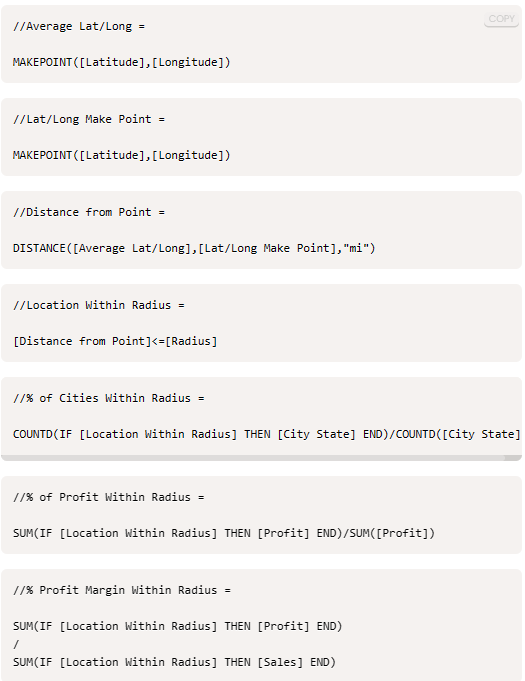
Finally, we aim for these parameters to influence the available metrics showcased at the top of the dashboard. These metrics offer insights into the concentration of profit and profit margin within the selected radius. Below, you'll find the supporting calculations and the formulae for the metrics displayed on the dashboard. These metrics serve as indicators of profitability and profit margin concentration within the chosen radius.
Wrapping up, creating interactive data visualizations opens doors to explore and comprehend information, fostering informed decision-making and exploration of new analytical paths.
Tableau has an array of exciting mapping functionalities, elevating the scope of geospatial analytics for users. Buffer and distance calculations and demonstrate their integration with parameter actions to craft an interactive geospatial analysis.
Related Articles
Key Trends in GenAI: Be Always in the Know
The latest GenAI trends can take your business by storm, bringing significant transformations, improvements, and competitive advantages powerfully as follows:1. Hyper-personalized marketing: Marketing That Knows You Better
Imagine a world where every ad you see feels made just for you. Generative AI is making that happen by analyzing tons of data to understand your likes and dislikes. Businesses can now tailor their campaigns so perfectly that it’s almost spooky—in a good way! For example, AI can track your browsing history and suggest exactly the product you didn’t know you needed. It’s like having a personal shopper in your pocket. Plus, in education, platforms use AI to adapt lessons based on how well students do, making learning more effective and fun.2. AI-driven automation: Getting Stuff Done Automatically
Let’s face it: no one likes spending hours on repetitive tasks. That’s where generative AI comes in. By 2025, it’s expected to automate up to 30% of business operations. Think about supply chain processes, scheduling, or managing employee requests—AI can handle everything. For instance, companies are already using AI to speed up inventory management or even predict what products will be in demand. And customer service? AI-powered bots can answer questions faster and better than ever.3. Conversational AI: Chatbots That Understand You
If you’ve ever had to deal with a clunky chatbot, you know how frustrating it can be. But conversational AI is leveling up. By 2028, virtual assistants and chatbots will feel more like talking to a helpful human than a robot. They’ll be able to understand complex questions, respond in natural language, and even handle customer complaints like pros. Industries like healthcare and banking are already using this to make their customer service faster and more efficient. No more waiting on hold for hours!4. Multi-Modal GenAI: AI That Gets All the Details
Generative AI is becoming more intelligent by combining different types of data—text, images, video, and even sound. This is called multi-modal AI, and it’s a big deal. Why? Because it can look at all these inputs together to give a complete picture. For example, retail companies use this technology to analyze how customers behave online and in-store. It helps them precisely recommend what customers want, whether a new outfit or a better grocery deal.5. AI & Healthcare: A Big Boost for Healthcare
Generative AI is saving lives. Seriously. It’s helping doctors create personalized treatment plans by analyzing patient data, medical history, and test results. AI is also speeding up research, making discovering new drugs and treatments easier. More than 75% of healthcare companies are exploring AI. This means faster diagnoses, fewer errors, and more time for doctors to focus on their patients.6. AI and Cybersecurity: Fighting Cybercrime Like a Pro
With the rise of digital threats, cybersecurity has become a top priority. Generative AI is stepping in to help by detecting suspicious activity before it becomes a full-blown attack. By 2027, AI-powered systems will drastically reduce false alarms, making it easier for companies to stay safe.7. Ethics and Regulation: Keeping AI Ethical
As AI gets smarter, questions about how to use it responsibly are growing louder. Governments and companies are working to create rules that ensure AI is fair, safe, and doesn’t harm anyone. For example, the EU focuses on making AI ethical and transparent, while the U.S. takes a more flexible approach to encourage innovation. If you’re a business owner, now’s the time to ensure your AI practices are legal and ethical.8. Decentralized AI: Better Privacy
What if you could use AI without worrying about your data being misused? That’s what decentralized AI aims to do. Using blockchain technology keeps your data private and secure, giving you more control over its use. This is especially important in sensitive industries like healthcare and finance.9. GenAI and Business: Bringing Big Wins
In the business world, the true potential of generative AI lies in fine-tuning models to meet specific needs. By 2025, enterprises will hold the reins of AI, leveraging it to drive innovation. Success won't come from simply having vast amounts of data. It will hinge on adapting AI models to work seamlessly with that data. Customized multimodal LLM fine-tuning and evaluation datasets customized to specific use cases enable precise model training. This empowers businesses to unlock the full value of their data and maintain a competitive edge with AI.10. Open-source models: Pushing Boundaries
This year marks a breakthrough for open-source AI models like Meta’s Llama, Mistral, and Google’s Gemma, offering affordability and accessibility that empower developers and small businesses to innovate. Open-source models like "Llama 3" enable companies to integrate AI seamlessly, transforming businesses of all sizes into AI-driven operations. Open-source fuels innovation and adoption, while closed-source models push AI's boundaries—both are vital for progress.11. Human-in-the-Loop (HITL): Trend
Human-in-the-loop (HITL) is a key trend, emphasizing the integration of human feedback into Generative AI. This ensures that AI models align with ethical standards, cultural nuances, and real-world needs. HITL improves AI accuracy and fosters collaboration between human expertise and AI. By using HITL, organizations can harness the power of AI while maintaining control over outcomes. Our research also highlights how LLMs can generate inaccurate results without proper human oversight.12. Agentic AI: Latest Addition
Agentic AI just popped up in mid-2024, the hottest topic for 2025. What's so special about it? This new kind of AI can operate independently, making decisions and acting without needing us to guide it at every step. This is quite different from older AI, which only did what we told it to. These AI agents are especially useful in customer service, where they can handle tasks more efficiently, saving time and increasing productivity, or in finance, where they quickly analyze data and offer recommendations.13. AI in the Creative Industry: Taking the Lead
Generative AI isn’t just about data and numbers—it’s getting creative too! It’s used to design clothes, create digital art, and even compose music. Imagine a fashion brand using AI to develop the next big trend or a filmmaker creating a blockbuster script with AI’s help. It’s opening up endless media, entertainment, and advertising possibilities.14. AI in Gaming: Immersive than Ever
If you’re a gamer, get ready for some serious fun. Generative AI creates immersive games by creating dynamic characters, realistic environments, and engaging storylines. Imagine playing a game where the plot changes based on your decisions—AI makes that possible.Wrapping It Up: The AI Revolution Is Here
Generative AI is more than a tool; it’s a game-changer. From personalized shopping experiences to groundbreaking medical discoveries, it’s transforming every part of our lives. The best part? We’re just getting started. As businesses and individuals, now’s the time to embrace this exciting technology. Whether you’re an entrepreneur, a tech enthusiast, or just someone curious about the future, there’s much to look forward to. So, what are you waiting for? The AI revolution isn’t coming; it’s already here. Let’s make the most of it!The Struggles of Traditional Business Intelligence
Traditional BI platforms, while valuable, suffer from several limitations:
These limitations force businesses to make a tough choice: sacrifice the quality of insights by limiting analysis or invest significant time and resources into data preparation and model building.
The Rise of Augmented Analytics
Augmented analytics emerges as a powerful solution, addressing the shortcomings of traditional BI. It leverages the power of Artificial Intelligence (AI), Machine Learning (ML), and Natural Language Processing (NLP) to revolutionize data analysis:
How Does Augmented Analytics Work?
Augmented analytics enhances the four core stages of data analysis:
- Data Preparation: Traditionally, data preparation involves manual tasks like data cleaning and integration. Augmented analytics automates these processes, allowing data scientists to focus on more strategic tasks.
- Insight Discovery: Traditional BI requires pre-defined models to uncover insights. Augmented analytics utilizes ML algorithms to analyze all available data, regardless of size or complexity, to deliver targeted and nuanced insights in response to user queries.
- Insights Sharing: Sharing insights often involves generating reports and charts, a time-consuming task. Augmented analytics utilizes Natural Language Generation (NLG) to present insights in real time through online dashboards. These dashboards explain the "why" behind the data, giving decision-makers the context they need.
The Benefits of Augmented Analytics
By implementing augmented analytics, businesses can unlock a multitude of benefits:
Augmented Analytics Use Cases
Let's explore how augmented analytics is transforming various industries:
- Pharmaceutical Companies: Analyze vast datasets to optimize go-to-market strategies and uncover hidden patterns in market share data.
- Financial Lenders: Assess credit risk with greater accuracy by analyzing all relevant data points in real-time, leading to faster loan approvals and better risk management.
- Consumer Goods Companies: Gain real-time insights into product sales, customer churn, and satisfaction, allowing for proactive customer engagement strategies.
An actual representative and one fascinating example of digital transformation is the use of "digital twins," which are virtual reproductions of real-world things that have been given artificial intelligence and real-time data. The ‘thing’ can be anything under the moon, from a jet engine to a car. The physical asset's connected sensors gather data that can be transferred onto the virtual model. Now, anyone seeing the digital twin can see essential details regarding how the physical object is faring in the real world. They can, however, be interpreted in various ways, which tends to conceal their accurate, practical application.
A digital equivalent for a physical entity serves as the foundation for digital twins. Every business connection with its clients involves physical elements, from the automotive to the agricultural industries. With the help of digital twins, businesses will be able to extend the advantages of the software world to their physical assets, better meeting the needs of their digital customers.
How do digital twins get to know everything?
The digital data, twins gather from specialists with in-depth topic expertise from other similar assets, helps them learn on their own. After being created, the twins have sensors that enable it to take in any input from its physical twin. This can be used to identify potential problems, gain knowledge, gather feedback on a product, and more. Additionally, they include and use past data to polish their simulations.
The digital twin's architecture
Customarily, digital twins have three layers:
- A connectivity layer that uses SCADA, the Internet of Things, or historians
- A modelling and simulation layer may include a wide range of tools, including artificial intelligence (AI), industry simulators (thermodynamic, fluid-dynamic, chemical, and more), and AI.
- A layer for insight and visualisation that can be created online, with analytics software, or even with mixed reality
The final layer of these three is called "learning feedback," which enables the use of expert feedback and historical data to alter the behaviour of digital twins and the dependability of the physical twin.
Who stands to gain?
Digital twins can contribute to increased productivity in massive engines and intricate machinery. Like industrial settings with cooperative machine systems, digital twins are excellent in enhancing process efficiency. Those sectors that work on large-scale items or projects have the most success with digital twins. Digital twin technology has been used in Formula 1 racing to streamline the competition. Any racing or sports team could employ the digital twin to use a virtual twin in determining areas for strategy and progress.
Consider real estate as another example; a digital twin would link all systems and provide accurate insights and the capacity to evaluate the process. Managers would then be able to refine their plans, improving the structure's viability and effectiveness. Additionally, it would result in lower expenses.
Last but not least, the digital twin notion in healthcare refers to the development of computer models of diseases or even a virtual human body. Customised medications or therapies might be created using a medical twin for each patient. The following industries are going to reap the maximum benefits of digital twins:
- Engineering (systems)
- Automobile manufacturing
- Aircraft production
- Railcar design
- Building construction
- Manufacturing
- Power utilities
- Real estate
- Sports and Racing
- Healthcare
1.Enhance the user experience
Data is essential to comprehend the past, know the present, and anticipate the future. The foundation of any effective user experience programme is effective data management. Digital twins use IoT to collect real-time data from the physical environment. The information gathered is continually analysed, examined, and learned to provide valuable insights. With real-time analytics, businesses may successfully implement user-centric programs.
2.High-quality, innovative products
A competitive advantage that separates the leader from the followers is innovation. Physical asset innovation necessitates significant R&D expenditures. Design, testing, and operation require specialised knowledge due to the high cost of failures. These creative roadblocks can be solved with the help of digital twins. Enterprises can work with the user community to create high-quality offerings in a simulated environment that combines real-time information.
3.Enhance business processes
In terms of consumer annoyance, broken processes and bureaucracy would be at the top. The orchestration, knowledge management, and technological architecture are fragmented and siloed due to the complexity of modern business operations. The numerous systems and processes are brought together under one roof using digital twins, which act as a meta-layer. Digital twins are essential for knowledge management, training, and process optimisation in the complicated future. Additionally, simulations and visualisations support better process management and human learning.
4.Operative flexibility
Operational agility will affect an organisation’s top and bottom lines in a highly competitive marketplace. Black-box algorithms, the enormous amounts of information gathered, and the need for quicker judgments all work against human operators. Digital twins allow a range of diagnostic and prognostic capabilities by utilising enormous amounts of data, technology, and scenario. The human operators can re-enter the process and find strategies for being competitive and flexible.
5.Information security
Information security is a challenge that comes with all the data. Open source, collaborative learning, and knowledge sharing have never had a more compelling argument. We can't advance if data breaches are happening more frequently. Trusted stakeholders could collaborate on a platform provided by digital twins to share information and gain from it. Digital twins can also act as a layer of concealment to protect the confidentiality of the data.
6.Upgraded R&D
Utilising digital twins produces a wealth of data regarding expected performance results, facilitating more efficient product research and creation. Before beginning production, businesses can use this data to gain insights that will help them make the necessary product improvements.
7.Greater effectiveness
Digital twins can aid in monitoring and mirroring production systems even after a new product has entered production to reach and maintain peak efficiency throughout the manufacturing process.
8.Product life cycle
Digital twins can also assist producers in determining how to handle products that have reached the end of their useful lives and require final processing, such as recycling or other actions. They can decide which product materials can be gathered by utilising digital twins.
9.The Future Course
The market for digital twins is increasing, which suggests that even if they are already used in many different industries, demand will persist for a while. The need for digital twins was worth USD 3.1 billion in 2020. It may continue to snowball until at least 2026, rising to a projected USD 48.2 billion, according to specific industry observers.
According to IDC, global spending on products and services that facilitate digital transformation will amount to US$1.97 trillion in 2022, growing at a CAGR of 16.7%. Businesses are transforming the structure of their work to put the client first. Enterprises are taking more significant risks than ever in every aspect of business, from product design to marketing, sales, and even post-sales. Enterprises can use digital twins as a strategy to accomplish the goals of their initiatives for digital transformation.
What is an SLM?
A Small Language Model (SLM) is tailored to excel in simpler tasks, offering boosted accessibility and user-friendliness for organizations operating with limited resources. Besides, they can be readily fine-tuned to align with specific requirements. Small language models are particularly well-suited for organizations aiming to develop applications capable of operating local devices instead of relying on cloud infrastructure. They are especially beneficial for tasks that do not necessitate extensive reasoning or immediate responses.
Reasons to use SLMs
Given the growing popularity and applicability of SLMs across various domains, particularly in areas like sustainability and the volume of data required for training, there are multiple reasons for employing them.
What is Phi-3?
Microsoft has a suite of small language models (SLMs) known as 'Phi,' demonstrating outstanding performance across various benchmarks. Microsoft's recent release is Phi-3, a series of open AI models. The Phi-3 models represent a prototype of capability and cost-effectiveness among small language models (SLMs), exceeding models of equivalent and larger sizes across the spectrum of coding, language, reasoning, and mathematical standards. This launch broadens the array of high-calibre models accessible to customers, providing them with more practical options as they craft and construct generative AI applications.
Phi-3-mini, a 3.8B language model, is accessible through Microsoft Azure AI Studio, Hugging Face, and Ollama. It is offered in two context-length variations—4K and 128K tokens. Notably, it is the first model within its category to support a context window of up to 128K tokens with minimal impact on quality. Furthermore, it is instruction-tuned, implying that it has been trained to comprehend and adhere to diverse instructions, mirroring natural human communication patterns. This ensures that the model is readily deployable straight out of the box. Phi-3-mini is available on Azure AI to leverage the deploy-eval-finetune toolchain, and it is also accessible on Ollama for developers to execute locally on their laptops.
Features of Phi-3
Phi-3 models exhibit distinctive superiority over language models of comparable and larger dimensions on key benchmarks, showcasing the following features:
Snowflake meets Phi-3: Advantages
The key pain point about LLMs is the computing required to host and run them. Setting up a dozen GPUs to run models can be expensive and complex. There's where Snowflake steps up. Snowflake's compute pool option enables users to easily and quickly set up and manage compute clusters. Phi-3 comes into the picture because of its cost-effective GPU utilization.
Can you imagine a situation where your language model only requires less than 3GB of GPU memory for inference? Well, now it's possible, all thanks to Phi-3. It's a state-of-the-art SLM that produces excellent results over GP3.5 and Mistral 8x7B, which are much bigger models. This opens the door for more cost-effective solutions to be brought up in the AI space. Add Snowflake for hosting; you have an excellent setup to host, test, and build AI applications. Read below how Beinex managed to run Phi-3 on Day 0 in Snowflake.
Figure 1: DocAI running on Phi-3
Implementing Phi-3 on Snowflake: What Beinex Did and How Beinex Did it?
Beinex has seamlessly integrated Phi-3 into Snowflake to help enterprises unlock their data's full potential through advanced language processing capabilities and enhance decision-making with deeper insights. The integration facilitates Snowflake users to:
Here's a detailed guide on implementing Phi-3 on Snowflake:
Step 1: Create Necessary Objects
-- Run by ACCOUNTADMIN to allow connecting to Hugging Face to download the model
-- Stage to store LLM models
CREATE STAGE <stagename> IF NOT EXISTS models
DIRECTORY = (ENABLE = TRUE)
ENCRYPTION = (TYPE='SNOWFLAKE_SSE');
-- Stage to store YAML specs
CREATE STAGE <stagename> IF NOT EXISTS specs
DIRECTORY = (ENABLE = TRUE)
ENCRYPTION = (TYPE='SNOWFLAKE_SSE');
-- Image repository
CREATE OR REPLACE IMAGE REPOSITORY images;
-- Compute pool to run containers
CREATE COMPUTE POOL GPU_NV_S
MIN_NODES = 1
MAX_NODES = 1
INSTANCE_FAMILY = GPU_NV_S;
Step 2: Docker Image Code - ollama
FROM ollama/ollama
RUN $(ollama serve > output.log 2>&1 &) && sleep 10 && ollama pull phi3 && pkill ollama && rm output.log
ENTRYPOINT ["ollama"]
CMD ["serve"]
Step 3: Tag and Push the Docker Image
docker tag ollama <SNOW_ORG-SNOW_ACCOUNT>.registry.snowflakecomputing.com/db/schema/image respository /ollama
docker push <SNOW_ORG-SNOW_ACCOUNT>.registry.snowflakecomputing.com db/schema/image repository /ollama
Step 4: Docker Image - UDF
FROM python:3.11
WORKDIR /app
ADD ./requirements.txt /app/
RUN pip install --no-cache-dir -r requirements.txt
ADD ./ /app
EXPOSE 5000
ENV FLASK_APP=app
CMD ["flask", "run", "--host=0.0.0.0"]
App.py content is given below :
from flask import Flask, request, Response, jsonify
import logging
import re
import os
from openai import OpenAI
client = OpenAI(
base_url='http://ollama:11434/v1',
api_key="EMPTY",
)
model = "phi3"
app = Flask(__name__)
app.logger.setLevel(logging.ERROR)
def extract_json_from_string(s):
logging.info(f"Extracting JSON from string: {s}")
# Use a regular expression to find a JSON-like string
matches = re.findall(r"\{[^{}]*\}", s)
if matches:
# Return the first match (assuming there's only one JSON object embedded)
return matches[0]
# Return the original string if no JSON object is found
return s
@app.route("/", methods=["POST"])
def udf():
try:
request_data: dict = request.get_json(force=True) # type: ignore
return_data = []
for index, col1 in request_data["data"]:
completion = client.chat.completions.create(
model=model,
messages=[
{
"role": "system",
"content": "You are a bot to help extract data and should give professional responses",
},
{"role": "user", "content": col1},
],
)
return_data.append(
[index, extract_json_from_string(completion.choices[0].message.content)]
)
return jsonify({"data": return_data})
except Exception as e:
app.logger.exception(e)
return jsonify(str(e)), 500
Step 6: YAML File
spec:
containers:
- name: ollama
image: <SNOW_ORG-SNOW_ACCOUNT>.registry.snowflakecomputing.com/ db/schema/image respository /Phi3
resources:
requests:
nvidia.com/gpu: 1
limits:
nvidia.com/gpu: 1
env:
NUM_GPU: 1
MAX_GPU_MEMORY: 24Gib
volumeMounts:
- name: llm-workspace
mountPath: /<stage name>
- name: udf
image: <SNOW_ORG-SNOW_ACCOUNT>.registry.snowflakecomputing.com/ db/schema/image respository /ollama_udf
endpoints:
- name: chat
port: 5000
public: false
- name: llm
port: 11434
public: false
volumes:
- name: llm-workspace
source: "@<llm stage_name>"
Step 7: Upload YAML File and Create Service
Upload the YAML file to the created stage, where the stage name in the YAML file should match the stage created in Step 2.
-- Create service
create service phi3
IN COMPUTE POOL <name of compute pool created>
FROM @dash_stage
SPECIFICATION_FILE = '<name of yaml file uploaded>';
Step 8: Create Service Function
Create a service function on the service (after it starts).
create or replace function phi3chat(prompt text)
returns text
service= phi3
endpoint=chat;
Check Service Status
Use the following command to check the status of the service:
SELECT
v.value:containerName::varchar container_name,
v.value:status::varchar status,
v.value:message::varchar message
FROM (
SELECT parse_json(system$get_service_status('<service name>'))
) t,
LATERAL FLATTEN(input => t.$1) v;
Benefits of Running Phi-3 on Snowflake
1. Cost-Effectiveness and Efficiency:
2. Compatibility with Smaller GPUs:
3. Exceptional Performance:
4. Faster Response Times:
SLM vs LLM
The choice between small and large language models hinges on organizational needs, task complexity, and resource availability.
LLMs excel in applications requiring the orchestration of intricate tasks, encompassing advanced reasoning, data analysis, and contextual comprehension.
On the other hand, SLMs present viable options for regulated industries and sectors facing scenarios necessitating top-tier results while maintaining data within their premises.
Both large and small language models possess distinct strengths and applications. While large language models thrive in managing complex workflows, small language models deliver impressive performance despite their compact size.
While some customers may exclusively require small models, others may favour larger models, with many seeking to integrate both types in various configurations. Ultimately, the optimal selection depends on the unique context and objectives of the organization. Besides transitioning from large to small models, the trend is evolving towards a diversified portfolio of models. This means that instead of relying on a single model, customers can choose from various models with different sizes, capabilities, and resource requirements. This empowers customers to decide the best model for their scenario, balancing performance and resource constraints.

Challenge
- The IT infrastructure of Nissan Middle East FZE where the PowerBI Report Server platform was hosted was in an on-premise datacenter which was designed to be scalable and robust with multi node physical clusters including the server, storage and network components. However, most of the physical hardware was quite old and not equipped with the latest generation of physical servers.
- Frequent hardware crashes and portal downtime kept troubling the availability of the PowerBI Report Server application. Assigning a touch hand support person to power on the hardware that was down seemed quite impossible due the restrictions during covid period. Hence, Nissan Middle East FZE wanted to look for another viable solution.
- Though the hardware setup at Nissan Middle East FZE was well equipped to meet the occasional spikes in the traffic, it was observed that over a course of 6-month time, most of the IT infra was underutilized than predicted. It was realized that spending huge amount of money on an old hardware plus software maintenance, license costs, internet bandwidth, datacenter cooling and maintenance, touch support personnel and electricity costs – were keeping the business operations challenging.
- There was an attempt by Nissan Middle East FZE to select a cost-effective solution that can host PowerBI Report Server application servers, web servers and archival data. This way IT infra can be re-provisioned to host sensitive data on-premise and the rest on the cloud, thereby reducing the overall physical hardware costs spent on a yearly basis.
Why AWS
- Nissan Middle East FZE decided to migrate PowerBI Report Server, database servers and archival data to AWS.
- The PowerBI Report Server’s AWS architecture includes Amazon Elastic Compute Cloud (Amazon EC2), that provides complete control of its computing resources, updates to tables in Amazon Relational Database Service (Amazon RDS) and AWS Elastic Load Balancer was used to distribute the traffic to the underlying EC2 instances based on the load.