How AI Decision-Making is Improving Enterprise Outcomes
Blog
Share 
GCP's Vertex AI Agent Builder: Build, Scale, and Govern Reliable AI Agents
 7 January 2026
  Sumi S
 Many teams can build AI agents as experiments, but turning them into something that works reliably, safely, and at scale for real business use is much harder. To solve this, the Vertex AI Agent Builder from Google Cloud helps organizations build, run, monitor, and secure AI agents from start to finish. In short, Google is making it easier to go from "we built a demo agent" to "we run trusted AI agents in production."
What is Vertex AI Agent Builder
Vertex AI Agent Builder is Google's comprehensive and open platform for building, scaling, and governing reliable agents. It offers advanced generative AI capabilities, low-code development, and seamless integration with GCP services to build intelligent, task-oriented agents at scale.
Top Benefits of Vertex AI Agent Builder
Vertex AI Agent Builder offers the full-stack foundation and extensive developer options you need to transform your applications and workflows into robust, reliable agent-based systems. The advantages of using the Vertex AI Agent Builder include:
- Simplified AI Agent Building
One of the biggest challenges teams face is starting fast without losing control later. Agent Builder simplifies the building phase here. Teams can create more resilient agents, meaning that if something fails, the agent can recover on its own rather than stopping altogether. Builders can also spend less time configuring environments and more time on what matters: designing practical workflows. As a result, AI agents move more quickly from idea to usable solution.
- Enterprise-Ready Scale and Operations
Running a single AI agent is manageable, but running many across teams, regions, and use cases is not. To solve this, Agent Builder supports smooth scaling with built-in visibility. Teams can see how agents are behaving once they're live and observe whether responses are slow, errors are increasing, or usage is going up unexpectedly.
The teams gain clarity, enabling them to analyze past interactions, identify issues more quickly, and continuously improve performance. It helps move confidently from pilot deployments to large-scale, enterprise-wide rollouts.
- Strong Governance and Safety
Agent Builder introduces strong governance, so organizations stay in control. It includes prompt-injection detection, tool-call auditing, and centralized security controls, enabling legal and security teams to enforce policies without slowing down development. Each AI agent can have its own identity, access limits, and security boundaries, just like a human employee would in an enterprise system.
Built-in safeguards help protect against misuse, data exposure, or unauthorized actions. This makes it easier for compliance, risk, and IT teams to confidently approve AI-driven workflows.
- Improved Employee Adoption
Another big step forward is the ability to make these agents available directly within Gemini Enterprise. Instead of employees searching for separate tools, custom AI agents can appear in a single, familiar workspace ready to assist with everyday tasks. This increases adoption and makes AI feel less like a technology project and more like a productivity partner.
- Integration with Existing Cloud Investments
Because it’s deeply integrated with Google Cloud services such as BigQuery, Cloud Storage, and Workspace, agents can do more than answer questions. They can take action, update records, trigger workflows, create tickets, or support operational tasks through standard APIs.
Summing Up
Vertex AI Agent Builder combines fast prototyping, developer extensibility, enterprise governance, and scaling operations. This results in a robust platform for teams aiming to transition from experimental chatbots to production agents that utilize real company data. For organizations committed to applying AI in the real world, this represents a significant advancement.
If you are interested in GCP services, connect with us: https://beinex.com/contact-us/
Related Articles
Top 4 Ways on How Marketing Leaders Use Alteryx AI & Analytics Automation for Business Success
Four Ways Alteryx Automation and AI Can Transform Your Marketing Strategy:
While there are numerous objectives marketing teams can achieve with data analytics, this blog highlights four ways Alteryx automation and AI can transform your marketing strategy:
1. Centralize Your Data
As the marketing landscape prepares for a cookie-less future, having a unified view of your data is essential. Staying ahead of customer needs, competition, and campaigns requires gathering all your data in one place.
With analytics automation, you can easily integrate data from various sources—whether cloud or on-premises, first-party data, or marketing applications like web analytics and CRMs—to gain a comprehensive view of your customers. This enables marketing teams to react to market shifts in real time.
Use case:
For example, a multinational retailer leveraged analytics automation to bring together data from all customer interactions, resulting in a 37x improvement in processing efficiency. This allowed them to better understand customer behavior across multiple channels.Unlike traditional spreadsheets, which have limitations on data capacity, analytics automation platforms offer limitless capabilities, allowing you to manage vast amounts of customer and product data in one place.
How Alteryx Helps:
• Drag-and-Drop Data Integration: Simplify complex data workflows with easy-to-use, drag-and-drop tools that eliminate manual coding and reduce time to insight.
• Automated Data Cleaning: Utilize pre-built data preparation tools to clean, standardize, and transform data in just a few clicks, ensuring high-quality data for analysis.
• Cluster Analysis: Automatically group similar data points (e.g., customer segments) using clustering tools, enabling precise targeting and personalization without manual intervention.
2. Enhance Your Marketing Campaigns
Marketing success depends on speed and agility, especially when it comes to predicting market trends and competitor behavior. Optimizing targeting, pricing, or strategy without the right insights becomes a challenge. Analytics automation helps you find the right combination of offers and tactics to increase conversions and boost revenue.
Use Case:
A retail chain with 500+ stores struggled to predict customer buying patterns and optimize promotions. By implementing analytics automation, they processed customer data in real time, enabling hyper-personalized marketing campaigns that boosted conversion rates by 35%.
They also used machine learning to predict demand and optimize inventory, preventing stockouts during key promotions. Additionally, they automated pricing analysis, reducing adjustment times from weeks to hours. By integrating spatial analytics, they could identify high-performing stores and strategically allocate resources, further enhancing their marketing and sales efforts. They also automated pricing analysis based on regional market dynamics, reducing adjustment times from weeks to hours and ensuring competitive pricing across all locations.
How Alteryx Helps:
• Predictive Modeling: Leverage machine learning models to forecast demand, optimize pricing strategies, and predict customer churn, allowing for proactive campaign adjustments. • Market Basket Analysis: Identify products that are frequently purchased together to optimize cross-selling and upselling opportunities, increasing revenue per customer. • Real-Time Analytics: Process large volumes of data in real-time to quickly adjust marketing strategies and promotional offers based on current performance metrics. • Spatial Analytics: By analyzing geographic data, marketing teams can optimize store placements, allocate resources more effectively, and improve overall sales performance.
3. Maximize Your Talent and Resources
Many marketing teams struggle to turn data into valuable business insights. According to Gartner, only 53% of marketing decisions are informed by data analytics. Limited staff and time often prevent teams from fully utilizing their data potential.
Analytics automation bridges this gap by enabling teams to achieve more with fewer resources. It automates the time-consuming tasks of data cleaning and preparation, allowing marketing teams to save significant hours and focus on more strategic projects.
Use Case:
For example, a leading digital advertising agency transitioned from using spreadsheets for social media analysis to implementing analytics automation. This resulted in a 99.5% faster analysis, saving 180 weekly analyst hours. By automating routine tasks, your team can dedicate more time to high-impact initiatives, ultimately enhancing overall business value.How Alteryx Helps:
• Self-Service Analytics: Empower non-technical users to perform complex data analyses without relying on IT or data science teams, accelerating time to insight. • Workflow Automation: Automate repetitive tasks like data cleansing, transformation, and reporting, significantly reducing manual effort and minimizing the risk of errors. • Scalable Solutions: Handle vast amounts of data effortlessly, allowing your team to focus on high-impact projects without being bogged down by data management issues.4. Achieve Immediate Results While Preparing for the Future
Marketing leaders often juggle the challenge of balancing short-term returns with long-term strategic goals. Analytics automation solutions can provide quick wins while also laying a foundation for future success.
By choosing a solution that is user-friendly and easy to implement, you can skip lengthy training sessions and start seeing results quickly. Moreover, the best analytics tools are designed with the future in mind, offering integration with cloud services and AI-driven insights.
Use Case:
For example, a premier company specializing in technology services, utilized analytics automation to analyze 250 broadcast campaigns, resulting in an 88% time savings and a 25% increase in time spent on advanced analytics. The right automation tools not only generate fast results but also ensure you're ready for future growth.How Alteryx Helps:
• Quick Implementation: Start generating insights rapidly with intuitive tools that require minimal training. Alteryx’s user-friendly interface means your team can hit the ground running without lengthy onboarding sessions. • Future-Ready Integration: Alteryx seamlessly integrates with cloud services, AI platforms, and advanced analytics tools, ensuring your marketing strategy evolves alongside technological advancements. • Comprehensive Analytics Suite: From spatial analysis to text mining, Alteryx provides a wide range of analytical tools that help you address complex business questions and prepare for emerging trends.
How Marketing Teams Can Benefit from Alteryx
With Alteryx, marketing teams can benefit from:
• Self-Service Analytics: A user-friendly, drag-and-drop interface, you can easily access and analyze data without technical expertise.
• Pre-Built Analytical Tools: Utilize pre-configured tools for market basket analysis, spatial analytics, and more without needing custom development.
• Seamless Integration: Integrate Alteryx with your existing marketing tech stack for a cohesive, end-to-end analytics solution.
Alteryx+ Beinex Offerings
Our Premier partnership with Alteryx empowers business users to automate manual data cleansing and transformation tasks in minutes through a simple visual workflow while incorporating the latest technological advancements.
Connect with us for a free demo: https://beinex.com/alteryx-partner/

Techniques in Advanced Analytics: Ten to Tango!
Organisations take advantage of advanced analytics using the techniques given below:
Data Mining
Data mining is extracting useful information from large, raw chunks of data to find trends, plan new business strategies, increase revenue, decrease costs, reduce risks and enhance customer relationships. It establishes relationships and finds patterns and correlations to detect dangers and frauds and to make a profit out of businesses.
The data mining process constitutes many steps like the following:
- Identifying the data needed for the company's purposes*
- Preparing and assembling data to find remedies,
- Evaluating data models
- Deploying the results to make the right decisions
Sentiment Analysis (Opinion Mining)
Sentimental Analysis technique is used by businesses to detect emotion or feelings in textual data. It categorises the tone of writing as positive, negative or neutral. Organisations are benefitted in many ways by aiding in crisis prevention and understanding and analysing customers' opinions about their particular products or services. The companies monitor online conversations to learn about the customers' tastes, needs, and expectations.
Sentiment analysis' fully automated tools assist businesses in extracting information from unstructured and unorganised material found on the internet, such as blog posts, email, webchats, social media channels, and comments.
Cluster Analysis
It's a popular data-mining technique that matches unstructured data fragments based on commonalities discovered between them. Cluster analysis is instrumental for companies to identify different consumer groups and sales transactions or detect fraud. It is used in Machine Learning, image analysis, pattern recognition, information retrieval, data compression, bioinformatics and computer graphics.
Cluster analysis is a powerful data-mining tool for any company that wants to recognise discrete groupings of consumers, sales transactions, or other types of behaviours and things. Insurance firms use cluster analysis to identify fraudulent claims, and banks use it for credit scoring.
Retention Analysis
Studying user analytics to determine how and why consumers churn is known as retention analysis (or survival analysis). Retention analysis is crucial for learning how to keep a lucrative client base by increasing retention and new user acquisition.
You'll learn the following things if you do a retention analysis regularly:
- Why are customers leaving?
- When clients are more prone to abandon a purchase.
- The impact of churn on your bottom line.
- How to make your retention strategies more effective.
Customer retention is a crucial practice in every business; companies can quickly decrease churn rates and increase customer satisfaction by tracking and taking advantage of customer behaviour.
Complex Event Analysis
Complex data analytics is the application of complex algorithmic approaches to effectively process huge unstructured data volumes. Computers perform data analysis; this was done mainly by individual machines acting on well-defined data structures in the past. This method uses technology to forecast high-level occurrences that are likely to occur due to a series of low-level factors.
This technique is often employed in the following scenarios:
- Stock market trading: To recognise the stock price, compare it to a pattern, and prompt the proper buying/ selling response.
- Predictive maintenance: Used by manufacturing facilities to collect data regularly to see any trends and signal the need to shut down equipment for predictive maintenance.
- Real-time marketing: This allows marketers to spot trends in consumer behaviour, giving personalised offers to customers in real-time.
- Operation of autonomous cars: It determines when to perform specific actions like spotting a stop sign in the distance, calculating the space, and selecting a deceleration rate to assure complete stopping at the movement.
Predictive Analysis
Predictive analysis is a technique used to analyse data and forecast the possibility of an event occurring in the future, allowing businesses to plan. It uses historical data combined with statistical modelling, data mining techniques and Machine Learning to predict risks and opportunities. Predictive analysis uses a scientific approach to forecast the future with a high degree of accuracy.
Predictive analytics improves corporate performance in a variety of ways:
- Optimisation of marketing campaigns: Useful in forecasting consumer reactions to changes in product offerings and in assisting a company in determining the best ways to attract and retain customers.
- Streamlined operations: It helps to manage resources as needed, such as storing inventory to keep storage expenses low or recruiting additional temporary personnel during peak times to save money on HR. This aids in streamlining the company's operations, resulting in increased efficiency and lower expenses.
- Enhanced cybersecurity: Assist to discover anomalies and patterns in real-time, allowing fraud or other persistent threats to be identified and addressed.
- Reduced risk: It helps to examine and predict whether your buyer will pay you on time. Predictive analysis can be performed using a prediction algorithm to calculate the buyer's credit score based on creditworthiness.
Machine Learning
Machine Learning is a crucial part of the AI subset of advanced analytics. This advanced analytic tool uses computational approaches to find patterns in data. It then uses them to build statistical models that can produce solid results without human participation. It falls into the following categories:
Supervised learning: The more common type of Machine Learning is supervised learning, which uses labelled data sets to allow you to search for specific patterns in the data. It requires vast datasets for the process; the more the amount of data, the more chances of getting accurate results.
Unsupervised learning: It employs various methods to find patterns and correlations in a subset of data. On the other hand, these algorithms are unable to recognise specific data sets, but they sort the information based on similarities and anomalies. However, it is applied in cybersecurity to find patterns from data.
Semi-supervised learning: It combines the benefits of supervised and unsupervised learning approaches. This technique uses unlabelled and labelled data to help the systems understand the challenge. The labelled data set is then utilised to aid in the model's training, with the results being used to mark the remaining unlabelled data. When all of the data has been labelled, the model is trained on it.
Reinforced learning: A relatively new advancement in Machine Learning, a reinforcement learning algorithm learns and develops to achieve a specific goal through trial and error. It tries out numerous choices before using rewards or penalties to help it make the best decision to achieve the goal.
Data Visualisation
Data representation in a visual or graphical style is known as data visualisation. It allows decision-makers to see analytics visually, making it easier to grasp complex topics or spot new patterns. Data visualisation aids in telling tales by transforming data into a more understandable format and showing trends and observations. A good visualisation tells a story by reducing noise from data and emphasising the essential facts. The common types of data visualisation include charts, tables, graphs, maps, infographics and dashboards.
It helps the businesses in the following ways:
- To determine which areas require attention or improvement.
- To determine which elements have an impact on customer behaviour.
- Assist in deciding which products to place where.
- Help to estimate sales volume.
Cohort analysis
Cohort analysis is employed to analyse the data and group it based on shared user behaviours during a specific period. It is a beneficial technique for boosting customer retention and happiness. By analysing behavioural patterns, it is possible to gain valuable information about what type of campaign is most likely to be successful, which customer group is most likely to buy your goods, and their expectations from a product. Cohort analysis can bring several advantages to a company:
Increased Customer Lifetime Value (CLV): Cohort analysis' capacity to assist a firm in improving client retention improves the CLV, which is the total money a business generates from a customer throughout their relationship.
Stronger relationships with loyal customers: Cohort analysis helps you discover your most loyal customers, allowing you to target them more precisely and encourage them to stay with you for as long as possible.
Better testing of new designs: In most cases, tests cannot predict how well a new design of a product will perform in the market. With the aid of cohort analysis, generate a cohort based on interactions with the latest design and compare it to the conversion rate of those that haven't.
Regression Analysis:
It is a powerful statistical method used to estimate the link between dependent (outcome) and independent (features) variables. The goal of regression analysis is to figure out how one or more factors may influence the dependent variable to spot trends and patterns. It is crucial for projecting future trends and generating forecasts.
To perform a regression analysis, you must first establish a dependent variable that you believe is influenced by one or more independent factors. After that, you'll need to create a comprehensive dataset to work with. Using surveys to get data from your target consumers is a great way to get started. All of the independent variables you are interested in should be addressed in your survey.
Different sectors like banking, insurance, retail, pharmacy, e-commerce and others used regression techniques to yield valuable, actionable business insights.
Advanced Analytics gives companies a greater understanding of data patterns and behaviour, allowing them to forecast future actions. It provides a substantial strategic advantage by revealing new business prospects and potential innovations, a deep awareness of customer and employee behaviours, fresh ways of looking at existing problems, and operational improvement opportunities, increasing revenue or lowering costs.Advanced Analytics analyses information from various data sources using predictive modelling, Machine Learning, and business process automation.

Governing Agentic AI: How Organizations Can Balance Autonomy, Risk, and Accountability
Agentic AI is redirecting AI to autonomous systems that can plan, decide, and execute tasks independently. These AI agents can manage workflows, interact with software systems, and trigger actions without continuous human input. While this autonomy promises efficiency and scalability, it also introduces new governance challenges.
Research shows that 86% of enterprises expect higher risk levels with agentic AI, yet only 2% of organizations currently meet responsible AI standards. This gap highlights a critical reality: organizations must adopt a structured agentic AI governance framework to balance autonomy with accountability.

All You Need to Know About Tableau Filters: Types of Filters in Tableau
Tableau filters allow their users to perform simple filtering using available metrics, as well as perform advanced filtering using complex calculations. While developing dashboards, Tableau offers the flexibility to view different types of filters such as drop-down filters, wildcard filters, list filters and many more. To enhance dashboard interactivity, Tableau has provided “Filter Actions” which allow users to filter an entire dashboard as per the value selected by the user in a particular visualization.
To create a filter that suits the user's requirements, Tableau engages several filtering techniques which also enhance data processing efficiency Each filter is designed for a specific function, and the order in which they are run can significantly impact performance.
6 Types of Filters in Tableau
Tableau employs six different types of filters, which are listed in the sequence of execution:
- Extract Filters
- Data Source Filters
- Context Filters
- Dimension Filters
- Measure Filters
- Table Calculation Filters
1. Extract Filters
Extract filters are utilised during the initial stage of data filtering. When datasets are uploaded to Tableau, we can utilise the extract filter to minimize the number of Tableau queries for the data source. By applying filters to the extract, we can further decrease the size of the data.
2. Data Source Filters
Data Source filters sort out any crucial or sensitive information while putting data into Tableau. It is compatible with both the Live and Extract connections.
We can add the data source filter to any column by selecting the ADD option. After selecting the ADD option, the ADD Filter dialogue box will appear, displaying all the fields. We can then select the field to which we wish to apply the filter and it is possible to change or delete data source filters as needed.
3. Context Filters
A context filter is generally used when we require this filter to be applied before any other filter. It has the potential to enhance the performance of massive data sources. They are made by dragging the dimension to the filter section box and selecting the Add to context option. This will make the dimension pill change its colour to “Grey”, indicating it is a context filter. Similarly, by clicking "Remove from Context", the filter becomes a simple dimension filter. A common use case for this filter would be when a user would like to find the top N products in any category.
4. Dimension Filters
Dimension fields include discrete categorical data, and we can remove or add the values we want to investigate. The process is simple as outlined below:
Step 1: Drag the dimensions from the dimension list to the filter section box.Step 2: From the Filter Dialog box, select the values that we want to analyze.
The Filter dialogue box contains four tabs:
- General: To select the members present in the dimension to either include or exclude
- Wildcard: To filter the result based on a particular pattern
- Condition: To filter the result based on a particular condition
- Top: To filter the Top N products belonging to a particular category.
5. Measure Filters
Measure filters are applied to the measure fields, which have quantitative data. It can be used as follows:- Drag the measured field from the Measure box to the Filter area
- Filter dialogue box with several functions will appear.
- Select the operation that needs to be performed and click Next.
In the subsequent dialog box, there are 4 types of filters:
- Range: To select the range of values to include in the result.
- At least: Select the minimum value of a measure to filter the data.
- At most: To select the maximum value of a measure to filter the data.
- Special: To select null or non-null values.
6. Table Calculation Filter
Table Calculation Filters, being the last type of filters to be executed in the sequence of execution, do not filter out the underlying data. It is mostly used to filter out contents in the current view. Table Calculations are functions that are utilised for building Calculated Fields like LOOKUP, WINDOW SUM, WINDOW AVG, and so on.Summing Up
Tableau Filters are the most commonly used feature by many organizations. It allows the clients to filter out confidential data and allows them to provide controlled view access to different internal users so that only data relevant to the user is accessed. Filtering out data means data processing becomes more efficient, which in turn makes the report generation process faster which in turn helps the organization arrive at quick and insightful business decisions.Use Cases Addendum
Let’s find out how Tableau filters work to solve various tasks :Use Case 1:
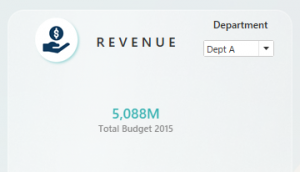

A simple drop-down filter can be used to filter the view of our requirements as shown in the visualization above.
In this example, Dept A has been selected such that the Total Budget is shown only for Dept A. Once we select Dept B, the Total Budget shows the respective value for Dept B
Use Case 2:

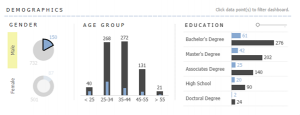
In the visualizations above, we can see the customer demographics related to gender, age group and educational status. With the help of Tableau’s Filter Actions, one can click on a particular segment and filter the rest of the visualizations as per the requirement.
For example, if we require to find how many customers in the age group of 35-44 are males, all we have to do is to click on the doughnut chart for “Male”, and the visualizations will show only the data for males. Now, we can find that the number of male customers in the age group of 35-44 is 272.
Use Case 3:
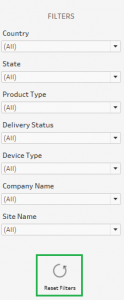
The Filter Action feature in Tableau can be leveraged to develop several creative solutions for customers. One such solution is the “Reset Filter” as shown in the above visualization.
With a combination of filters and filter actions, one can develop a reset filter that, on clicking, would reset all the currently applied filters on the dashboard and bring it back to its original unfiltered view. This comes in handy if the dashboard consists of multiple visualizations and contains heavy data.

Top 6 AMS Best Practices to Boost AWS Cloud Security in 2025
What is AWS Managed Services (AMS)?
AWS Managed Services (AMS) is a fully managed service that helps businesses run AWS environments at scale. It adheres to industry best practices for operational excellence, security, and compliance.
• Key Benefit of AWS: AMS enables your company to spend less time managing the complexities of cloud operations and more time focusing on business outcomes.
AMS handles:
• Infrastructure Management: Includes continuous monitoring, patching, and lifecycle management of your AWS resources.
• Security & Compliance: Generates automated compliance checks against NIST, PCI-DSS, GDPR, and HIPAA frameworks.
• Operational Support: 24×7 incident response, backup, disaster recovery, and governance.
• Automation & Optimization: Uses custom runbooks and built-in AWS features to reduce manual labor.
Why AMS Matters in 2025
Cloud adoption is growing, but so is the risk associated with it. Even though many businesses:
• Lack 24/7 monitoring.
• Struggle with regulatory audits.
• Depend on manual vulnerability patching.
AMS offers solutions to mitigate the risks associated with cloud adoption. It resolves the issue by utilizing automation, continuous monitoring, and best practices from AWS. You can implement AMS at scale, without overloading internal teams.
Top 6 AMS Cloud Security Best Practices
1. Prevention: Stop Threats Before They Happen
• Identity & Access Management (IAM): AMS provides real-time validation of modifications, enforces least-privilege policies, and automatically corrects deviations.
• Network Security: AMS configures AWS WAF, Firewall Manager, and Network Firewall to block malicious traffic.
• Patch & Vulnerability Management: AMS automates scanning and patching, including zero-day threats, with Systems Manager + Inspector.
• Backup & Disaster Recovery: With recovery testing and ransomware prevention, AMS fortifies AWS Backup & DRS.
2. Detection: Spot Threats in Real Time
• GuardDuty & Macie: Sensitive data is protected, and anomalous activity is detected.
• Security Hub: Assists with noise reduction, alert aggregation, and issue prioritization.
3. Monitoring & Incident Response
• 24×7 global monitoring with NIST-aligned runbooks.
• Automated incident response using Systems Manager + CloudWatch.
• Integrations with ServiceNow, Jira, Slack, and Teams for faster collaboration.
4. Compliance Made Simple
Adhering to compliance frameworks such as HIPAA, PCI-DSS, SOC, GDPR, and NIST is complex for all companies. AMS embeds compliance controls from day one.
• Continuous Compliance Monitoring: Automated checks via AWS Config rules.
• Audit Trails: CloudTrail & Athena queries for reporting.
• Certified Services: AMS itself is compliant with major frameworks.
5. Governance & Reporting
• Resource Tagging: For governance, cost allocation, and reporting.
• Self-Service Dashboards: Patch compliance, backup coverage, and incident stats.
• Monthly Business Reviews: Joint sessions with Beinex + AWS experts.
6. Security On-Demand: Flexibility When You Need It
AMS Operations on Demand (OOD) lets you scale support instantly for:
• Emergency vulnerability remediation.
• Legacy OS upgrades.
• Firewall operations.
Why You Should Opt for AMS Security?
AWS provides the platform. AMS provides the tools. It ensures:
• Faster ROI → measurable security improvements within 6–12 months.
• Local + Global Expertise → deep knowledge of GCC regulations + AWS global best practices.
• End-to-End Ownership → from planning to monitoring, audits, and response.
Secure Your AWS Cloud with Beinex
Beinex’s Cloud Engineering Services help organizations maximize their AWS investments through robust security frameworks and modernization strategies.
Our Core Offerings Include:
• Cloud Security
• Security Assessment
• Strategy & Implementation
• Well-Architected Review
• Migration & Modernization
• Cloud Migration
• Cloud Automation & DevOps
• Infrastructure Modernization
Whether you are in the early stages of cloud adoption or looking to optimize your existing AWS, we help you achieve your cloud goals.
Connect with us: https://beinex.com/cloud-engineering