How AI Decision-Making is Improving Enterprise Outcomes
Blog
Share 
Employee Churn Prediction Model: Experience Certainty in HR Matters
 29 July 2022
  Sumi S
 Many businesses make a concerted effort to create work cultures that increase job happiness, encourage people to find meaning and satisfaction in their work, reward and recognize employees for their actions, and foster both personal and professional growth.
While many tactics are adopted for the company’s benefit and to considerably increase retention, leaders cannot rely only on them. They must face the uncomfortable reality that they will eventually lose significant talent if they do not keep an open mind and a realistic outlook on the future. Influential leaders act daily to safeguard themselves, their teams, and their companies from the risk of attrition because wishful retention thinking is not a viable business strategy.
Is it possible to foresee attrition so that it only impacts the business a little less, given that it is impossible to stop employees from leaving? Well, with the help of technology, it is possible. The churn model, among others, can help in this situation. Are you wondering how? Through an employee churn prediction model, we can make it happen. After understanding which employees are on the verge of leaving using the churn model, it is possible to reach out to them and understand their grievances.
Employee Churn Prediction Model
It's a predictive model that calculates the likelihood (or vulnerability) of each employee leaving. It tells us how likely we will lose employees or a specific employee in the future at any given time. It classifies employees into two groups (classes): those who quit and those who don't. It will typically tell us the probability of the employee belonging to which of the groups in addition to placing them in one of the two groups. Thus, a churn model can be used to estimate the chances of resignation.
Explaining the Model
Modern churn models frequently draw their foundation from machine learning, more specifically from binary classification methods. There are several of these algorithms; therefore, it's important to test which one works best in each circumstance. Here we have made use of four machine learning models:
Random Forest
Supervised machine learning algorithms like random forest are frequently employed in classification and regression issues. On various samples, it constructs decision trees and uses their average for classification and majority vote for regression.
The Random Forest Algorithm's ability to handle data sets with both continuous variables, as in regression, and categorical variables, as in classification, is one of its most crucial qualities. In terms of classification issues, it delivers superior outcomes.
KNN
One of the simplest machine learning algorithms, based on the supervised learning method, is K-Nearest Neighbour. The K-NN algorithm assumes that the new case and the existing cases are comparable, and it places the latest instance in the category that is most like the existing categories.
A new data point is classified using the K-NN algorithm based on the similarities after storing all the existing data. This means new data can be quickly and accurately sorted into a suitable category using the K-NN method. Although the K-NN approach is most frequently employed for classification problems, it can also be used for regression.
Decision Tree
The supervised learning algorithms family includes the decision tree algorithm. The decision tree technique, in contrast to other supervised learning methods, can handle classification and regression issues.
By learning straightforward decision rules derived from previous data, a Decision Tree is used to build a training model that may be used to predict the class or value of the target variable (training data).
Support Vector Machine
One of the most well-liked supervised learning algorithms, Support Vector Machine, or SVM, is used to solve Classification and Regression problems. However, it is employed mainly in Machine Learning Classification issues.
The SVM algorithm's objective is to establish the best line or decision boundary that can divide n-dimensional space into classes, allowing us to quickly classify new data points in the future. A hyperplane is a name given to this optimal decision boundary.
SVM selects the extreme vectors and points that aid in creating the hyperplane. Support vectors representing these extreme instances form the basis for the SVM method.
A Step-By-Step View of the Process
Step 1: Loading data to databricks
In the initial stage, CSV data collected are loaded to the churn model. Any type of data sets can be employed here depending on the situation.
Step 2: Transformation: converting to the requisite format
While uploading, objective data sets are transformed into integers.Step 3: Feature selection
There are four feature selection algorithms from which we take the best one to filter out undesired features. The selection of filtering features differs for each type of data based on the algorithm.Step 4: Splitting the data
After the feature selection, the next step is to split the data for training and testing—then divide the data into a 7:3 ratio. In the training set, we train our model with data to understand the attrition patterns and later test it with data in the testing set.Step 5: Standardisation
In this step, data is converted into a standard format that allows for large-scale analytics.Step 6: Model selection
During model selection, datasets are provided to the machine algorithms like Random Forest, KNN, Decision tree and Support vector machine. Each algorithm produces its own sets of accuracy values; from that, the most accurate predictions are selected. Using the same procedure, we can categorize the employees into groups, for example, those who are planning to resign and those who are not.
Step 7: Result generation
The result is built on how each machine learning model performs with the dataset. The accuracy value depends on the performance of each model—the higher the accuracy, the higher the probability of accurately predicting the outcomes for each employee.In today’s competitive corporate world, unwanted attrition is a regrettable but unavoidable truth. It is a haunting and depressing nightmare for many business leaders worldwide. The sudden quitting of great performers moving their skills to another enterprise is one of the things that irks leaders the most. Employee engagement initiatives are therefore often used to retain the best. But still, it is not a fool-proof strategy.
Related Articles

Analytics Automation: How It Can Transform Modern Businesses
What is Automated Analytics?
Think about your day's tedious tasks: organizing, cleaning, and formatting data. These repetitive processes are ripe for automation, and that's where automated analytics shines. Automated analytics combines the power of software and AI, including machine learning (ML) and generative AI, to streamline the analytics lifecycle. Diverse systems like data warehouses, analytics platforms, and reporting tools can be connected with it into an integrated, end-to-end workflow. It also saves time and improves productivity and accuracy, turning raw data into actionable insights more accessible than ever.Key Forms of Automated Analytics:
- Automated Machine Learning (AutoML): With low-code or no-code platforms, model creation is simplified, enabling faster deployment of predictive models. From defining problems to fine-tuning models, AutoML handles every step with ease.
- Generative AI: Adds a creative edge by automating documentation, generating summaries, and crafting stakeholder-ready presentations.
- ETL Automation: Platforms like Alteryx automate data ingestion, transformation, and reporting, allowing you to build workflows once and let them run indefinitely.
- Business Intelligence Automation: Enhances visualization and dashboarding by automatically surfacing insights and generating interactive reports.
Top Benefits of Automated Analytics
Analytics automation is indispensable, enabling organizations to tackle challenges at scale while maintaining agility and precision.
The top benefits of analytics automation are listed below:
Efficiency
Analytics automation significantly reduces the time required for data collection, preparation, and analysis. Automating daily tasks helps data professionals focus on deriving meaningful insights that drive business growth.
Improved Accuracy
Human error is a common pitfall in manual data handling, but automation ensures consistent logic and precision while safeguarding data quality and reliability.
Real-Time Insights
Gone are the waiting weeks for reports. Automated analytics deliver frequent updates, allowing businesses to respond swiftly to trends and opportunities.
Streamlined Scalability
Automation provides the flexibility to scale processes without additional resources as your data grows. Whether adding data sources or increasing analysis frequency, automation adapts seamlessly.
Empowered Decision-Making
Automated analytics empowers decision-makers with timely, accurate insights, ensuring they always have the information to steer their organizations forward.
Foster Collaboration
Cloud-based solutions promote teamwork by making workflows accessible and lowering barriers to advanced analytics like machine learning.
Getting Started with Analytics Automation
Your organization can get started with analytics automation with little hassles. Here's a roadmap to guide your journey:
- Define Your Objectives: First, identify the challenges you aim to solve with automation, whether it's optimizing data prep, deploying machine learning models, or improving reporting efficiency.
- Choose the Right Tools: Secondly, choose a solution that aligns with your goals and integrates with your existing infrastructure. Always go for enterprise-grade platforms that offer robust security and scalability.
- Gather Relevant Data: Always ensure you have access to suitable datasets, e.g., from CRM systems, social media analytics, or financial platforms, and prepare them for automation.
- Implement and Optimize: Finally, start with automating specific workflows, then expand to more complex processes. Continuous improvement will reveal even greater efficiencies over time.
Real-world applications of Analytics Automation
- Demand Forecasting: Retailers leverage automation to predict future demand by connecting historical sales data, blending it for analysis, and creating predictive models and all without manual effort.
- What-If Analysis in Financial Forecasting: Financial professionals can harness greater accuracy and flexibility with automated scenario modeling. It reduces errors and accelerates decision-making.
- Month-End Close: By automating data preparation, validation, and reporting, you can easily simplify the reconciliation process, allowing accountants to focus on strategic financial analysis.
Take the Leap with Analytics Automation
Analytics automation isn't just a tool; it's a transformative approach to data-driven decision-making. Whether you're a data analyst, scientist, or business leader, automation opens new possibilities, allowing you to work smarter, not harder. With platforms like Alteryx, you can automate the entire analytics lifecycle, from data prep to visualization, and transform how your organization handles data. Start automating today and redefine what's possible for your business.
Alteryx+ Beinex Offerings
Our Premier partnership with Alteryx empowers business users to automate manual data cleansing and tasks in minutes through a simple visual workflow while incorporating the latest technological advancements. Connect with us for a free demo: https://beinex.com/alteryx-partner/

Agentic AI and Enterprise Intelligence: Leading Trends, Challenges, and Opportunities in 2026 and Beyond
For a long time, enterprise intelligence relied on dashboards, reports, and predictive systems. These tools helped leaders see what happened and predict what could happen next. However, the users still had to interpret the results and act on them themselves.
Now, that approach is changing with the adoption of Agentic AI. According to Gartner research, 40% of enterprise applications are expected to include task-specific AI agents by 2026, up from less than 5% in 2025.

Top Frauds and Financial Crimes in Banking: An Examination of Modern-Day Scandals
As financial systems become increasingly complex, fraud methods evolve accordingly. This blog covers the different types of digital banking fraud, including the fundamentals, emerging digital trends, global trends, and regulatory responses. Additionally, the blog highlights some of the most infamous bank fraud and financial crimes that reveal weaknesses in the financial system, serving as strong reminders of why constant vigilance in money is essential.
Understanding What is Bank Fraud
Bank fraud and financial crimes have affected economies worldwide, and the Middle East is no exception. From cyberattacks to fake loan applications, fraud comes in different forms. They target businesses, individuals, and financial institutions. Banking fraud includes deceitful practices designed to gain unauthorized access to money, financial assets, or confidential information, bringing huge financial losses to banks and damaging their reputation. Fraudsters are evolving, making it a necessity for banks to adopt proactive strategies in fighting financial crime. Several top-class fraud cases and money laundering scandals reveal weaknesses in banking regulations, which lead to fiscal instability and loss of trust. With the advances in technology, traditional fraud has taken new digital forms. Let’s examine the major types of digital banking fraud today.
Different Types of Digital Banking Frauds
Financial crimes in banking have become a significant concern, making it crucial for banks to adopt AI-driven technologies to tackle the threats. Let’s look at some of the different types of digital banking frauds: Identity Theft & Account Takeover: Fraudsters steal private information like credit card details, passwords, and social security numbers to get unauthorized access to accounts and make fund transfers and purchases. Mule Accounts & Money Laundering: Mule accounts are operated by money mules recruited by fraudsters or money launderers to transfer illicit funds while masking the identity of the true beneficiary. Scammers use mule accounts in the money laundering process to move money across different accounts, countries, or currencies, making it harder to detect. Phishing: It involves misleading individuals into disclosing sensitive information or executing specific actions that compromise their accounts. Fraudsters pose as legitimate organizations using emails, phone calls, or texts, creating a sense of urgency to prompt victims into action. Malware & Trojans: They are malicious software that, when installed on a customer's device, extracts confidential and private data. It enables fraudsters to control customers' online activities and access their devices remotely. Mobile Banking App Fraud: This happens when fraudsters create fake mobile banking apps imitating the real app to steal information. People usually fall into the trap of these fake apps by downloading from app stores or through phishing emails. Social Engineering Scams: It is a digital banking fraud that psychologically manipulates customers by tricking them into providing sensitive information through phishing emails, phone calls, or text messages that appear legit. There are different types of digital banking fraud, including online banking password theft, ATM skimming, digital wallet fraud, SMS, and text message fraud. Other types of financial fraud include mortgage fraud, loan scams, money laundering, employee fraud, Ponzi schemes, investment fraud, etc. While the above-mentioned digital fraud types are prevalent, fraud continually evolves, leading to new trends.What’s Next? The Emerging Trends in Financial Crime You Need to Know
As new technologies emerge, fraudsters get smarter, and financial crimes evolve rapidly, becoming more sophisticated. Here are some of the key rising trends in fraud. AI-Generated Phishing: Cybercriminals harness AI to create persuasive phishing emails and messages, imitating context, tone, and communication patterns, making them even more difficult to detect. Deepfake-Enabled Scams: With the accessibility of deepfake technology, scammers now create hyperrealistic images, videos, and audio to impersonate bank officials and executives to authorize fake transactions, scheme employees into sharing confidential data, etc. Crypto-Related Frauds: Cryptocurrencies have opened up new roads to illicit financial activities like money laundering, crypto wallet thefts, etc., targeting beginners and seasoned investors. As much as AI helps prevent financial fraud, it also enables cybercriminals to handle such crimes. From automating attacks to tailoring scams to individual targets to evading fraud-detection systems, scammers could misuse the power of AI to extort huge amounts of money from financial institutions and individuals. However, AI can effectively serve as a critical line of defense for banks. Here are some examples of how AI helps prevent crimes and outsmart cybercriminals. Pattern Recognition: To identify anomalies and hidden fraud patterns by analyzing extensive datasets through machine learning models. Real-Time Monitoring: To detect unusual behavior and flag suspicious transactions faster. Biometric Authentication: To verify identities more accurately through voice ID, facial recognition, and behavioral biometrics. AI in KYC: To perform transaction monitoring, customer identification, and risk mitigation faster and more accurately using automated algorithms. Anti-Money Laundering, Driven by AI: To reduce false positives, detect patterns and anomalies in real-time, and boost compliance and risk management efforts.Some Banking Scandals That Shook the System: Indicators Why Fighting Financial Crimes is Necessary
According to a survey by Visa, Dubai Police, and Dubai Economy (DED), 39% of UAE consumers reported being targeted by online fraud. Of these, 27% fell victim to phishing attacks, 19% experienced credit card fraud, and 17% were affected by counterfeit goods.[Reference Link: https://www.arabianbusiness.com/industries/banking-finance/466063-cashs-popularity-subsides-even-as-online-fraud-rises ] Here are a few major bank fraud and financial crimes that happened in the Middle East. 1. A major private equity firm in the UAE collapsed in 2018 due to financial fraud. The investors' funds, including money for health projects, were misused, resulting in billions of losses, legal action, and increased control of private equity regulations in the region. Key Takeaways: • Financial transparency and accountability are paramount to building investor trust.
• Continuous auditing and meticulous review must be implemented to prevent mismanagement of funds. [Reference Link: https://www.bloomberg.com/news/articles/2019-08-07/what-s-been-learned-who-s-charged-in-abraaj-collapse-quicktake ] 2. A prominent business group in KSA orchestrated one of the largest financial frauds in the region, securing billions of dollars from the bank using fake documents and fraudulent loans. The scandal has sparked a legal battle and led to economic instability in the region, highlighting the importance of stronger risk management for lending practices. Key Takeaways: • Effective risk management is pivotal in preventing fraud.
• Implementing robust verification processes aids in comprehensively validating documents and loan requests. [Reference Link: https://www.news24.com/Tycoon-up-for-10bn-theft-20090718 ] 3. A huge corruption scheme worth 11.5 billion riyals was exposed by Saudi authorities. The scam involved bank officials, business people, and expatriates. The investigation revealed that the bank employees took bribes from an organized gang, which included fake commercial entities and accounts used to transfer illicit funds abroad. The scheme exploited bank positions and led to financial fraud, resulting in significant losses and damaging the financial system's integrity. Key Takeaways: • Financial systems must ensure transparency and accountability and comply with anti-money laundering (AML) standards.
• Banks must implement effective internal controls and anti-corruption measures to prevent fraud and ensure employees act in the institution's best interests. [Reference Link: Saudi Arabia: Massive fraud worth SR11.5 billion uncovered ] Strengthening bank surveillance, enforcing stricter conformance measures, and promoting corporate accountability are important to prevent future financial crimes in the region.
Regulatory Responses to the Surging Financial Crimes in the ME
Banks need strict regulations to prevent bank fraud and financial crimes, including Anti-Money Laundering (AML), enforcement of customer requirements (KYC), and increasing supervisory authority. Financial crime in the Middle East reveals a key gap between banking regulations and risk management. While governments and supervisory authorities are taking steps to improve transparency, fraudsters continue to find new ways to use the system. Here's a quick overview of some of the regulations in the region:Central Bank of the UAE (CBUAE)
• Regulates banks, payment service providers, and finance and insurance companies at the federal level.• Supports economic growth and promotes monetary and financial stability through effective surveillance, careful reserve management, and policy development aligned with global best practices.
Abu Dhabi Global Markets (ADGM)
• Regulates diverse financial entities, including asset managers, brokers, hedge funds, financial advisers, investment firms, and insurance intermediaries.• Offers company registration and incorporation, different legal structures, regulatory support, and dispute resolution- all under a strong, advanced regulatory framework.
Saudi Arabian Monetary Authority (SAMA)
• Established robust regulations to safeguard KSA's financial sector's stability and security.• Key areas include anti-money laundering, consumer protection, cybersecurity, risk management, anti-money laundering (AML), and consumer protection. Besides these regulatory bodies, banks in the MENA region must adhere to global regulations such as Basel III, Anti-Money Laundering (AML) laws, and Know Your Customer (KYC) requirements. They must also comply with international standards, including Counter-Terrorist Financing (CTF), Financial Action Task Force (FATF), and Basel Committee on Banking Supervision. Is your bank equipped to stand up to modern fraud threats? Get a FREE AI-powered fraud resilience assessment from Beinex and identify vulnerabilities- before fraudsters do! Start a FREE Assessment NOW!

Geo Spatial Analysis Using Map Layers, Buffer Calculations, and Parameter Actions
For instance, the dashboard given below mirrors a project undertaken for a client seeking insights into the pandemic's impact on their business across specific areas. They wanted to determine the number of stores stocking their product within a defined radius, highlighting the local business impact amid the pandemic.
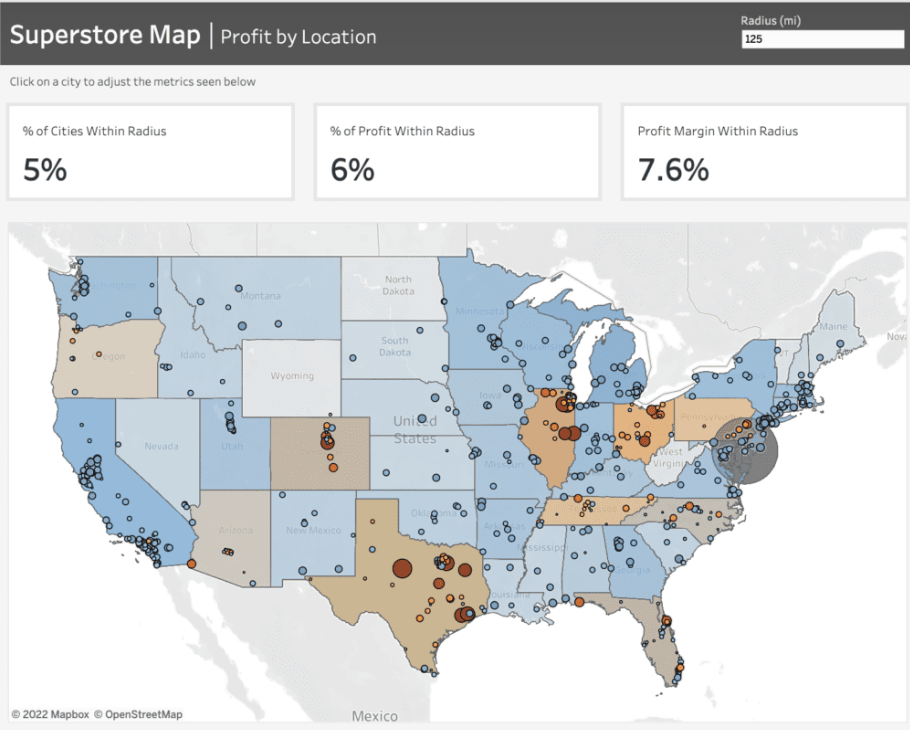 To craft the map showcased in this dashboard, we leverage Tableau's map layers feature introduced in version 2020.4. For further insights into this functionality, additional details can be found here.
Prior to initiating the map creation process, frequently refer to the Profit Margin field. Here's the calculation for this field: it computes the percentage of Sales that translates into Profit. This calculation enables us to gauge the profitability derived from our sales figures.
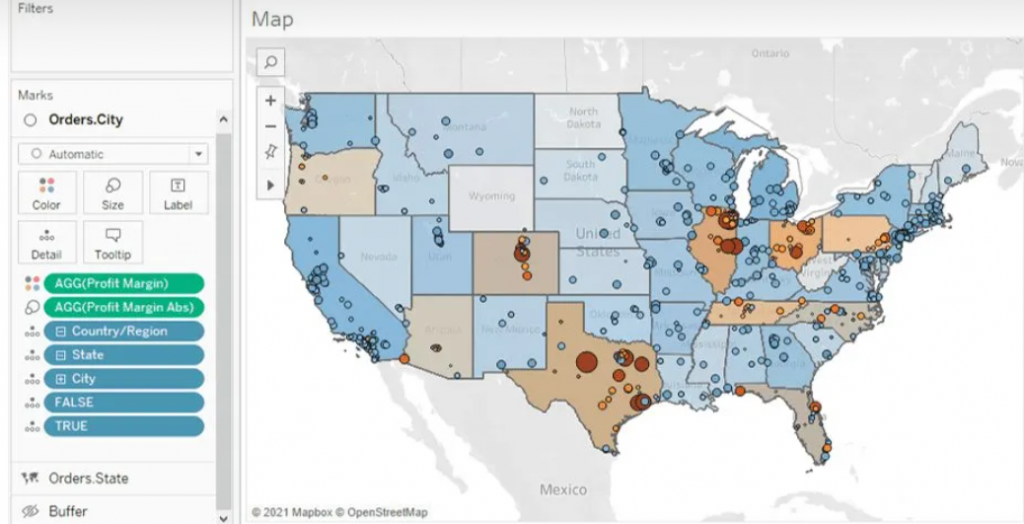
 For the States map layer, the State field is utilized and placed on the 'Detail' shelf. Each state is color-coded based on its Profit Margin.
Moving to the Cities layer, the City field is added onto the top left area labeled "Add a Marks Layer." To ensure the visibility of every city, the State level of detail is included as well. This accounts for cities existing in multiple states, displaying every city/state combination. Cities are color-coded using the Profit Margin field, with additional color based on the absolute value of the Profit Margin. This helps visualize the range and direction of profitability for each city.
Buffer Calculation
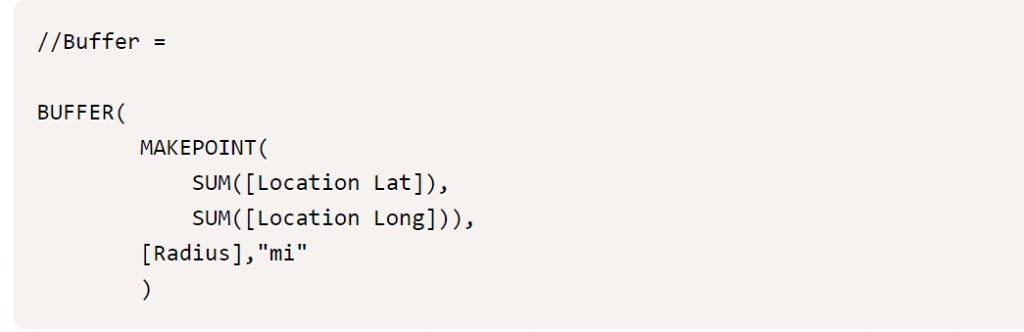
The Buffer calculation generates a radius, known as a "buffer," around a specific map point, defined within the syntax parameters. Here's the syntax breakdown for the Buffer: The initial part determines the center location, followed by the distance around the point, and finally, the chosen unit of measurement.
 To establish the desired centroid point, we employ the Makepoint function. This function simply utilizes latitude and longitude coordinates to generate a point on the map. Below is the calculation illustrating its usage.
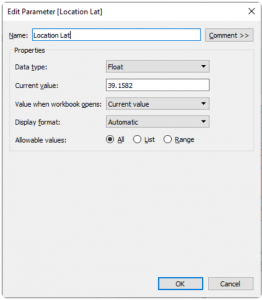
To achieve the interactivity you desire, you'll begin by creating three parameters: [Location Lat], [Location Long], and [Radius]. These parameters offer flexibility, allowing you to adjust them within the dashboard interface.
As you click on different cities, the [Location Lat] and [Location Long] fields dynamically change, altering the central point. Meanwhile, the [Radius] field, functioning as an input parameter, enables you to modify the radius distance according to your preferences. This setup grants you personalized control over these parameters directly within the dashboard.
With the creation of the final map layer field, you can now drag this field to the top left of the map and add it to the existing layers. Once done, you'll have all the map layers integrated into the map, allowing you to recreate the dashboard as depicted below. This comprehensive setup will mirror the dashboard layout and functionality.
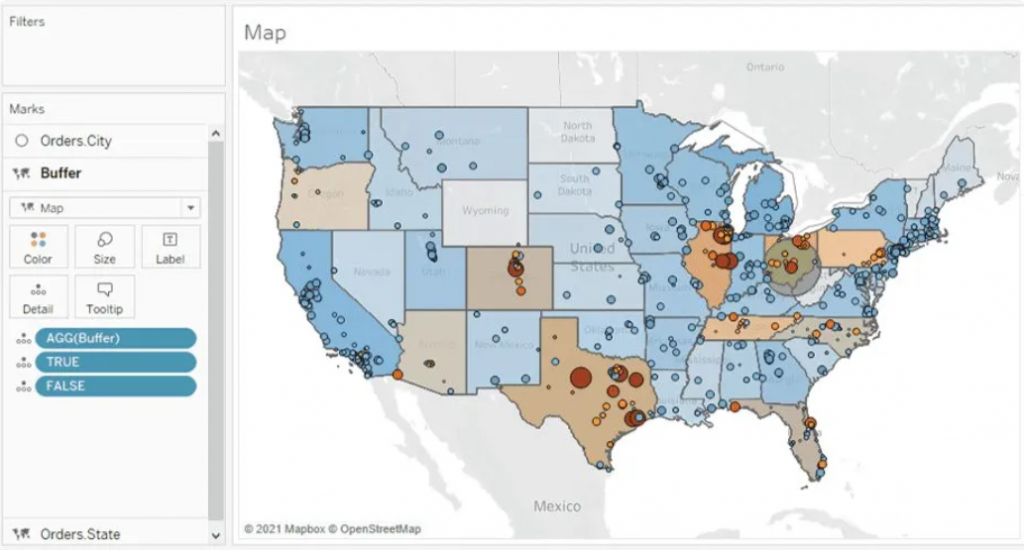
Parameter Actions
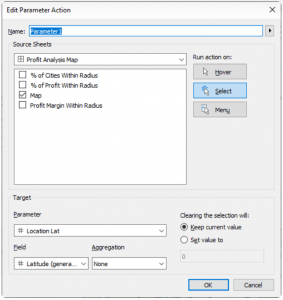
Parameter Actions are essential at this stage to ensure dynamic interaction within the map layers. By implementing parameter actions, we enable the Location Lat and Location Long fields to adjust dynamically when clicking on a city. This action directly affects the MAKEPOINT() field within the Buffer calculation, effectively altering the radius location. Below, you can observe the setup of the parameter action and how it facilitates this dynamic transformation.
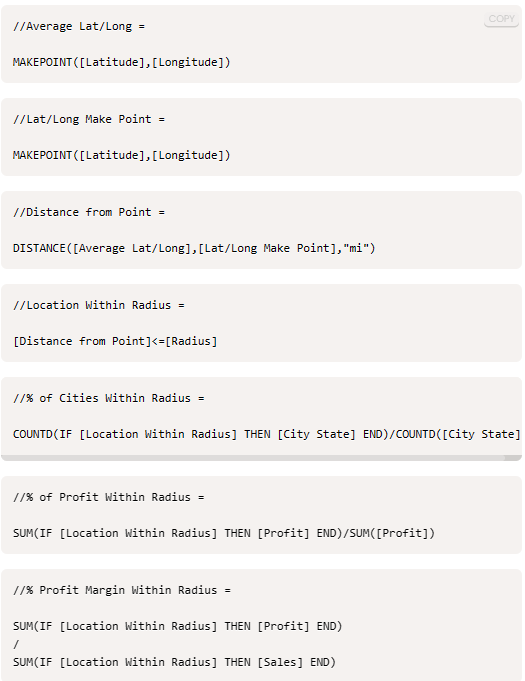
 Finally, we aim for these parameters to influence the available metrics showcased at the top of the dashboard. These metrics offer insights into the concentration of profit and profit margin within the selected radius. Below, you'll find the supporting calculations and the formulae for the metrics displayed on the dashboard. These metrics serve as indicators of profitability and profit margin concentration within the chosen radius.
Wrapping up, creating interactive data visualizations opens doors to explore and comprehend information, fostering informed decision-making and exploration of new analytical paths.
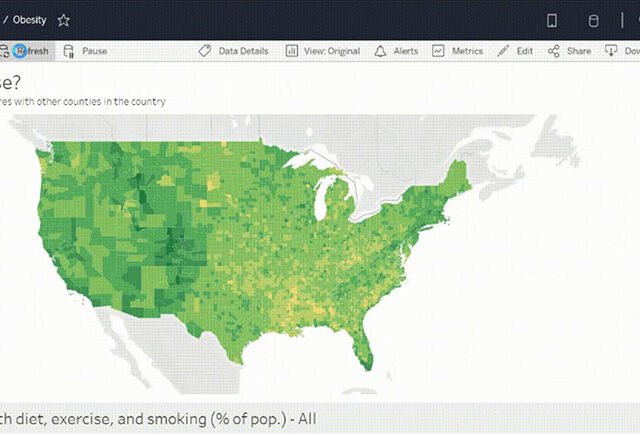
TABLEAU 2020.3 NEW FEATURES – TOP PICKS
I’ve always been a huge Tableau fan as they never fail to impress me by bringing out new exciting features in every release. Tableau has yet again released a new version after a thorough research based on people’s experience, thoughts, and comments.
As a result, Tableau 2020.3 has an exciting feature with respect to Predictive modelling functions, especially useful to advanced analytics geeks. There are so many other new features which everyone will appreciate – such as IN operator for calculations, Search improvements in data pane, Data quality warnings on Tableau Server and many more!
Here are my top picks from the list.
The IN Operator
The much-awaited feature for the SQL lovers. The IN operator is a shorthand replacement for multiple OR functions. By using IN operator, we will be able to create concise calculation fields instead of never-ending lines of ‘OR’.
Let’s look into a simple use case by assuming that I am interested to know the sales value of ‘Apple Products’ compared to all other products, then I can use IN operator to with IF statement to group the products to “Apple Product” and “Other Products”
IF [Product Name] IN (‘Apple iPhone 5′,’Apple iPhone 5C’,’Apple iPhone 5S’) THEN “Apple Products” ELSE “Other Products” END
Predictive Modelling Function
Now the predictive genes would be happy to see more features on the prediction module of Tableau. With the added advantages of the functions MODEL_QUANTILE and MODEL_PERCENTILE, now the prediction function goes beyond the existing trendline analysis. Both the functions will help to build a model that understands how your data is distributed around a best-fit line.
MODEL_QUANTILE is a table calculation that returns a target value at a specified percentile, based on other predictors MODEL_PERCENTILE is a table calculation that returns the probability of the expected value being less than or equal to the observed mark, based on other predictors
 Search improvements in Data pane
While developing business specific dashboards, we need to create several calculations and its needs to be adjusted or new calculations needs to be created from existing calculations as per the business unit’s requirements.
With the newly added Search improvement feature, our lives are made easy by searching or filtering specific filed based on field name, type, or comments.
Search improvements in Data pane
Write to external databases in Tableau Prep
Write to external databases in Tableau Prep
The wow moment for prep is here with the introduction of the ability to output to a database. In all previous versions of Prep, we have been able to write to an extract file or csv, and now from the latest 2020.3 introduces the ability to output to a database. Currently supported databases are SQL Server, MySQL, PostgreSQL, Amazon Redshift, Snowflake, Oracle, and Teradata.
As shown in the below example, result from the flow can be saved to a data base table from the output step by choosing “Database table” option, specify your server connection (with login credentials) , choose the data base and then the table.
And now, Write to database will power the analytics journey by helping to solve the issues related to, data sources, data security and data governance
Open or Upload Workbooks On The Web within Tableau Server
Sharing your work and exploring insights from others just got easier. You can now open a Tableau workbook or upload it straight to the web without having to use Tableau Desktop. Simply select the workbook (.twb or .twbx) you want to upload and publish directly to your site on Tableau Server or Online. Only users with the appropriate publishing permissions will have the ability to upload content.
Open or Upload Workbooks On The Web within Tableau Server
Three refresh options are available, they are
Earlier prep was used mainly for
Set Data Quality Warnings on Tableau Server
Data quality warnings make it possible to let users know when a data asset is flagged, whether because the data is under maintenance, it’s stale, or some other reason. With high visibility data quality warnings, not only let users know about the issue but make sure they do not miss it.
Are you interested in learning more about Tableau’s new features or the features? Are you a Tableau user and would like to become a Tableau Champion?
If the answer to the above questions is a big “YES”, Please contact us at training@beinex.com/ info@beinex.com and we would be happy to schedule a Tableau demo or training for you and your company.
Search improvements in Data pane
While developing business specific dashboards, we need to create several calculations and its needs to be adjusted or new calculations needs to be created from existing calculations as per the business unit’s requirements.
With the newly added Search improvement feature, our lives are made easy by searching or filtering specific filed based on field name, type, or comments.
Search improvements in Data pane
Write to external databases in Tableau Prep
Write to external databases in Tableau Prep
The wow moment for prep is here with the introduction of the ability to output to a database. In all previous versions of Prep, we have been able to write to an extract file or csv, and now from the latest 2020.3 introduces the ability to output to a database. Currently supported databases are SQL Server, MySQL, PostgreSQL, Amazon Redshift, Snowflake, Oracle, and Teradata.
As shown in the below example, result from the flow can be saved to a data base table from the output step by choosing “Database table” option, specify your server connection (with login credentials) , choose the data base and then the table.
And now, Write to database will power the analytics journey by helping to solve the issues related to, data sources, data security and data governance
Open or Upload Workbooks On The Web within Tableau Server
Sharing your work and exploring insights from others just got easier. You can now open a Tableau workbook or upload it straight to the web without having to use Tableau Desktop. Simply select the workbook (.twb or .twbx) you want to upload and publish directly to your site on Tableau Server or Online. Only users with the appropriate publishing permissions will have the ability to upload content.
Open or Upload Workbooks On The Web within Tableau Server
Three refresh options are available, they are
Earlier prep was used mainly for
Set Data Quality Warnings on Tableau Server
Data quality warnings make it possible to let users know when a data asset is flagged, whether because the data is under maintenance, it’s stale, or some other reason. With high visibility data quality warnings, not only let users know about the issue but make sure they do not miss it.
Are you interested in learning more about Tableau’s new features or the features? Are you a Tableau user and would like to become a Tableau Champion?
If the answer to the above questions is a big “YES”, Please contact us at training@beinex.com/ info@beinex.com and we would be happy to schedule a Tableau demo or training for you and your company.
Search improvements in Data pane
While developing business specific dashboards, we need to create several calculations and its needs to be adjusted or new calculations needs to be created from existing calculations as per the business unit’s requirements.
With the newly added Search improvement feature, our lives are made easy by searching or filtering specific filed based on field name, type, or comments.
Search improvements in Data pane
Write to external databases in Tableau Prep
Write to external databases in Tableau Prep
The wow moment for prep is here with the introduction of the ability to output to a database. In all previous versions of Prep, we have been able to write to an extract file or csv, and now from the latest 2020.3 introduces the ability to output to a database. Currently supported databases are SQL Server, MySQL, PostgreSQL, Amazon Redshift, Snowflake, Oracle, and Teradata.
As shown in the below example, result from the flow can be saved to a data base table from the output step by choosing “Database table” option, specify your server connection (with login credentials) , choose the data base and then the table.
And now, Write to database will power the analytics journey by helping to solve the issues related to, data sources, data security and data governance
Open or Upload Workbooks On The Web within Tableau Server
Sharing your work and exploring insights from others just got easier. You can now open a Tableau workbook or upload it straight to the web without having to use Tableau Desktop. Simply select the workbook (.twb or .twbx) you want to upload and publish directly to your site on Tableau Server or Online. Only users with the appropriate publishing permissions will have the ability to upload content.
Open or Upload Workbooks On The Web within Tableau Server
Three refresh options are available, they are
Create table- if the table is an already existing one, it will be deleted
Append to Table –Without impacting the existing records, data will be added as new records
Replace Data – This selection will Replaces data in the existing table.
Preparing data so that it can be used in extract refresh of exiting tableau dashboards
Generic data preparations and export to csv