Businesses are indulging in the continuous endeavour to leverage the full potential of their data, and they are constantly seeking innovative solutions for the same. A solution capable of gaining traction is the integration of Meta Llama 3 into the Snowflake ecosystem. Beinex has brought this to fruition by establishing an innovative work model that guarantees an application that functions within Snowpark Container Services and harnesses the capabilities of Llama 3.
 Figure 1: Screenshot from DocAI. Zaki Document Chatbot (DocAI) tapping into Llama 3 by Meta and running in the Snowflake ecosystem.
Beinex tested Llama 3 on its in-house DocAI, a solution that runs on Snowflake using Snowpark Container services. The DocAI chatbot solution offers the flexibility to chat with documents such as PPT, PDF, word files, and text files. It currently uses llama3. Llama 3 is a major leap forward, establishing new standards for large language models. Its extensive training data, improved quality, and increased context length make it a powerful choice for document-related tasks, including our DocAI chatbot solution. The article will explain how Beinex deployed Llama 3 in the Snowflake ecosystem in the upcoming sections.
Recently, notable advances have been made in large language models — sophisticated natural language processing (NLP) systems equipped with billions of parameters. These models have demonstrated remarkable abilities, including generating creative text, solving complex mathematical theorems, predicting protein structures, and more. They illustrate the immense potential benefits that AI can offer to billions of people on a global scale.
Meta’s Llama (Large Language Model Meta AI), a state-of-the-art foundational large language model, is designed to support researchers in advancing their work within AI. By providing access to smaller yet highly efficient models like Llama, Meta aimed to empower researchers who may not have access to extensive infrastructure to delve into the study of these models. This democratization of access is pivotal in fostering innovation and progress in this dynamic and crucial field.
What is Llama 3?
Meta's latest advancement in the LLM (Large Language Model) series is Llama 3, the most sophisticated model with considerable advancements in performance and AI capabilities. Llama 3, built upon the architecture of Llama 2, is offered in 8B and 70B parameters, each featuring a base model and an instruction-tuned version tailored to enhance performance in specific tasks, particularly AI chatbot conversations.
According to Meta, Llama 3 sets a new standard for open-source models, rivalling the performance of proprietary models available today.
Llama 3 models will soon be accessible across various platforms, including AWS, Google Cloud, Hugging Face, Databricks, Kaggle, IBM Watson, Microsoft Azure, NVIDIA NIM, and Snowflake. Capabilities such as reasoning, code generation, and instruction following have seen substantial enhancements, rendering Llama 3 more adaptable and controllable. Meta plans to introduce additional capabilities, longer context windows, expanded model sizes, and enhanced performance. Utilizing Llama 3 technology, Meta AI emerges as one of the premier AI assistants globally, offering intelligence augmentation and support across various tasks, including learning, productivity, content creation, and connection facilitation.
Llama 2 vs Llama 3
According to Meta, the newly introduced models, Llama 3 8B with 8 billion parameters and Llama 3 70B with 70 billion parameters, represent a significant advancement in performance compared to their predecessors, Llama 2 8B and Llama 2 70B. Meta describes these models as a ‘major leap’ in performance.
Llama 2 serves research and commercial purposes, excluding the top consumer companies globally. Llama 2 boasts enhancements such as training on 40% more data, doubling the context length, and leveraging a vast dataset of human preferences to ensure safety and helpfulness, backed by over 1 million annotations.
On the other hand, Llama 3 represents the next step in Meta AI's LLM evolution, catering to research and commercial applications, provided monthly active users are under 700 million. Positioned as the successor to Llama 2, Llama 3 showcases state-of-the-art performance on benchmarks and is lauded by Meta as the 'best open-source model of their class.'
Ollama
There were times when accessing Large Language Models (LLMs) was restricted to cloud APIs offered by major providers like OpenAI and Anthropic. While these cloud API providers continue to dominate the market with user-friendly interfaces facilitating easy access for many users, it's important to recognize the trade-offs users make beyond the costs associated with pro plans or API usage. This trade-off involves granting providers full access to chat data. For those seeking to securely run LLMs on their hardware, the alternative has typically involved training their LLMs.
Ollama, an open-source application, is designed to enable users to run, create, and share large language models locally through a command-line interface on MacOS and Linux. With Ollama, running LLMs on personal hardware requires minimal setup time. It caters to individuals seeking to run LLMs on their laptops, maintain control over their chat data without involving third-party services, and interact with models through a straightforward command-line interface. Additionally, Ollama offers various community integrations, including user interfaces and plugins for chat platforms.
Deploying Llama 3 in the Snowflake Ecosystem: What Beinex Did?
Deploying Llama 3 in the Snowflake Ecosystem means integrating the advanced language capabilities of Llama 3, the latest version of Meta’s language model, into the Snowflake data platform. It represents a significant breakthrough for organizations seeking to maintain control over their data. It allows users to directly leverage Llama 3's powerful natural language processing capabilities within Snowflake for various tasks such as data analysis, querying, and generating insights.
Users can benefit from enhanced text understanding and generation
Enables more efficient and accurate data processing, analysis, and decision-making
Empowers users to interact with their data more intuitively and naturally
Drives greater productivity and insights within the Snowflake environment
Traditionally, utilizing modern LLMs at scale has necessitated reliance on proprietary services, often requiring organizations to abandon control over their data to service providers. This compromise between data residency and accessing advanced AI capabilities has been a conflict for many.
However, a solution has emerged with Beinex's innovative approach and successful Proof of Concept (PoC). Beinex has devised a model ensuring that applications function seamlessly within Snowpark Container Services while harnessing the power of Llama 3. This integration means organizations can now deploy Llama 3 directly within the Snowflake ecosystem, eliminating the need for reliance on external proprietary services.
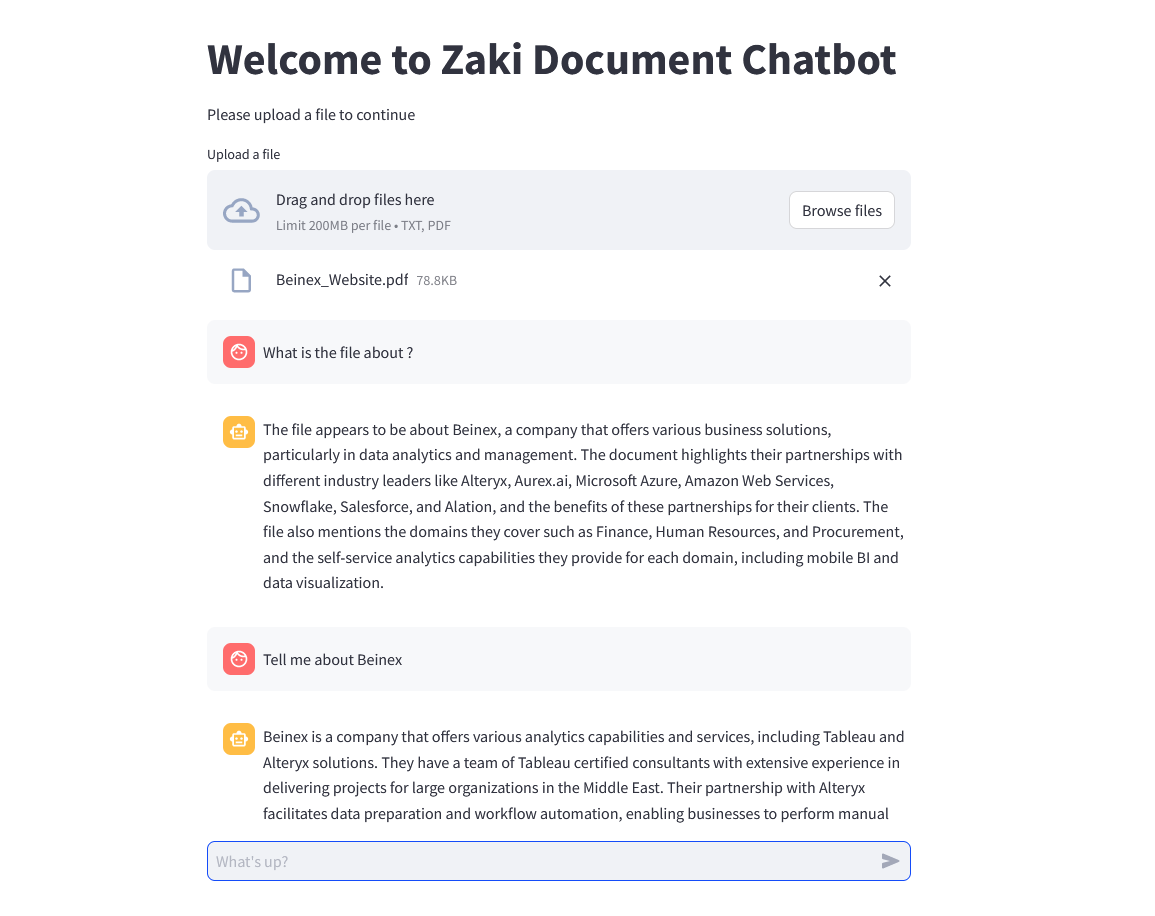 Figure 2: Zaki Document Chatbot (DocAI) in action!
Deploying Llama 3 in the Snowflake Ecosystem: How Beinex Did it?
Here’s a detailed guide on deploying Llama 3 on Snowflake Container Services:
Step 1: Create Necessary Objects
-- Run by ACCOUNTADMIN to allow connecting to Hugging Face to download the model
-- Stage to store LLM models
CREATE STAGE <stagename>
IF NOT EXISTS models
DIRECTORY = (
ENABLE =
TRUE)
ENCRYPTION = (
TYPE='
SNOWFLAKE_SSE');
-- Stage to store YAML specs
CREATE STAGE <stagename>
IF NOT EXISTS specs
DIRECTORY = (
ENABLE =
TRUE)
ENCRYPTION = (
TYPE='
SNOWFLAKE_SSE');
<br.
-- Image repository
CREATE OR REPLACE IMAGE REPOSITORY images;
-- Compute pool to run containers
CREATE COMPUTE POOL GPU_NV_S
MIN_NODES =
1
MAX_NODES =
1
INSTANCE_FAMILY = GPU_NV_S;
Step 2: Docker Image Code - ollama
FROM ollama/ollama
RUN $(ollama serve > output.log
2>&
1 &)
&& sleep 10
&& ollama pull llama3
&& pkill ollama
&& rm output.log
ENTRYPOINT [
"ollama"]
CMD [
"serve"]
Step 3: Tag and Push the Docker Image
docker tag ollama .registry.snowflakecomputing.com/db/schema/image respository /ollama
docker push .registry.snowflakecomputing.com db/schema/image repository /ollama
Step 4: Docker Image - UDF
FROM python:3.11
WORKDIR /app
ADD ./requirements.txt /app/
RUN pip install
--no-cache-dir -r requirements.txt
ADD ./ /app
EXPOSE 5000
ENV FLASK_APP=app
CMD [
"flask", "run", "--host=0.0.0.0"]
App.py content is given below :
from flask
import Flask, request, Response, jsonify
import logging
import re
import os
from openai
import OpenAI
client = OpenAI(
base_url=
'http://ollama:11434/v1',
api_key=
"EMPTY",
)
model =
"llama3"
app = Flask(
__name__)
app.logger.setLevel(logging.ERROR)
def extract_json_from_string(s):
logging.info(
f"Extracting JSON from string: {s}")
# Use a regular expression to find a JSON-like string
matches = re.findall(
r"\{[^{}]*\}", s)
if matches:
# Return the first match (assuming there's only one JSON object embedded)
return matches[0]
# Return the original string if no JSON object is found
return s
@app.route(
"/", methods=[
"POST"])
def udf():
try:
request_data:
dict = request.get_json(force=True)
# type: ignore
return_data = []
for index, col1
in request_data[
"data"]:
completion = client.chat.completions.create(
model=model,
messages=[
{
"role": "system",
"content": "You are a bot to help extract data and should give professional responses",
},
{
"role": "user", "content": col1},
],
)
return_data.append(
[index, extract_json_from_string(completion.choices[0].message.content)]
)
return jsonify({
"data": return_data})
except Exception as e:
app.logger.exception(e)
return jsonify(
str(e)),
500
Step 6: YAML File
spec:
containers:
- name: ollama
image: <SNOW_ORG-SNOW_ACCOUNT>.registry.snowflakecomputing.com/ db/schema/image respository /
llama3
resources:
requests:
nvidia.com/gpu: 1
limits:
nvidia.com/gpu: 1
env:
NUM_GPU: 1
MAX_GPU_MEMORY: 24Gib
volumeMounts:
- name: llm-workspace
mountPath: /<stage name>
- name: udf
image: .
registry.snowflakecomputing.com/ db/schema/image respository /
ollama_udf
endpoints:
- name: chat
port: 5000
public: false
- name: llm
port: 11434
public: false
volumes:
- name: llm-workspace
source: "@<llm stage_name>"
Step 7: Upload YAML File and Create Service
Upload the YAML file to the created stage, where the stage name in the YAML file should match the stage created in Step 2.
-- Create service
create service llama3
IN COMPUTE POOL<name
of compute pool created>
FROM @dash_stage
SPECIFICATION_FILE
= '<name of yaml file uploaded>';
Step 8: Create Service Function
Create a service function on the service (after it starts).
create or replace function llama3(prompt text)
returns text
service=llama3
endpoint=chat;
Check Service Status
Use the following command to check the status of the service:
SELECT
v.
value:containerName::varchar container_name,
v.
value:status::varchar status,
v.
value:message::varchar message
FROM (
SELECT parse_json(system$get_service_status(
'<service name>'))
) t,
LATERAL FLATTEN(input => t.$1) v;
Benefits of Deploying Llama 3 in the Snowflake Ecosystem
Superior AI apps courtesy of Llama 3: Allows organizations to harness the full potential of this advanced LLM. Llama 3 offers avant-garde capabilities in natural language processing and generation, enabling the development of superior AI applications with enhanced performance, accuracy, and efficiency.
Data residency: Ensures that organizations maintain control over their data residency.
With Snowflake's robust data governance and compliance features and Llama 3's deployment within the same ecosystem, organizations can confidently adhere to data residency requirements and regulations, ensuring that sensitive data remains within specified jurisdictions or regions.
Scalability: Provides organizations with remarkable scalability for their AI applications.
This seamless scalability empowers organizations to handle large volumes of data and accommodate growing user demands without compromising performance.
Easy monitoring: Simplifies the monitoring and management of AI applications.
Snowflake's intuitive interface and comprehensive monitoring tools enable organizations to easily track the performance, usage, and health of their deployed Llama 3 models. It facilitates proactive identification of issues, optimization of resources, and overall better management of AI workloads, ensuring smooth and efficient operations.
By leveraging Llama 3 within Snowflake, organizations can alleviate data sovereignty and control concerns. They can rest assured that their precious and sensitive data remains within their realm of control while still being able to build and scale superior applications. This development marks a significant milestone in bridging the gap between data residency requirements and accessing the most effective LLM technology.
-Mebin Joy Dynamic highlighting with Slicer:
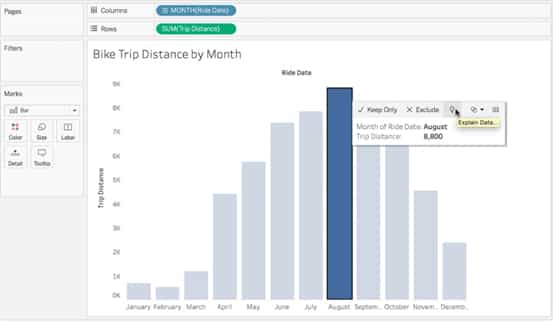
The below example shows the dynamic highlighting where I can choose the categories in the slicer to highlight for comparison with the other categories. I can easily focus on the selected categories and compare the measure values with other categories.
Dynamic highlighting with Slicer:
The below example shows the dynamic highlighting where I can choose the categories in the slicer to highlight for comparison with the other categories. I can easily focus on the selected categories and compare the measure values with other categories.
 Solution:
First, I have created a disconnected table with the categories. This can be easily done with the following dax formula.
Solution:
First, I have created a disconnected table with the categories. This can be easily done with the following dax formula.
 Added the measure in the field value section.
 Added category slicer from the Selected Category table
 Finally arranged them and saw the magic happen.
 Conclusion:
This goes to show the hidden features of Power BI one can explore with a little bit of tinkering with a dash of DAX. This blog is a first in a series of many nifty blogs. Hope you like it and looking forward to your feedback.
Conclusion:
This goes to show the hidden features of Power BI one can explore with a little bit of tinkering with a dash of DAX. This blog is a first in a series of many nifty blogs. Hope you like it and looking forward to your feedback.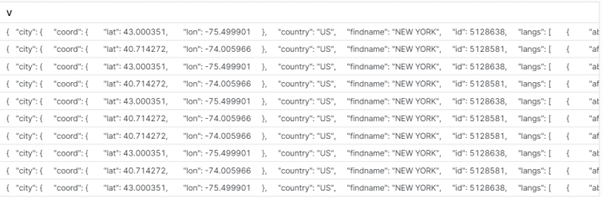
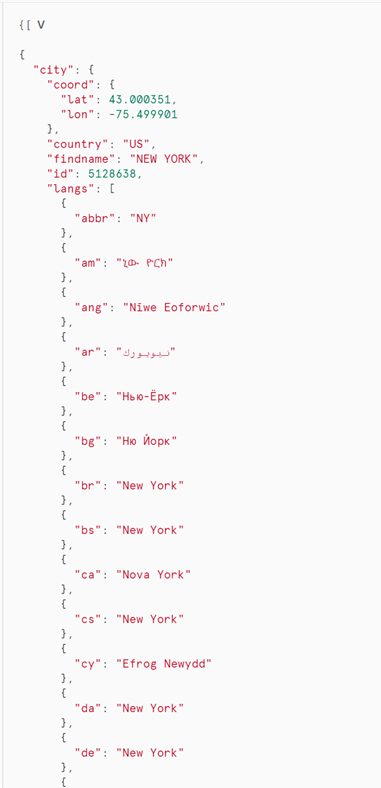

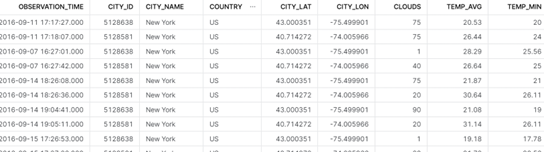
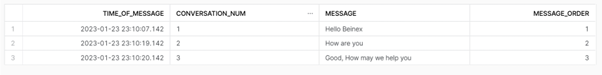
 The above JSON file stores a single set of conversations between two texters in a single row. If the requirement is to get every individual message as a separate row a FLATTEN function can be used to produce the following result: