How AI Decision-Making is Improving Enterprise Outcomes
Blog
Share 
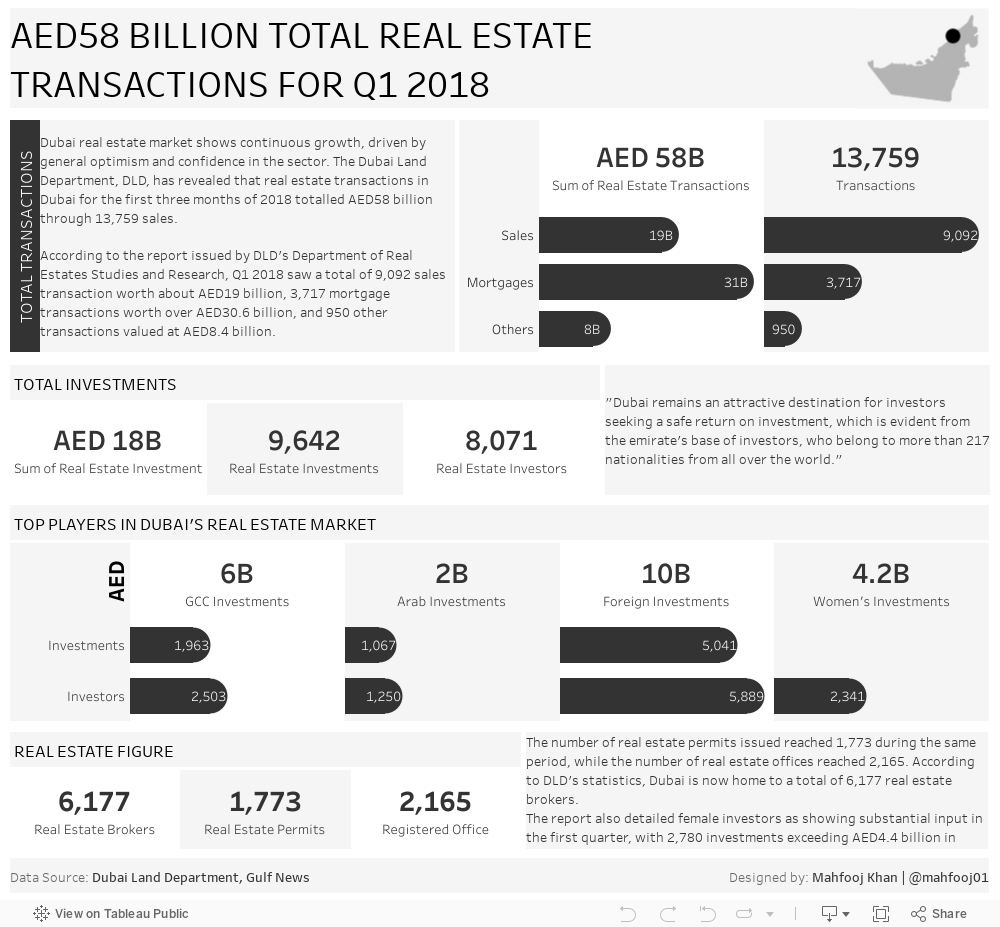
معاملات دبي العقارية
معاملات دبي العقارية في الربع الأول من عام 2018
يظهر سوق دبي العقاري شواهد النمو المستمر لما يملكه من ثقة ونظرة إيجابية شاملة كقطاع حيوي. كشفت دائرة الأراضي والأملاك في دبي عن حجم المعاملات التجارية في القطاع العقاري التي تمت خلال الربع الأول من العام 2018 وتم رصده بما يساوي الـ 58 بليون د.إ. خلال الثلاثة أشهر الأولى من العام كناتج كُلي لـ 13759 عملية تجارية.
-
Related Articles

Tableau New Features Unveiled: Tableau 2023.1 Release
[sc name="quote" quote="“As a practitioner, I believe that the major game changer in the latest version, Tableau 2023.1, is Accelerator Data Mapping. With Data Mapping you can jump-start your analytics even faster by reducing the time and effort required to set up an Accelerator’s ready-to-use dashboards. Now, when configuring an Accelerator, the Data Mapper allows users to pull outside data into the Accelerator and map fields from their data source into the fields the Accelerator expects. This will be made possible via the Data Mapping UI - a hybrid dialogue box that opens by default with any Data Mapping enabled Accelerator”" author="Sanchit Katiyar, Solution Architect at Beinex."][/sc]
Let’s catch up with Tableau’s brand-new capabilities:
1. Tableau for Slack EnhancementsThe Tableau app for Slack has been improved to enhance collaboration on insights. These updates make it simpler to prioritize data in every conversation and decision. New features include the ability to share Tableau content with context using link previews, which helps teams quickly identify and act on pertinent information. Additionally, it's now easier to search for and share Tableau content in direct messages and channels. Finally, you can quickly access your recent and favourite items from the App homepage, making it faster to get to insights.
2. Identity Pools for Tableau ServerIdentity Pools provide a way to go beyond the current restriction of having only one identity store on the Tableau Server. An Identity Pool consists of a "Source of Users" (previously known as the Identity Store) and an authentication mechanism. With this feature, you can add more pools where your source of users can belong to a local identity store and authenticate using OpenID Connect for modern authentication. This added flexibility will benefit organizations that have external users who need access to Tableau but cannot be added to their corporate Active Directory.
3. Dynamically Update Axis TitlesParameters are useful for adding interactivity and flexibility to a visualization. They allow viewers to select how they want to view the data. However, previously, it was not possible to automatically update the axis title.
Dynamic axis titles enable the axis title to be determined by the value of a parameter or a single-value field. This feature allows authors to provide better context for their data visualizations to their audience.
If you've found the single identity store limitation of Tableau Server to be limiting, you'll be pleased to know that Identity Pools offer a solution. In the past, there were only two types of identity stores, local and external, and changing the configuration required a complete reinstall of the Tableau Server.
Identity Pools allow you to overcome this limitation by creating additional pools that combine a "Source of Users" (previously known as the Identity Store) and an authentication mechanism. You can now have your source of users belonging to a local identity store and authenticate using OpenID Connect for modern authentication. This added flexibility allows you to support both internal and external users who are not part of the corporate Active Directory.
The new USER ATTRIBUTE (string) function is now available for personalized data access. This function passes login attributes in a calculation, which can be used as a data source filter for row-level security, beyond just username and group, such as department or region. This allows for the customization of a user's data access in embedded scenarios.
With this new function, you can include additional information about users and send it to Tableau when the users sign in. Tableau will automatically use this information as a filter, only showing corresponding data to the user.
When the filter is applied in your workbook or dashboard, Tableau searches for the value of the attribute in the viewing user's authentication token. Using Connected Apps and SSO for embedding users, you can include the attribute as a claim in the JSON Web Token (JWT) used for user authentication.
How Tableau 2023.1 can be Beneficial to the Tableau Users
With the added new features, you can enjoy the advantages enlisted below:- Greater Flexibility and Security for Both Internal and External Users: Tableau Server now offers greater flexibility and security for both internal and external users with the ability to add local identity stores and authenticate using OpenID Connect.
- Efficient Offline Environment Management: With an enhanced activation solution, managing offline environments is a breeze, thanks to the option to leverage login-based license management.
- Reliable Tableau Mobile: Tableau Mobile is now even more secure, due to added security policies that prevent screen sharing and screenshots on Android devices, as well as the detection of jailbreak and malware.
- Connect to Google BigQuery: Connecting to Google BigQuery is now more efficient than ever, be the new JDBC connector that uses BigQuery's Storage API.
- Resource Monitoring Tool: The tool, which is a component of Tableau Advanced Management, now comes with enhanced features that make logging in easier and allow for more customization options:
- Network Credentials Support: Users can now use their network credentials to log into the Resource Monitoring Tool instead of using a distinct username and password.
- Customizable Run As users: With this new feature, you can set up Run As users for the Resource Monitoring Tool Server and Agent on Linux operating systems to comply with your security policies and apply best practices.
- Tableau Data Management now offers enhanced features that enhance data reliability and flexibility for virtual connections:
- Data Warnings: Data quality warnings are now available in both web authoring and Data Details to help improve data trust. Users can receive warnings about data quality at the column level.
- Flexible Connectivity: With the latest update, users can choose to use either a live or extract connection for each table within a virtual connection. This allows them to refresh the data as needed to suit their needs.
Are you as excited as we are about these amazing new features? If so, be sure to get started with Tableau 2023.1 today!
About Beinex+ Tableau Partnership
As a quick, versatile, and easy-to-use self-service platform tailored to your organisational needs, Tableau streamlines the power of data. It enables users to make decisions more quickly and with greater confidence from anywhere, anytime.
As a premium partner, Beinex offers the best of Tableau services to grow your business. Our partnership with Tableau has unveiled several seamless possibilities for businesses. Tableau, with its user-friendliness, makes Data Analysis and Visualization an enjoyable, interesting and rewarding process.

AI Adoption in HR: Top Five Benefits Powering the Future Workforce


Top Ten Business Intelligence Trends
What is Business Intelligence?
Business intelligence (BI) is an analysis that uses business-related strategies and technologies to assess, process, and interpret business information. This type of information helps businesses understand the current state of their organization and make informed decisions on how to take actions that are likely to yield their intended results.
Leveraging business intelligence insights offers several benefits to employers and employees, including strengthening performance and improving efficiency. For example, insights from business intelligence metrics can help employers understand where supply chain function might be breaking down or provide a snapshot of consumer products performing above or below expectations.
Top Trends in Business Intelligence in 2024
Finding the latest trends in BI can help your organization stay competitive and maximize your ability to use your data. While trends continually shift by nature, the following areas have rapidly risen in demand and application.
1. Augmented Analytics
Augmented analytics is an approach to data analytics that employs advanced technologies such as AI and machine learning to automate data preparation, insight generation, and insight sharing.In 2023, the global augmented analytics market was valued at USD 8.9 billion, marking a significant milestone in data-driven technologies. The market is on track for impressive expansion, with estimates predicting its value will climb to USD 11.6 billion in 2024 and soar to USD 91.4 billion by 2032. This remarkable growth, reflected in a compound annual growth rate (CAGR) of 29.4% between 2024 and 2032, underscores the rising importance of advanced analytics in transforming business intelligence and decision-making processes across industries.
Here are the advantages of augmented analytics:
Advantages: • Increased Efficiency: Automates data preparation, saving up to 60% of man-hours spent on manual data processing. • Broader Accessibility: Empowers non-technical users to gain insights, reducing dependency on data specialists by 40%. • Real-World Impact: Organizations using augmented analytics report a 25% increase in productivity due to faster decision-making.
2. Natural Language Processing (NLP)
Natural Language Processing (NLP) is a confluence of computational linguistics and artificial intelligence that enables machines to understand, interpret, generate, and respond to human language meaningfully and contextually. An example of a program that utilizes natural language processing is ChatGPT. The Natural Language Processing (NLP) market is projected to reach a value of USD 36.4 billion in 2024. With a robust compound annual growth rate (CAGR) of 27.5% from 2024 to 2030, the market is expected to expand significantly, reaching a volume of USD 156.8 billion by 2030. This rapid growth highlights the increasing adoption of NLP technologies across various industries, driving advancements in AI-driven communication and analytics tools. The advantages of Natural Language Processing (NLP) within the business intelligence landscape: Advantages: • Enhanced User Engagement: Reduces the learning curve for data tools, increasing user adoption by up to 30%. • Customer Insights: Companies using NLP for sentiment analysis report a 15% increase in customer satisfaction.
3. Data Storytelling
The growing dependence on data in the corporate landscape brings forth the need for data interpretation that extends beyond traditional methods. The narrative structure is one of the primary differentiators between data storytelling and data visualization. While data visualization can provide a visual representation of what the data is saying, data storytelling explains why the data matters, providing a more comprehensive understanding of the insights. According to Gartner, by 2025, data stories will become the most common method for consuming analytics, and data storytelling will dominate BI, with 75% of these stories being automatically produced through augmented analytics techniques. Advantages: • Better Understanding: Enhances comprehension of complex data, leading to a 20% reduction in misinterpretation. • Improved Decision-Making: Organizations using data storytelling have reported a 15% increase in strategic decision outcomes.4. Self-Service Analytics
Another BI trend is self-service analytics. It is a form of business intelligence wherein end-users, such as marketing professionals, are enabled to conduct data analyses and generate reports without the direct assistance of IT or data science teams. The self-service BI market is projected to reach USD 30 billion by 2036, expanding at a compound annual growth rate (CAGR) of 8% between 2024 and 2036. In 2023, the market size was valued at over USD 18 billion. This substantial growth is driven by the increasing demand for data democratization, as organizations seek to dismantle traditional data silos and enable non-technical users to access, analyze, and extract insights from data independently. Advantages: • Time Savings: Reduces report generation time by up to 50%, allowing for faster data-driven decisions. • Empowered Employees: Decreases IT workload by 30%, enabling more focus on strategic projects.
5. Decision Intelligence
DI goes beyond traditional analytics by creating a semantic framework that incorporates business rules and context, enabling predictive analytics to generate actionable, future-focused insights. This empowers organizations to make more informed and strategic decisions, often automating routine choices and accelerating complex ones. The DI market is on a robust growth trajectory, projected to surge from $13.3 billion in 2024 to a remarkable $50.1 billion by 2030. As businesses increasingly prioritize data-driven strategies, DI stands out as a pivotal tool for enhancing decision-making agility and precision, ensuring organizations stay ahead in a competitive landscape. Advantages: • Automated Decision-Making: Increases decision speed by up to 40%, significantly reducing time-to-insight. • Enhanced Strategic Planning: Companies using DI report a 25% improvement in strategic planning accuracy.6. Predictive Analytics
Predictive analytics is an advanced form of analytics that uses historical data, statistical algorithms, and machine-learning techniques to predict future events and trends. The predictive analytics market is projected to grow by USD 38.6 billion, at a CAGR of 28.9%, between 2023 and 2028. This rapid expansion is fueled by increasing demand for data-driven decision-making, advancements in AI and machine learning technologies, and the rising adoption of predictive analytics across various sectors, including finance, healthcare, and retail. Advantages: • Proactive Decision-Making: Reduces operational costs by up to 15% through accurate demand forecasting. • Risk Mitigation: Enhances risk assessment accuracy, leading to a 20% reduction in potential losses.
7. Artificial Intelligence (AI) in BI
Another emerging BI trend is the greater infusion of AI in business intelligence. AI's ability to automate data analysis, generate insights, and predict outcomes is redefining the way organizations interact with data. The Artificial Intelligence market is projected to reach a size of USD 184.0 billion in 2024, with an expected annual growth rate (CAGR) of 28.4% from 2024 to 2030. This growth is anticipated to result in a market volume of USD 826.7 billion by 2030. AI in BI typically involves the application of machine learning algorithms and advanced analytics techniques to automate data processing and interpretation tasks. From data collection and cleaning to analysis and insight generation, AI can significantly reduce the manual workload, speeding up the entire BI process. Advantages: • Operational Efficiency: Automates 70% of data analysis tasks, freeing up resources for strategic activities. • Cost Reduction: Reduces the cost of data processing by up to 20%8. Advanced Data Visualization
Advanced data visualization goes beyond basic charts and graphs, incorporating a variety of innovative visual elements such as heat maps, geographical maps, scatter plots, treemaps, and more into the dashboard design. These elements enable the presentation of multi-dimensional data in a single view, facilitating a more comprehensive understanding of the data. The global data visualization market showcased a strong value of USD 4.5 billion in 2017, highlighting the growing demand for effectively presenting complex data. By 2023, the market is expected to surge to USD 7.7 billion, reflecting a robust CAGR of 9.47%. Advantages: • Improved Insights: Increases data interpretation accuracy by 30%. • Enhanced Collaboration: Boosts cross-departmental collaboration by 25% through shared visual insights.
9. Mobile BI
Mobile business intelligence (BI) involves the use of mobile devices to access BI applications and data, enabling decision-makers to stay informed and make decisions, irrespective of their location. The global mobile business intelligence market, valued at USD 13.8 billion in 2023, is expected to grow at a CAGR of 15.3%, reaching USD 51.5 billion by 2032. Advantages: • Increased Accessibility: Provides real-time data access, enhancing decision-making speed by 35%. • Boosted Productivity: Enables on-the-go analysis, increasing productivity by 20%.10. Ethical Data Governance
The last BI trend on the list is ethical data governance, which addresses policies, procedures, and structures that ensure data quality and security, and ethical considerations related to data collection, processing, and use. The global data governance market is projected to reach USD 4.1 billion in 2024 and is expected to grow at a CAGR of 18.5% over the next decade, reaching USD 22.5 billion by 2034. The central principle behind Ethical Data Governance is respecting individual privacy and rights in all data activities. It involves implementing practices that ensure informed consent, data anonymization, and stringent access controls, among others, to protect individual privacy and prevent data misuse. Advantages: • Compliance Efficiency: Reduces compliance-related costs by up to 25%. • Increased Trust: Builds customer trust, leading to a 10% increase in brand loyalty.
Tableau in Action: Leveraging Latest BI Trends
Tableau integrates the latest BI trends into practical applications, enhancing decision-making and data insights. Let’s examine how some of the top BI trends are applied within Tableau. Here are a few examples:
- Augmented Analytics: With Tableau Einstein Discovery, companies can automate insights and speed up decision-making, especially in retail and finance.
- Natural Language Processing: Tableau’s NLP system allows users to explore data using simple language, enabling faster data processing without coding.
- Data Storytelling: Story Points help craft compelling narratives, increasing stakeholder engagement in areas like marketing and sales.
- Self-Service Analytics: Tableau enables business users to independently explore data, reducing IT workload and accelerating decisions in finance and supply chain.
- Predictive Analytics: Integrating with Einstein Discovery, Tableau’s predictive capabilities help industries like healthcare forecast trends and optimize operations.
- Mobile BI: Tableau’s mobile app allows for real-time access to data, improving productivity for on-the-go teams like sales.

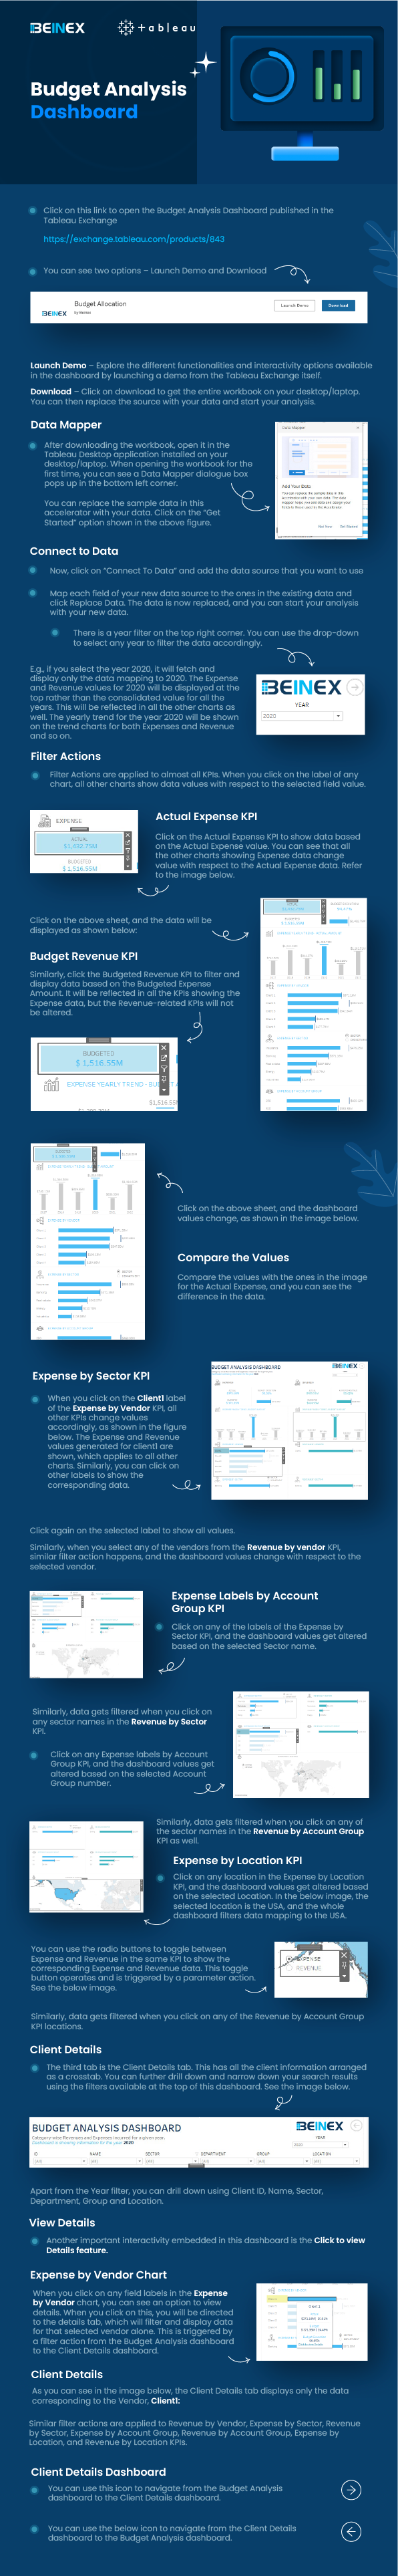
Budgeting Made Easy: Beinex Budget Allocation Accelerator (Infographic)

Optimizing Cost Management with AWS Cost Explorer
Benefits of AWS Cost Optimization
Optimizing AWS costs is a vital part of effectively utilizing AWS services. Businesses can leverage the wide array of AWS services and pricing models to learn how to optimize costs and save considerable amounts of money. AWS Cost Optimization offers several key benefits to organizations looking to manage and reduce cloud expenses while maximizing efficiency. Let's take a look at the benefits of cost optimization with AWS: Enhanced flexibility: AWS offers flexible and cost-effective purchase plans like Reserved Instances or Amazon EC2 Spot Instances, enabling businesses to select the suitable pricing models that best fit their requirements. Boosted efficiency in resource utilization: Allocate resources effectively by rightsizing your instances, identifying the optimal size for your compute workloads, selecting the right data storage and transfer options, and eliminating unused resources. This prevents overprovisioning and ensures optimal usage of available services. Increased cost savings: AWS identifies unused resources and helps businesses scale down their infrastructure, reducing cloud costs and saving big. AWS cost optimization also ensures that you pay only for what you need, enhancing the efficiency of your cloud operations. Improved budgeting and forecasting: AWS Cost Optimization gives businesses greater visibility into spending patterns, enabling them to forecast costs and create accurate and realistic budgets based on seasonal trends, historical usage patterns, and business growth projections. Increased scalability: By employing cost optimization strategies, businesses can seamlessly scale resources on demand and pay for the requirement only when needed. Optimizing costs for seasonal fluctuations, changing workloads, and business growth ensures scalability in your AWS environment.
A Quick Look into AWS Cloud Cost Optimization Tools
AWS Cost Explorer: A tool that offers insights into the cost and usage of AWS services by giving a detailed picture of AWS spending. Its benefits include: • Identifying areas where costs are optimized • Forecasting future costs • Planning and budgeting AWS costs AWS Budgets: A tool that allows users to create custom cost and usage budgets for AWS services. It enables users to take corrective action by sending alerts when cost and usage thresholds exceed. Its benefits include: • Handling AWS spend by setting and monitoring budgets • Avoiding unforeseen expenses and cost overruns • Providing suggestions for cost optimization AWS Trusted Advisor: A tool offering tailored recommendations for optimizing AWS costs, performance, and security. It is free of charge for all AWS users. Its benefits include: • Delivering actionable insights from usage data • Offering personalized recommendations from usage data • Identifying areas where costs can be lowered AWS Pricing Calculator: A tool that helps users get estimates before choosing a service and enables the assessment of calculations based on the estimates. Its benefits include: • Identifying possible areas for cost-saving • Planning budget effectively • Providing insights into the costs you expect for a service
Optimizing Cloud Costs with AWS Cost Explorer
A robust tool that enables users to visualize, analyze, and monitor AWS costs, AWS Cost Explorer offers a granular view of your AWS spending and usage. It allows you to track your spending over time, detect cost trends, and investigate specific resources to understand where the money is spent. Cost Explorer provides a detailed report on cost, usage, and Reserved Instances and a main graph that helps you drill down into costs and usage. Users can access data for up to the last thirteen months, get suggestions for RI purchases, and predict expenses for the next twelve months. Besides, Cost Explorer offers insights into user spending by identifying areas for examination. Users can also set up preconfigured views to track overall cost trends while customizing views to align with user requirements. AWS Cost Explorer has some incredible features that assist you in comprehending and managing your spending. Data Exploration: Access AWS Cost Explorer directly from the Billing and Cost Management console. With the ability to filter and group data by dimensions such as service, usage type, region, and tags, you can dive deep into specific areas and identify key cost drivers. Report Generation: Build custom reports to monitor your costs and usage trends over time. These reports can be saved and scheduled for regular updates, offering continuous insights into your spending patterns. Costs Forecasting: Leverage Cost Explorer's forecasting feature to predict future expenses based on historical data. The predictive faculty supports better budget planning and more efficient resource allocation. Businesses that do not optimize costs can face higher costs, inefficient use wastage of resources, and severe impact on profit. Therefore, AWS cost optimization is essential for utilizing cloud resources efficiently and cost-effectively, potentially saving money for businesses in the long run. The benefits of cost optimization include lowering costs, offering predictability, preventing unforeseen expenses and cost overruns, and enhancing resource utilization, which drives business growth and sustainability.