How AI Decision-Making is Improving Enterprise Outcomes
Blog
Share 
DUBAI’S REAL ESTATE TRANSACTION
Dubai real estate market shows continues growth, driven by general optimism and confidence in the sector. The Dubai Land Department, DLD, has revealed that real estate transactions in Dubai for the first three months of 2018 totaled AED58 billion through 13,759 sales.
[subscribelocker]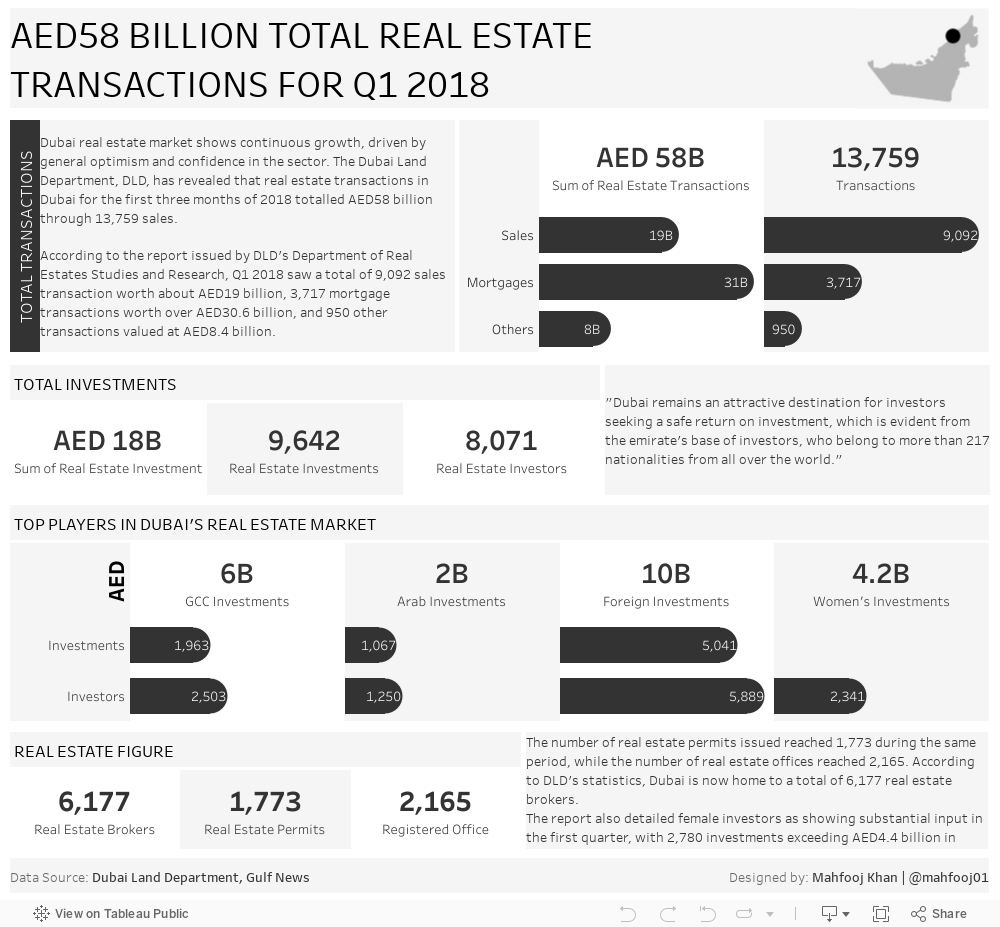
Dubai real estate market shows continues growth, driven by general optimism and confidence in the sector
Related Articles
PARAMETER ACTION + SHEET ACTION
Parameter Action + Sheet Action: Extended Tableau Interactivity
Tableau has included lots of sought-after features into its latest release, Tableau 2019.2. If you’ve been eagerly looking forward to the release of the latest Tableau version to try out the whole new Parameter Actions, well – the wait is over!
In our previous blog post about Tableau 2019.2, we had already covered some of the major features of the release. In this blog, we will be diving deep into ‘parameter action’ and the combination of Parameter Action + Sheet Action with a simple example using Sample-Superstore dataset.
What are Parameter Actions?
Parameters are constant values created by a user to perform certain functions in Tableau and can be used in calculations, reference lines and some other analytic scenarios. A parameter can be a set of strings, numbers, etc. With parameter, the user can able to select only one value at a time.
With parameter actions, users have the option to control the parameter values dynamically when clicking or hovering on certain elements on a viz. We can use parameter actions in a worksheet or a dashboard which extends the interactive ability of Tableau. This enables the users to visually change the parameter value with few interactions, which is cool. Parameter action can unleash the possibilities for designers to come up with new levels of interactivity to the dashboards.
Steps to achieve Parameter Action + Sheet Action:
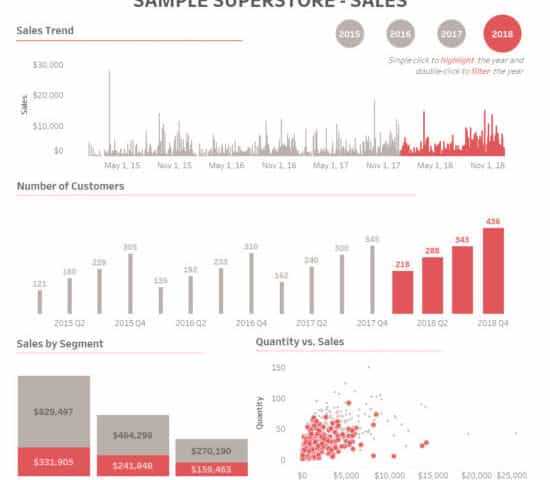
1. First, create the sheets of required KPIs. We have created 4 sheets;
- Sales Trend
- Number of Customers
- Sales by Segment
- Quantity Vs. Sales


2. Create a Year calc from ‘Order Date’ field.

3. Create a parameter using ‘Year’ calculated field. (This parameter is used in Parameter Action)

4. Create a calculated field ‘Parameter Calc’ which is used to color/highlight the selected year.

5. Drag the ‘Parameter Calc’ to Color and Size in marks shelf.

6. If you apply ‘Parameter Calc’ to the created sheet, it will look something like this. The selected year in ‘Year Parameter’ will be highlighted with the color and size.

7. Now, we need a toggle to switch between years. So, we have to create a sheet like below,
(Like before, drag the ‘Parameter Calc’ to color and size in marks shelf)

8. Arrange the sheets in a dashboard. Give a header and format the texts, fonts, colors if required.

9. How to create ‘Parameter Action’
- Select Dashboard > Actions.
- In the Actions dialog box, click Add Action and then select Change Parameter.

- Select ‘Year Toggle’ as Source sheet and choose ‘Select’ in Run action on:
- Select ‘Year Parameter’ as Target Parameter.

- Now, if you select a year, the parts in the sheet corresponding to the selected year will get highlighted in color and other parts are grayed out.
10. How to create ‘Sheet Action’
- Select Dashboard > Actions.
- In the Actions dialog box, click Add Action and then select Filter.
- Select ‘Year Toggle’ as Source sheet and all the sheets in the dashboard as Target Sheets
- Choose ‘Select’ in Run action on and choose ‘Show all values’ in Clearing the selection will

Now, we have set both Parameter Action and Sheet Action for ‘Year Toggle’ sheet.
If we single click on the year, it will highlight (Parameter Action) the year throughout the dashboard and if we double click on the year, it will filter out (Sheet Action) that particular year throughout the dashboard.

Beinex is a digital transformation organization en-rooted with ideas, innovation and unparalleled customer service. Our mission is to transform the way individuals and the organizations work with the data through innovation and experience.
If you are interested in learning more about the latest Tableau parameter actions and use cases, please contact us at training@beinex.com/ info@beinex.com
and we would be happy to schedule a Tableau demo or training for you and your company.


Benefits of Advanced Analytics: From its Impact on Company Culture to Business Financials
Advanced Analytics aids in the resolution of complicated business challenges, as well as the improvement of operational efficiency, investment decisions, and customer experiences. It goes one step ahead of business intelligence by employing sophisticated modelling approaches to forecast future occurrences and find trends/patterns that would otherwise go undetected. Let’s get into the benefits of Advanced Analytics in detail:

Benefits of Advanced Analytics:
Transformation of Company Culture
Organisations must transition to a data-driven culture that questions assumptions, addresses crucial topics, and rewards everyone who can provide and analyse value-added data. Companies reap a bunch of benefits by adopting a data-driven culture. The prevalence of such a culture gives employees the talents and skills to analyse data and develop valuable insights, resulting in more accurate decision-making. When a data-driven culture is established, employees can actively seek out more relevant data to fine-tune goals and objectives.
Predicting the Future
Using Advanced Analytics, organisations can assess market circumstances faster and respond to changes faster than their competitors, giving them a considerable edge. Big Data analytics are frequently leveraged by financial services organisations looking to mine, for instance, massive amounts of stock market data to identify and capitalise off of previously unknown trends. Public health organisations are also increasingly leveraging vast population health data to develop better policies, treatment and healthcare practices.
Faster Decision-making
Data analytics helps businesses make better decisions and reduce financial losses. Predictive analytics can forecast what will happen due to business changes, while prescriptive analytics can recommend how the company should respond. Executives may move more rapidly when they have high-accuracy projections, knowing that their business decisions will produce the intended effects and that favourable outcomes can be replicated.
Day-to-day decisions made by retail, manufacturing, media, and healthcare (to name a few) are influenced by the accuracy of insights provided by Advanced Analytics capabilities. It aids in the creation of specifically targeted ads, leads to effective inventory management, spotting quality control issues and anticipating fluctuations in labour needs.
Gathering Deeper Insights
Advanced Analytics enables stakeholders to make data-driven decisions that directly affect their strategy by providing a deeper level of actionable knowledge from data, such as customer preferences, market trends, and essential business processes. Actionable data insights obtained after properly analysing data optimise performance and help make informed decisions.
New products or services are launched, and new markets are uncovered to gain new revenue resources. Customer loyalty and satisfaction increase through deep insights earned through data analysis.
Improved Risk Management
Analytics, in general, assists a company in identifying hazards and taking preventive steps.
Employing sophisticated analytics to make more accurate forecasts, Advanced Analytics allows firms to avoid costly and dangerous actions based on faulty projections. Advanced Analytics gives enterprises a holistic view of their business, past, present, and future, allowing them to better identify and manage risk. The improved accuracy of Advanced Analytics predictions can help firms lower the danger of costly blunders.
Different sectors like banking, telecommunications, and government agencies seek help of Advanced Analytics in identifying, assessing and prioritising risks. Timely identification and monitoring of risks using technology make risk management much more accessible.
Anticipating Problems and Opportunities
Companies can use Advanced Analytics to solve problems that traditional BI can't. It can recommend activities that will improve business outcomes based on probability. Advanced Analytics reduces decision-making uncertainties and allows enterprises to take more effective data-driven decisions. Enterprises take much more of insightful decisions without any programming support from data scientists. It also eliminates customer problems before it arises by converting silos of data into insightful information clusters.
Advanced Analytics employs statistical models to uncover potential difficulties with the company's trajectory or find new opportunities, allowing stakeholders to change course rapidly and achieve better results. Thereby enterprises will discover the accrual of a unique competitive advantage and power to uncover previously unseen trends that project them into an influential positions.
Personalising the Customer Experience
Personalised experience has gained momentum, and companies are ready to offer it more and more to their customers: accessing and mapping relevant data pools to identify customers’ needs and expectations and create a unique experience tailored for them. Also, they deploy Advanced Analytics to improve productivity, optimise business operations, ensure customer experience and more. Effective data utilisation continuously improves workforce efficiency, and by tracking customer engagement, companies can offer a seamless experience to the customer.
Customers' data are gathered through various channels, including physical retail, e-commerce, and social media. Businesses can get insights into client behaviour by employing Advanced Analytics to construct complete customer personas from this data, allowing them to give a more personalised experience.
Improving Financial Performance
The financial performance of the companies, irrespective of the sector, improves by making the best out of Advanced Analytics. The sales forecasting accuracy increases, organisational trends are uncovered, and challenges are addressed competitively, highlighting the business growth. With the marketplace becoming exceedingly competitive, making more confident decisions are inevitable using analytics tools.
Thanks to Advanced Analytics, the biggest businesses worldwide are seizing on the opportunity to make the best of Advanced Analytics. Those enterprises that would like to steal the show can manoeuvre the operations to killer effects by adopting analytics. So, it’s time to get ahead of the curve by the intelligent use of big data for advanced solutions, cutting-edge advertising strategies, and targeted marketing campaigns.

Amazon S3 Case Study with Solutions: How Amazon S3 Glacier Instant Retrieval Transformed the BBC’s Archival Strategy
AWS BBC Case Study: Challenges Faced by BBC
The BBC Archives Technology and Services division is responsible for preserving over 16 million assets, including films, radio broadcasts, news, sports, and digital material. However, managing this vast repository came with significant challenges: • Fragmentation: Content was dispersed across multiple legacy storage systems, making data retrieval complex and inefficient. • High Costs: Maintaining outdated physical infrastructure demanded heavy financial and resource investments. • Limited Accessibility: Lack of a centralized system led to time-consuming content retrieval processes. Many global enterprises face similar struggles in balancing data accessibility with cost efficiency. To address these challenges, the BBC implemented a five-year plan to consolidate its storage using modern cloud technologies.
Key Benefits of Amazon S3 Glacier Instant Retrieval
Building on years of successful collaboration with Amazon Web Services (AWS), the BBC adopted Amazon S3 Glacier Instant Retrieval to modernize its archival strategy. Key benefits of Amazon S3 solution include: • Cost-effectiveness: Amazon S3 Glacier Instant Retrieval offers some of the lowest-cost storage for petabytes of archival data. • Instant Access: Unlike traditional archival storage, this AWS solution provides rapid retrieval speeds, making it ideal for time-sensitive content. • Scalability: AWS’s robust cloud infrastructure ensures seamless expansion as data volumes grow, future-proofing the BBC’s archives. This transition solved immediate storage challenges and laid the groundwork for a scalable, digitized archive that will serve future generations.
The Migration Journey: 25 PB in 10 Months
Over a span of 10 months, the BBC successfully migrated 25 petabytes (PB) of archival data to AWS. Legacy System Retirement: Enabled decommissioning legacy tape-based storage, freeing up space and IT resources at its London HQ. Enhanced Cost Efficiency: Reduced operational costs by integrating Amazon S3 Glacier Instant Retrieval and Amazon S3 Intelligent-Tiering. Optimized Storage Management: Automated data tiering based on access patterns to balance cost and performance. Improved Data Accessibility: Ensured seamless access to historical media archives for future content innovation.
Building a Future-Ready Data Lake
The BBC’s cloud migration is not just about cost savings and accessibility—it’s about innovation. With its archival content securely stored on AWS, the broadcaster now focuses on developing a comprehensive data lake. This centralized repository will power advanced analytics and machine learning (ML) applications, unlocking new capabilities such as: • Speech-to-text processing for historical broadcasts • Facial recognition for identifying individuals in archival footage • Automated metadata tagging to enhance searchability and categorization By embracing Amazon S3 Glacier Instant Retrieval, the BBC is building an infrastructure that will preserve its media legacy and revolutionize how historical content is accessed and utilized in the digital age.
Amazon S3 Case Study Examples: Lessons for Organizations Everywhere
The BBC’s experience provides a valuable blueprint for organizations looking to modernize their data management strategies. Key takeaways of this BBC Amazon S3 Case Study include: • Modernization is Essential: Cloud-based solutions like Amazon S3 Glacier Instant Retrieval significantly reduce operating costs and enhance data accessibility. • Scalability Matters: AWS storage solutions offer seamless expansion, ensuring long-term sustainability. • Future-Proofing Archives: A centralized data lake paves the way for leveraging machine learning, AI, and advanced analytics, unlocking new insights from historical data. Adopting AWS archive storage solutions can benefit organizations across industries, including media, government, and education, by ensuring efficient, cost-effective, and future-ready data management.
Summing Up
The BBC’s successful migration of 100 years of archival content to Amazon S3 Glacier Instant Retrieval is a testament to the transformative power of cloud-based archival storage. By overcoming high costs, fragmented data storage, and limited accessibility, the BBC has preserved its invaluable media heritage and set a new industry standard for digital archiving.

Air Navigation and Tableau: Simplifying Complexity
Learn how Tableau has aided the business in finding lucrative new sources of income and ensuring that airport operations run like clockwork even in challenging circumstances.
The pre-Tableau era in Aviation
The aviation industry used to spend a lot of time doing the same operations on a daily, weekly, or monthly basis before Tableau was introduced and used because most of the data processes lacked the ability to be automated. They had to manually enter this information into Excel and re-create the same report each week to give senior management the most recent traffic data from the airport, for example. Additionally, it may be difficult to find key insights buried in spreadsheets of flight and traffic data, which means that sometimes the companies might have missed opportunities to improve their operations altogether.
Tableau as a problem solver
Now that most of these previous manual operations are fully automated, hundreds of man-hours can be saved each month. Data is prepared in Alteryx, staged in SQL server databases, and then connected straight to Tableau, where it can be instantly refreshed. A new dashboard can be created at once, and it will never require manual upkeep or updating again. Because data is available whenever they need it, employees become more independent and can effectively address their own queries and analytics requirements. Different teams, including those in finance, capacity planning, operations, engineering services, investment planning, and more, use Tableau in this fashion.
Because of Tableau's focus on visual analytics, particularly mapping, it is much simpler to spot important patterns and trends in the data, such as newly popular airline destinations. Complex metrics are much easier to comprehend when you have that visual feel of the marketplace. Tableau is made to maximise geographic data, so you can understand both the "where" and the "why." Without the need for specialised software, everyone can conduct geospatial analysis thanks to out-of-the-box geocoding and beautiful interactive maps of Tableau.
Tableau drives new revenue streams
The Business Development team's main goal is to increase airport activity and attract additional airlines. To do this, companies must create a strong business case showing that there are unmet passenger demands. For instance, Tableau discovered sizable passenger traffic volumes that were travelling indirectly through other hubs to Dubai. They were able to identify and develop new market prospects for passengers who weren't previously served thanks to this information.
It used to take a lot of figures to be done crunching to uncover these insights, but today the teams can investigate the data using an automated Tableau dashboard that is updated monthly with ticketing data from the International Air Transport Association (IATA) database. To examine the most recent trends, Tableau can quickly explore the data on a global heatmap. This method saves companies days of manual analytics effort by providing them with the evidence that they need to develop airline offers quickly and persuasively.
Tableau and day-to-day operations
The airports that are open 24 hours a day, 7 days a week, must function flawlessly 24 hours a day. The weather is one of the biggest risks to this since it can abruptly cause serious interruptions. Fortunately, Tableau may be used to lessen the worst consequences. When the meteorological division issues a weather warning, Tableau examines the planned itinerary for the impacted timeframe and looks for airlines that operate several flights to/ from the same location. Then, to lessen the effects of this interruption while maintaining connectivity and customer service standards, Tableau collaborates with these airlines to proactively reschedule or cancel flights and combine the demand with fewer flights.
Beinex being Tableau Premium Partner provide sustainable analytics solutions and help organisations to build superior data visual analytics capabilities internally through our bespoke training programs. We have 100 years of combined experience in Tableau and are led by professionals who have successfully delivered Tableau projects in the region for large private and public sector organisations. Our team of Tableau-certified consultants are real-life Tableau business users who are passionate about Tableau and delivering a world-class experience. We have successfully implemented Tableau in various industrial sectors in the Middle East and in other countries too.
Start a free trial of Tableau. Try now!
Agentic AI and Enterprise Intelligence: Leading Trends, Challenges, and Opportunities in 2026 and Beyond
For a long time, enterprise intelligence relied on dashboards, reports, and predictive systems. These tools helped leaders see what happened and predict what could happen next. However, the users still had to interpret the results and act on them themselves.
Now, that approach is changing with the adoption of Agentic AI. According to Gartner research, 40% of enterprise applications are expected to include task-specific AI agents by 2026, up from less than 5% in 2025.