How AI Decision-Making is Improving Enterprise Outcomes
Blog
Share 
Data Blending for Spatial Analytics in Just 6 Steps Using Alteryx
 7 May 2024
  Sumi S
 What is Spatial Analysis?
Spatial analysis is the art and science of extracting insights from data that has a geographic component. Think of it as giving your data a physical address! Traditionally, this involved complex Geographic Information Systems (GIS) software. But today, spatial analysis is more accessible than ever, thanks to data science and machine learning.
Pinpointing locations on a map is just the first step. Spatial analytics goes far beyond that, offering a powerful lens to understand how relative location impacts your business. It allows you to see the bigger picture: how customers, stores, services, and other factors interact with each other geographically.
This magic happens by blending spatial data (think zip codes, store addresses) with your existing data sets (sales figures, customer demographics). By analyzing these combined datasets, you gain a wealth of insights that can transform your decision-making process.
What Spatial Analytics Can Do for You
Here's how spatial analytics can help you understand and optimize key areas:
- • Customer Behavior and Inventory: Analyze nearby consumer buying habits for specific products and services. This allows you to customize inventory and service experiences at each location based on local demand.
- • Strategic Location Planning: Optimize your location strategyby determining how the proximity of competitors or existing locations impacts new site expansion. You can also understand how far customers are typically willing to travel for your product or service.
- • Improved Customer Experiences: Ensure service availabilityand minimize service gaps by strategically locating key hubs within an appropriate distance from each other. This translates to a smoother and more efficient experience for your customers.
- • Targeted Marketing: Drive efficiencies in your marketing programs by customizing your offerings to match demographic purchasing preferences in specific locations. This targeted approach allows you to reach the right audience with the right message.
- • Import and Unify: Easily bring in various datasets, regardless of format.
- • Effortless Geocoding: Transform addresses and other location data into usable geographic coordinates with a few clicks.
- • Spatial Blending: Combine your location data seamlessly with traditional datasets for a holistic view.
- • Advanced Analytics Made Simple: Perform complex spatial analyses without needing specialized coding skills.
- • Data Enrichment: Boost your insights by adding demographic, firmographic, or industry-specific data to your spatial datasets.
- • Visualize and Explore: Discover hidden patterns and relationships through interactive maps and visualizations.
- • Gather Data: Gather all the data sets you need for your analysis, from customer information to market demographics.
- • Translate Your Addresses: Use Alteryx's geocoding tools to transform addresses and other location data into usable geographic coordinates.
- • Define Your Trade Zone: Create a virtual boundary to analyze specific locations based on radius
- • Blend Datasets Together: Seamlessly combine your spatial data with traditional datasets to create a comprehensive picture of customer-location relationships.
- • Use Advanced Spatial Analytics for Additional Insights: Perform complex spatial analyses within Alteryx's user-friendly interface, unlocking hidden insights without needing specialized coding skills.
- • Visualize and Share Your Findings: Prepare your data for reports and interactive visualizations that effectively communicate your insights. Alternatively, export the data for further analysis or integration with downstream processes.
How Alteryx Enables Data Blending for Spatial Analytics
Forget complex GIS! Alteryx's no-code tools make spatial analysis a breeze, unlocking location intelligence for all data users. Optimize resources, plan assets, manage logistics, and more - all in a user-friendly platform.
Alteryx offers an intuitive workflow that streamlines the entire process:
A 6-Step Recipe for Blending Spatial Data in Alteryx
Alteryx makes blending spatial data with your existing information a breeze. Here's a step-by-step guide to get you started:
Find a detailed 6-step guide for blending spatial data using Alteryx:
1. Gather Data
Alteryx's Input tool lets you grab data from anywhere – spreadsheets, databases, even social media! Just connect to your desired sources, and Alteryx will get your data ready for spatial exploration.

2. Turn Addresses into Locations:
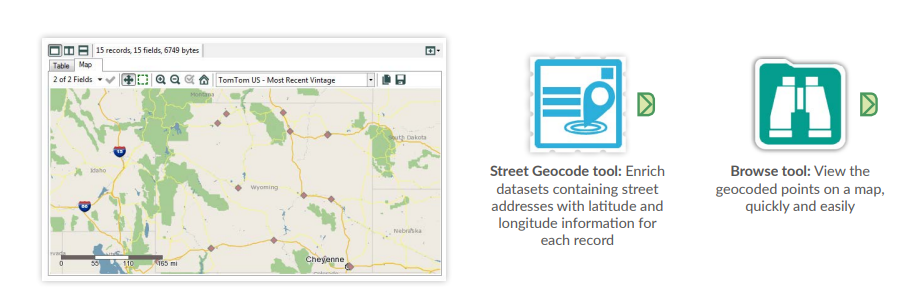
The Street Geocode tool in Alteryx quickly transforms your standard addresses (like customer locations or branch sites) into geographic coordinates (latitude and longitude). This "spatializes" your data, adding a new data point for each location.
In this example, we'll use it to geocode both customer and site data.
3. Define Your Trade Zone:
The Trade Area tool lets you see what's happening within a specific area around each location. For example, you can create a 10-minute drive time polygon. This "draws" a zone around each location, encompassing all areas reachable within a 10-minute drive using the road network.

4. Blend Datasets Together:
The Spatial Match tool lets you see how different sets of locations relate to each other. For instance, you can use it to find out how many customers live within (or outside) the 10-minute drive time zone you created for each location. It essentially compares your customer data points (spatial points) with the trade area polygons (spatial objects) to identify matches based on spatial relationships (like "contains" or "intersects").

5. Use Advanced Spatial Analytics for Additional Insights
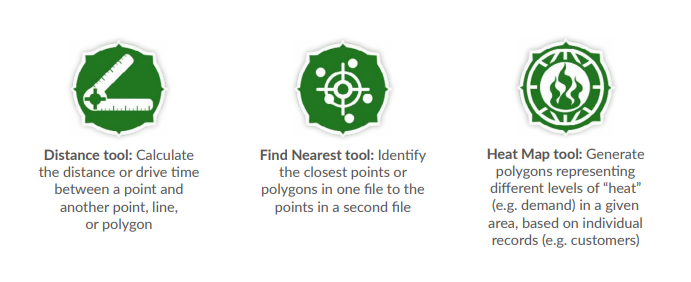
Alteryx offers a range of additional tools for advanced spatial analysis, making it accessible to users beyond data specialists. Additional tools include:
6. Visualise and Share Your Findings:
Alteryx doesn't just help you crunch data - it enables you to share your insights clearly.
Visualize Your Success: Overlay data on detailed maps or satellite imagery using advanced mapping tools.
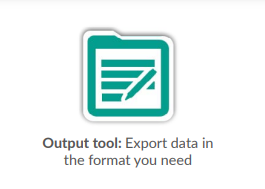
Spread the Knowledge: Export your analysis in various formats like Excel, ESRI, or even Tableau and Qlik for seamless integration with other data workflows and presentations.
Beinex + Alteryx Offerings
As a Premier Alteryx partner, we have extensive experience and a proven track record of success. Our team is highly skilled in Alteryx solutions and can help you unlock the full potential of this powerful platform.
Contact us today to learn more about how Alteryx and our partnership can take your business to the next level.
Image Source: https://community.alteryx.com/pvsmt99345/attachments/pvsmt99345/general-discussions/2303/2/Spatial_Cookbook_Victa.pdf
The world around us is brimming with location-based information. From customer addresses to crime hotspots, understanding the "where" behind your data can be incredibly powerful. This is where spatial analysis comes in.
Related Articles

Artificial Intelligence Services & Solutions to Grow Your Business in the UAE
Top 4 Common AI Implementation Challenges: How They Can Be Resolved
Businesses face several challenges, and some may seem small, but they can lead to massive losses over time if unaddressed. Let's see what they are and how AI can resolve:
- Manual and Repetitive Tasks
Spending time on repetitive tasks like filling forms and handling data entries decreases the productivity of your team. AI automation frees them to focus on strategic tasks like planning, problem-solving, and innovation. - Data Silos
When data is scattered across departments and tools, it results in difficulty in collaboration and slows down decision-making. With a connected data system powered by AI, your team can use it to drive value. - Loss of Customers
If your business is losing loyal clients due to slow responses and poor personalization, AI helps you respond faster, understand customer behavior, and build better relationships. - Static Production Lines
Production and operations stay rigid if your business can't easily adapt to demand changes, identify issues early, or scale smoothly. AI brings flexibility, helping you adjust in real-time.
How Beinex AI Services Solve Your Business Problems
Artificial Intelligence (AI) services & solutions help you lead in your industry. Here's what you get with Beinex:
- Strategic AI Consulting Services
Our expert consultants work closely with your team to define clear goals, assess your business environment, and develop a safe and effective AI implementation plan. We help you understand the true potential of AI and customize solutions for your specific needs. - AI Enablement Analysis
Businesses often have AI goals but lack clarity on scope, feasibility, and design. Beinex closes this gap by validating feasibility, selecting the right tools, and building a clear roadmap for success. - Exploratory Data Analysis
The next step is to analyze your existing data sources, assess them, and clean up any necessary issues. It ensures your AI system has strong foundations. - AI Training and Roadmapping
We align AI strategies with your business goals through awareness programmes to hands-on training. Our roadmap is practical, secure, and designed for real-world adoption. - AI-Powered Automation
By automating everyday tasks like report generation, approvals, and data processing, our AI solutions boost efficiency, cut costs, and save time. AI models like GPT-4, Claude, LLaMa, and PaLM 2 support modernizing legacy systems and enhancing your processes for speed, accuracy, and scale. - AI Agents for Support and Sales
AI-driven chatbots and voice agents can handle customer queries, sales interactions, and internal processes 24/7, resulting in faster service, cost reduction, and scaling operations. You can automate replies, generate content, and improve your digital experience instantly.
Book a Free Demo of Our Document Chatbot - Smart Product Integrations
We help you make your existing products smarter. You can upgrade your products with AI to meet customer needs using predictive analytics, recommendation systems, or adaptive automation. - Compliance and Security Consultation
We offer robust compliance measures to ensure you remain compliant with GDPR, CCPA, and HIPAA regulations, thereby mitigating potential risks and maintaining data integrity. - Generative AI Solutions & LLM Development
We build and integrate private GenAI models that create, understand, and automate content, ensuring your data remains secure and compliant. - Predictive Analytics and Forecasting
By analyzing historical data, we help you forecast trends, predict outcomes, and make proactive decisions.
AI Solutions for Every Industry
At Beinex, we offer AI solutions tailored to your industry. Here's how we support various domains:
Healthcare
We automate patient scheduling, assist with medical inquiries, and support diagnostics using AI, resulting in improved care delivery, reduced wait times, and improved hospital operations.
Read Our AI in Healthcare Case Study on Cardiovascular Disease Prevention!
Retail Industry
Our AI tools help retailers manage inventory, pricing, and customer service more effectively. It assists in demand forecasting and in delivering personalized shopping experiences to customers.
Finance and Banking
AI in finance automates loan approvals, detects fraud, and offers personalized financial insights to customers. AI agents assist with customer queries, boosting efficiency and security.
Explore Our AI Solutions in Banking!
E-commerce
We implement AI recommendation engines and chatbots that boost engagement, conversions, and retention. Inventory forecasting and automated marketing become more intelligent and efficient.
Education
AI-powered tutoring adapts to students' performance. Automated grading tools reduce the burden of admins, and virtual learning assistants make classes interactive and engaging.
Energy and Utilities
AI helps monitor grid performance, predict failures, and optimize consumption. We support green energy efforts through real-time analytics and predictive maintenance.
Equip Your Business with the Right AI Strategy
Businesses waste time and money as they struggle with manual processes, lost data, and disconnected teams. At Beinex, we help you fix that with our Artificial Intelligence solutions. As a leading AI services and development company in the UAE, Beinex offers intelligent solutions that are practical, scalable, and results-driven.
AI should bring value to your business and support you in growing. Whether you're just starting or looking to expand your AI strategy, Beinex, as one of the first recipients of the prestigious Dubai AI seal, can assist you. We bring innovation to your business with practical, reliable, and high-impact Artificial Intelligence services in Dubai, UAE. We offer:
- • Deep expertise in AI and ML solutions
- • Strong strategic and technical consulting
- • End-to-end support from design to deployment
- • Proven results in various domains
Connect with us: https://beinex.com/contact-us/
References:

Preparing for AGI: What Leaders and Executives Need to Know
What is AGI (Artificial General Intelligence)?
Artificial General Intelligence (AGI) refers to an AI that, in theory, can think, learn, and understand more like a human. It is designed to perform any intellectual task a human can do. However, AGI remains a theoretical concept, and current AI systems have not yet achieved true cognitive abilities, reasoning skills, or emotional intelligence comparable to humans. Rapid advancements suggest that reaching a form of AGI is not beyond possibility. Given the unprecedented growth of AI in recent years, it's wise to stay informed and prepared.Generative AI vs. AGI vs. ASI: Understanding the Difference
Generative AI is a subset of deep learning that predicts responses based on extensive training data. These models, including ChatGPT and Midjourney, are powerful but still fundamentally narrow AI systems. They lack true understanding, common-sense reasoning, and emotional intelligence. Conversely, Artificial General Intelligence (AGI) is regarded as a strong form of AI. Like human intelligence, it would be self-aware, flexible, and capable of solving problems in various fields. AGI might learn, reason, and apply knowledge across domains without explicit training, in contrast to GenAI, which works within predetermined tasks. Even if AGI is yet theoretical, it has enormous potential to change society and industry. Beyond human intelligence, Artificial Super Intelligence (ASI) can tackle issues beyond human comprehension. For example, an ASI system might be able to create novel medicinal treatments or extremely efficient energy systems. Nonetheless, ASI is still primarily theoretical and a subject of discussion and assumption.GenAI vs. AGI vs. ASI: Key Differences
Here are the main differences between GenAI, AGI, and ASI:| Generative AI (GenAI) | Artificial General Intelligence (AGI) | Artificial Super Intelligence (ASI) |
|---|---|---|
| AI that generates text, images, audio, and code based on training data | AI with human-like reasoning, learning, and problem-solving across all domains. | AI that surpasses human intelligence and capabilities |
| Generates content, predicts patterns, and automates tasks | Understands, learns, and adapts like a human across multiple fields. | Thinks, learns, and innovates beyond human intelligence |
| Examples: ChatGPT, Midjourney, DALL-E, Bard | A self-learning AI that can pass human-level exams and perform diverse tasks. | An AI that can autonomously innovate, research, and make better decisions than humans. |
| Mimics creativity but lacks true understanding | Matches human cognitive abilities. | Beyond human intellectual capacity |
| Fully functional and widely adopted | Estimated timeframe is 2030–2050 (speculative). | Not yet possible with current technology |
AGI and Businesses: How Executives Can Prepare for AGI
The best way to keep up with new technology isn’t to wait until it arrives; it’s to prepare before it changes everything. Here are a few simple ways to get ready for Artificial General Intelligence (AGI):1. Stay Informed and Monitor AI Advancements
The first step in getting ready is to comprehend how quickly AI is advancing. Executives should keep an eye on new advancements in AGI, legal reforms, and AI research. Keeping tabs on start-ups, business leaders, and research organizations can yield insightful information.2. Invest in AI Skills
But there's no point in waiting for AGI to happen; smart leaders should be ready now. Leading businesses should invest in automation and artificial intelligence to gain a competitive edge. Developing AI expertise within your organization, whether through employing AI experts, educating employees, or implementing AI-powered technologies, will lay a strong foundation for future AGI integration.3. Develop a Robust Data Infrastructure
High-quality data is essential for AI to flourish. Businesses should ensure their data ecosystems are safe, organized, and ready for AI-driven insights. Adopting the retrieval-augmented generation (RAG) models and cloud-based AI solutions improves AI applications and prepares for more complex systems like artificial general intelligence.4. Adopt a Human-centric AI Approach
Even with AI's expanding capabilities, human monitoring is still crucial. "Human-in-the-loop" models, in which AI complements human decision-making rather than replaces it, should be given top priority by executives. Employee resistance to automation can be decreased, and productivity can be increased by teaching them how to work with AI tools.5. Address Ethical and Security Considerations
Ethical issues like bias, security, and data privacy are becoming increasingly urgent as AI develops. Executives must implement governance structures to ensure accountability and transparency in AI deployments. AGI readiness will also depend on how well cybersecurity threats and compliance laws are handled.6. Organize Teams for AI-driven Workflows
An AI-driven world may require adaptability that traditional organizational structures may not be able to provide. Employers should consider flexible workforce models in which staff members switch between projects regularly. AI literacy upskilling programs can facilitate employees' hassle-free transition into AI-augmented roles.7. Experiment with AI Investments
While AGI is still a way off, companies should start making calculated investments in AI research, automation driven by AI, and cognitive computing. When artificial intelligence (AGI) becomes economically viable, companies that invest in AI-driven innovation can become early adopters.The Business Impact of GenAI: Current Trends and ROI
While Generative AI (GenAI) is already revolutionizing industries with quantifiable return on investment, Artificial General Intelligence (AGI) is still a vision for the future. A 2024 Deloitte survey identified key sectors where organizations are experiencing notable advances: • Text Generation (83%) – Automating reports, document summarization, and marketing content. • Code Assistance (62%) – Helping developers write code efficiently with fewer errors. • AI-Powered Call Centers (56%) – Reducing customer service costs by up to 90%. • Image & Video Generation (55%) – Creating product simulations and marketing materials. Additionally, enterprises are increasingly adopting multi-model AI approaches, using a mix of open-source and proprietary models to tailor-made solutions and avoid vendor lock-in.The Future of Leadership in an AGI-Driven World
AGI might still be years away, possibly emerging between 2030 and 2050, but its impact will be massive. Proactive leaders can get ahead by using today’s AI, building flexible systems, and creating a culture of continuous learning. Companies that embrace AI now won’t just keep up; they’ll lead the way when machines start thinking more like humans. So, leaders, now’s the time to act.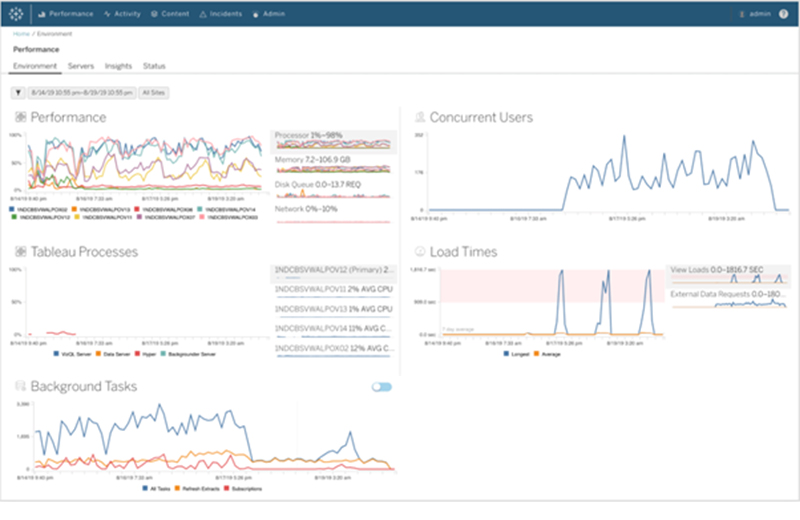
A DEEP DIVE INTO TABLEAU 2019.3
TABLEAU CATALOG
What could be better than a feature that could provide better visibility and better data management at the same time, and also ensure that the right data is always used for analysis. This is possible with the new feature -Tableau Catalog.
 This feature provides a complete picture of the data and how each data is connected.
Another use of Tableau Catalog is linear and impact analysis. This not only shows which assets will change but also who will be affected by it, which makes work easier for many and avoids wastage of time.
EXPLAIN DATA
Tableau 2019.3 is up with a new Al-driven feature called the “Explain Data”, which helps people go from the “what” of the data to the “how” of it. With explain data, we can get an explanation for each unexpected value in the data by just a single click. On selecting the desired data point, the ‘explain data’(lightbulb) icon appears.
For each value there might be a number of explanations. Each of these explanations are checked and only the most likely ones are provided as visualizations.
This feature provides a complete picture of the data and how each data is connected.
Another use of Tableau Catalog is linear and impact analysis. This not only shows which assets will change but also who will be affected by it, which makes work easier for many and avoids wastage of time.
EXPLAIN DATA
Tableau 2019.3 is up with a new Al-driven feature called the “Explain Data”, which helps people go from the “what” of the data to the “how” of it. With explain data, we can get an explanation for each unexpected value in the data by just a single click. On selecting the desired data point, the ‘explain data’(lightbulb) icon appears.
For each value there might be a number of explanations. Each of these explanations are checked and only the most likely ones are provided as visualizations.
 Now these visualizations can be used for further explorations.
TABLEAU SERVER MANAGEMENT ADD-ON
Organizations that run critical deployment of Tableau Server at a large scale, have mentioned concerns over manageability and scalability. They have been in search for tools that could organize the management process in an efficient way, which could save a lot of time. Tableau solved this problem by introducing the Tableau Server Management Add-on – a new feature designed to help organizations manage the deployment of Tableau Server. With this, they can quickly react to the changing needs of the business as well as save time by organizing the management process in the most efficient way. Tableau Server Management Add-on, which makes running the critical deployment of tableau at a large-scale server much simpler.
Now these visualizations can be used for further explorations.
TABLEAU SERVER MANAGEMENT ADD-ON
Organizations that run critical deployment of Tableau Server at a large scale, have mentioned concerns over manageability and scalability. They have been in search for tools that could organize the management process in an efficient way, which could save a lot of time. Tableau solved this problem by introducing the Tableau Server Management Add-on – a new feature designed to help organizations manage the deployment of Tableau Server. With this, they can quickly react to the changing needs of the business as well as save time by organizing the management process in the most efficient way. Tableau Server Management Add-on, which makes running the critical deployment of tableau at a large-scale server much simpler.
 The server management add-on feature can help in optimising the performance of deployment by customizing which nodes process background jobs such as extract refreshes and subscriptions and isolating these workloads, to specific nodes. This makes it easier to scale deployments to the needs of their organization.
This feature has a few tools, including two for better reliability and scalability and one for content migration, all of which helps the organizations to govern their data effectively.
If you are interested in learning more about the latest Tableau release and use cases, please contact us at training@beinex.com/ info@beinex.com and we would be happy to schedule a Tableau demo or training for you and your company.
The server management add-on feature can help in optimising the performance of deployment by customizing which nodes process background jobs such as extract refreshes and subscriptions and isolating these workloads, to specific nodes. This makes it easier to scale deployments to the needs of their organization.
This feature has a few tools, including two for better reliability and scalability and one for content migration, all of which helps the organizations to govern their data effectively.
If you are interested in learning more about the latest Tableau release and use cases, please contact us at training@beinex.com/ info@beinex.com and we would be happy to schedule a Tableau demo or training for you and your company.
This feature provides a complete picture of the data and how each data is connected.
Another use of Tableau Catalog is linear and impact analysis. This not only shows which assets will change but also who will be affected by it, which makes work easier for many and avoids wastage of time.
EXPLAIN DATA
Tableau 2019.3 is up with a new Al-driven feature called the “Explain Data”, which helps people go from the “what” of the data to the “how” of it. With explain data, we can get an explanation for each unexpected value in the data by just a single click. On selecting the desired data point, the ‘explain data’(lightbulb) icon appears.
For each value there might be a number of explanations. Each of these explanations are checked and only the most likely ones are provided as visualizations.
Now these visualizations can be used for further explorations.
TABLEAU SERVER MANAGEMENT ADD-ON
Organizations that run critical deployment of Tableau Server at a large scale, have mentioned concerns over manageability and scalability. They have been in search for tools that could organize the management process in an efficient way, which could save a lot of time. Tableau solved this problem by introducing the Tableau Server Management Add-on – a new feature designed to help organizations manage the deployment of Tableau Server. With this, they can quickly react to the changing needs of the business as well as save time by organizing the management process in the most efficient way. Tableau Server Management Add-on, which makes running the critical deployment of tableau at a large-scale server much simpler.
The server management add-on feature can help in optimising the performance of deployment by customizing which nodes process background jobs such as extract refreshes and subscriptions and isolating these workloads, to specific nodes. This makes it easier to scale deployments to the needs of their organization.
This feature has a few tools, including two for better reliability and scalability and one for content migration, all of which helps the organizations to govern their data effectively.
If you are interested in learning more about the latest Tableau release and use cases, please contact us at training@beinex.com/ info@beinex.com and we would be happy to schedule a Tableau demo or training for you and your company.
Note: The Server Management Add-on is not available for Tableau Online, as they manage everything from scaling, performance, and security on behalf of their Tableau Online customers. The Tableau Server Management Add-on can be separately purchased from the Tableau Server deployment.
DATA MONETIZATION USING SNOWFLAKE
Most of the companies operating today are data-driven as they have started identifying the value of data. The value of data and data marketplaces are evolving with the growth of big data and data requirements of companies.
Understand your Data Offerings - What types of data or data services are you producing that would be valuable to other organizations?
Decide How to Price Data Products - What should be the pricing strategy followed, and how easy would it be to put into action?
Know About Data Sharing Methods - Which distribution channel should be selected for data sharing that adheres to GDPR and data governance policies?
Once you have decided on the data offerings and priced the data products, the key to successfully monetize your data is by sharing the data with the clients/ prospects. The customers and business partners would be eager to get data from you, especially if you can make the process easy and secure. Traditional data sharing technologies often use FTP, Cloud Storage, or API. These methods generally do have few disadvantages.
Data Marketplace
In simple terms, these are online marketplaces where we can buy and sell data of any sort. Data marketplaces offer several kinds of data from a wide range of different data sources. These data include Business Intelligence, demographics, research, and marketing data. Data types are structured and offered to clients by data providers. Providing buyers with more choice of high-quality data generates more engagement and encourages fair pricing between the sellers. Every company has the potential to earn revenue from the information it generates. In a recent study of more than 400 organizations, only 1 in 12 were monetizing their data to its fullest extent. Modern data monetization strategies can help you open brand new revenue streams. There are 3 key steps to monetize your data and drive new revenue streams.- Storage costs for both vendors and buyers
- ETL costs and effort
- Security vulnerabilities
- Service and support costs
- Latency and potential errors leading to poor customer experience
Snowflake & Data Monetization
Snowflake is an analytic data warehouse provided as Software-as-a-Service (SaaS). It provides a data warehouse that is faster, easier to use, and far more flexible than traditional data warehouse offerings. Snowflake allows companies to easily publish a variety of data sets that become immediately available for use or purchase for clients. Snowflake Data Exchange, a modern data sharing method, reduces the time to market and significantly influences customer success. Data Exchange is your own data hub for securely collaborating around data between a selected group of members that you invite. It enables providers to publish data that can then be discovered by consumers. The benefits of Snowflake Data Exchange over Traditional Data sharing Methods are:- Secure Data Sharing
- Exchange data within your organization between different business units. Collaborate with external parties such as vendors, suppliers, partners, and customers.
- Reduce Time to Market
- Break down data silos and reduce time to market.
- Interchange data with third-party vendors to help augment internal datasets.
- Break down data silos by scaling multiple data sets from different sources within your organization.
- Find and consume data on other Data Exchanges to get business insights.
- Speed of Processing
- Snowflake’s multi-cluster shared data architecture is designed to process enormous quantities of data with maximum speed and efficiency.
- All data processing horsepower within Snowflake is performed by one or more clusters of computing resources.
- Data is cached locally within computing resources, along with the caching of query results, to improve the performance of future queries.
- Cost Benefits
- The costs for sharing data with Snowflake are minimal and straightforward.
- Simply pay for the data you store, i.e., you only pay for what you use.
- Reduce extract, transform, load (ETL), and data pipeline maintenance costs.
- Control and Govern Access
- Managing membership
- Granting and revoking access to data through standard and personalized listings
- Auditing data usage
- Applying security controls to your data
Real-life Implementation
A famous telecom organization in Europe was sitting on large silos of data that they could not monetize properly because of the complex architecture of the data warehouse operations and data security challenges involved in the data sharing process. The company has Customer Daily Records (CDR) of its subscribers that contains location data of the users. This data can be used to identify the places people visit and help with building consumer profiles. The gathered data allows advertisers to target messages to specific users while tracking whether they visited a retail store after seeing a mobile ad. This helps them plan personalized marketing strategies and business goals based on demography profiles for targeted users. However, due to the data privacy policies of the European Union like GDPR, organizations were struggling to share data with their potential clients. The GDPR policy makes it mandatory for organizations to ensure that the customer's personal information is not shared with third parties without the customer's consent and involves hefty fines and penalties for the data breach. Even the data sharing process was a source of concern as the data was often shared in text/excel files because of the different database architecture of the clients. With growing data privacy concerns and challenges in creating datasets adhering to the GDPR policies, organizations are strictly asked not to share customer data with third parties. The current system architecture forced the organizations to employ a large number of resources to extract the data from the database system and ensure that customer data is not compromised at any point. The companies were evaluating the possibilities of a potential system that would help them monetize the data they currently hold. The introduction of Snowflake into the organizational architecture solved the data monetization problem and improved the overall data culture in the organization. The unique architecture of Snowflake separates the data storage and computation layer to enhance organizational productivity. The pay as you use policy of the Snowflake and the zero maintenance of infrastructure helped the organization phase out the complex on-premise solutions required to handle the huge data volume. Easy connectivity with the existing solutions used for data analytics practice and on the fly scalability of the computation layer helped the organization increase productivity. It also paves the way for seamless integration to the organization's architecture. The Data Marketplace of Snowflake ensured secure data sharing with third parties adhering to the GDPR policies. The in-built data security policies and features minimize the role of organizations to provide data privacy as well. This enables the organizations to make only those data points visible to end-users that they seemed apt for sharing. It also ensures that the data always resides in the organizational Snowflake database rather than on third-party databases. Moreover, the organizations could reach out to thousands of potential clients through Snowflake Data Marketplace without relying on any intermediatory sources. All this ultimately brings out the scope of using the existing data to drive revenue to the organization and highlights the importance of having a complete environment like Snowflake to capture, preserve, access, and transform data. Authors: Rahul Vijayan, Firdous Maqbool
Measuring Data Culture Maturity: How to Evaluate and Maximize the Benefits of a Mature Data Culture
What is the Data Culture Maturity Model?
The Data Culture Maturity Model by Alation is a framework designed to guide organizations through various levels of data proficiency. It categorizes data culture maturity into distinct stages, allowing organizations to understand their current position, set achievable goals, and implement strategies to progress further. This model addresses data discovery, data governance, data literacy, and data leadership elements that collectively foster a robust data culture. Each phase in the model encourages organizations to embed data at the core of their operations, transforming it into a valuable resource for decision-making and competitive advantage.
Why is Data Culture Maturity Important?
Data culture maturity is crucial for leaders who recognize that a data-driven approach can be a differentiator in today's competitive market. For CDOs, CIOs, BI professionals, and business leaders, fostering a mature data culture means establishing a strong foundation for data-enabled innovation and agile decision-making. As data culture evolves, organizations can explore the benefits of data self-service, increase trust in data, and leverage data literacy to make decisions backed by concrete insights.
Empowering a Data Culture: Key Tenets
The Alation Data Culture Maturity Model comprises four core tenets that organizations should focus on to elevate their data culture: Data Search & Discovery, Data Governance, Data Literacy, and Data Leadership. Let’s explore each tenet and its role in building a mature data culture.
1. Data Search & Discovery
Data Search & Discovery is the foundation of any data culture. It focuses on enabling users to quickly and easily find, understand, and trust the data they need. Organizations with mature data search capabilities invest in technologies like data catalogs, which streamline data search through features like intuitive search, contextual data, and cross-platform integration. These tools reduce the time users spend searching for data, empowering analysts to focus on value-added tasks instead of answering repetitive data queries. Alation pioneered the data catalog concept, which has evolved into a comprehensive data intelligence platform. The modern data catalog supports not only data search and discovery but also functions like data governance and cloud migration. These capabilities create a data culture that encourages self-service and fosters a deeper understanding of the data available to all employees. Measuring Value: Data search maturity can be measured by the time saved on data searches, the frequency of data queries, and the volume of self-service analytics. Organizations can leverage these metrics to assess their return on investment (ROI) and the efficiency of their data catalog.2. Data Governance
Data Governance establishes the rules and policies that ensure data is managed responsibly and is readily accessible and secure. In a mature data culture, governance extends beyond compliance, enhancing data search and data literacy. Organizations with strong governance frameworks reduce the risk of regulatory fines, establish data trustworthiness, and improve data quality. Defining Data Governance: Data governance can be seen as the “authority and control” over data assets. This entails organizing policies, procedures, roles, and responsibilities to align with the company’s data goals. Alation emphasizes that governance must go beyond traditional definitions to include active governance, which fosters collaboration, defines common data language, and establishes shared processes. Measuring Value: Effective governance can be measured by the percentage of data assets that meet governance standards, the number of governance-related issues resolved, and regulatory compliance rates. This not only assures data quality but builds trust in data for decision-making.3. Data Literacy
Data Literacy is about ensuring that individuals at all levels can read, work with, analyze, and argue with data. This element focuses on equipping employees with the skills to understand and utilize data effectively, bridging the gap between raw data and actionable insights. Building data literacy involves training, creating a framework for collaboration, and promoting data-driven thinking. Building Data Literacy: Successful data literacy programs generally follow a step-by-step approach, starting with assessments, followed by targeted training, and promoting an internal culture of data use. Organizations can embed literacy initiatives in data catalogs, where employees can access learning resources, engage in discussions, and collaborate with subject-matter experts. Measuring Value: Data literacy maturity can be assessed by monitoring the percentage of catalog contributions from a broad base of users, showing a shift from “gut-based” to data-driven decision-making. Additionally, organizations can track the frequency of cross-departmental data collaborations as an indicator of a well-integrated data culture.4. Data Leadership
Data Leadership is the most vital element, acting as the catalyst that drives data culture maturity forward. Effective data leaders champion data initiatives, implement change management programs, and consistently highlight the connection between data and business outcomes. They focus on aligning data objectives with strategic goals, ensuring that data initiatives generate tangible business value. The Role of Data Leadership: Mature data leaders embed data in strategic planning, empower departments to utilize data in decision-making, and foster a data-driven mindset throughout the organization. They work to make data initiatives visible, promoting metrics and KPIs that reflect the value added by data maturity. Measuring Value: Organizations can measure data leadership through the number of data stewards and subject matter experts identified, the impact of data on key business outcomes, and the frequency of data-driven initiatives across departments. When leadership drives data culture, the organization benefits from enhanced innovation, agility, and competitive advantage.Articulating Business Value Through Data Maturity
One of the primary objectives of the Data Culture Maturity Model is to showcase how advanced data culture drives business outcomes. To demonstrate this, data leaders can tie maturity metrics to specific business cases, such as self-service analytics, regulatory compliance, and data democratization.
Self-Service Analytics
In organizations with high data culture maturity, self-service analytics is a practical application. With accessible data catalogs and robust data literacy programs, employees can independently search, analyze, and interpret data. This capability speeds up decision-making and fosters a sense of ownership in data-driven outcomes. Measuring Success: Key metrics include time saved in data discovery, the reuse of existing data reports, and improved analytics turnaround. Organizations with a mature self-service model also report a higher degree of cross-departmental data sharing, indicating a well-established data culture.Active Data Governance
Active data governance ensures that data is handled in a structured and compliant manner. This framework allows organizations to confidently share data, meet regulatory standards, and promote accountability. Cataloging data assets facilitates governance, giving leaders insight into who accesses data, where it’s used, and how it complies with policies. Measuring Success: Metrics such as compliance rates, the reduction of data-related risks, and the number of governance-compliant assets serve as valuable indicators. Strong governance fosters trust in data, enhancing organizational agility and data-driven decision-making.Cloud Data Migration
Cloud data migration initiatives also benefit from a mature data culture. When data is cataloged and governed effectively, migrating to the cloud becomes a streamlined process. Migrating to cloud-based platforms not only reduces infrastructure costs but enables scalable data access and faster analytics. Measuring Success: Metrics to gauge the success of cloud migration include the speed of migration, the reduction in storage costs, and the increased accessibility of data post-migration. A data-mature organization can better leverage cloud capabilities for innovation and resilience.Conclusion: Tying It All Together
The Alation Data Culture Maturity Model provides a comprehensive framework for organizations looking to elevate their data culture. By focusing on data search & discovery, governance, literacy, and leadership, companies can foster a data-centric environment where data is trusted, accessible, and utilized effectively. Measuring the maturity of these components helps organizations quantify their data culture and demonstrate the business value added at each stage. In partnership with Alation, Beinex delivers comprehensive data governance solutions that enhance discoverability, enforce robust access controls, and streamline data auditing processes. By leveraging Alation's industry-leading data intelligence platform, Beinex helps organizations optimize their data strategies, driving business growth and operational efficiency. Connect with us for the transformation you seek: https://beinex.com/data-governance/