How AI Decision-Making is Improving Enterprise Outcomes
Blog
Share 
Infographics | Cloud Storage and On-Premise Storage: The Tug of War that Never Ends, Ends Now
 29 April 2022
  Sanchit Katiyar
 Amidst cloud storage's ripening, corporate IT departments continue to weigh the pros and cons of on-premise storage vs cloud storage. Before making the right choice for your company, it is always better to analyse the differences between on-premises and cloud-based services and infrastructure.

For companies juggling a massive amount of data, cloud platforms are a boon. Many have adopted cloud storage for flexibility, ease of access, fast scalability, and cut short expenditures. Cloud deployments that are well-architected and managed offer significantly greater infrastructure flexibility and real cost-effectiveness. According to Gartner's prediction, by 2025, more than 95 percent of new digital workloads will be deployed on cloud-native platforms, up from 30 percent in 2021.
Related Articles

Tackling the Bias in Artificial Intelligence: Four Measures to Adopt
“AI bias” has been a trending hot subject of research and concern for a while. Recently ChatGPT, the latest language learning model released by OpenAI, has become a viral sensation. However, like many AI models before it, bias can be found in its output. AI bias is a phrase used to characterise circumstances in which ML-based data analytics algorithms exhibit bias towards specific categories of individuals. These biases are typically manifestations of pervasive societal biases about race, gender, biological sex, age, and culture.
In AI, there are two types of bias. The first is algorithmic AI bias, often known as "data bias," in which algorithms are trained with biased data. The other type of AI prejudice is societal AI bias. This is where our societal beliefs and conventions cause us to have blind spots or particular expectations in our thinking. Societal bias impacts algorithmic AI bias, but as the latter grows, we see things come full circle.
Some concerns should be addressed and resolved on a worldwide scale and other issues should be addressed locally. Every principle and standard, governing body, and people voting on things and algorithms should be verified from time to time. Making a more diverse data collection will not fix the problem. But that is just one factor.
In short, the fact is that an impartial human mind, as well as an AI system, will never be realised. After all, people are the ones who generate the skewed data, and humans and human-made algorithms are the ones who evaluate the data to find and rectify biases. However, we can overcome AI bias by validating data and algorithms and applying best practices to collect data, use data, and construct AI algorithms.
In AI, there are two types of bias. The first is algorithmic AI bias, often known as "data bias," in which algorithms are trained with biased data. The other type of AI prejudice is societal AI bias. This is where our societal beliefs and conventions cause us to have blind spots or particular expectations in our thinking. Societal bias impacts algorithmic AI bias, but as the latter grows, we see things come full circle.
What can We Do to Address AI Biases?
Here are some of the remedies:Algorithm Testing in a Real-World Situation
For example, take the case of job seekers. If the data used to train your machine learning system comes from a select group of job searchers, your AI-powered solution may be untrustworthy. While this may not be a problem if you apply AI to similar candidates, it becomes a problem when you apply it to a new group of candidates that aren't represented in your data collection. In this case, you simply ask the algorithm to apply the prejudices it learnt from the first candidates to a group of people where the assumptions may be inaccurate. To avoid this, as well as to discover and resolve these flaws, you should test the algorithm like how you would use it in the real world.Considering the So- called Counterfactual Fairness
The meaning of "fairness" and how it is calculated are up for debate. It may also change owing to external factors, implying that the AI must account for these changes as well. Researchers have also worked on a variety of approaches to ensure AI systems can meet them, such as pre-processing data, altering the system's choices after the fact, and including fairness definitions in the training process itself. A potential solution is "counterfactual fairness," which ensures that a model's choices are the same in a counterfactual world where sensitive attributes like ethnicity, gender, or sexual orientation have been altered.Consider Human-in-the-Loop Systems
The purpose of Human-in-the-Loop technology is to accomplish what neither a human nor a machine can do on their own. When a machine confronts a problem, humans must intervene and fix the problem for them. As a result of the continual feedback, the system learns and improves its performance with each consecutive run. Finally, human-in-the-loop leads to more accurate rare datasets of safety and precision.Change the Way People Learn About Science and Technology
A significant shift is required in the approach to how people are educated about technology and science. It is high time to restructure science and technology education. Science is currently taught objectively, and more transdisciplinary collaboration and educational rethinking are required.Some concerns should be addressed and resolved on a worldwide scale and other issues should be addressed locally. Every principle and standard, governing body, and people voting on things and algorithms should be verified from time to time. Making a more diverse data collection will not fix the problem. But that is just one factor.
Will Artificial Intelligence Ever be Unbiased?
The answer is both no, and yes. Well, it's feasible, but an impartial AI is only in dreams and probably it will never exist. This is because an impartial human intellect is unlikely to ever exist. An AI system is only as good as the data it gets as input. Assume you can free your training dataset of conscious and unconscious biases regarding race, gender, and other ideological concepts. In such a situation, you'll be able to build an artificial intelligence system that makes objective data-driven decisions.In short, the fact is that an impartial human mind, as well as an AI system, will never be realised. After all, people are the ones who generate the skewed data, and humans and human-made algorithms are the ones who evaluate the data to find and rectify biases. However, we can overcome AI bias by validating data and algorithms and applying best practices to collect data, use data, and construct AI algorithms.
Why choose Beinex AI & Automation Services
Beinex, in line with industry standards, helps in the adoption and integration of AI & Automation, hands down. Our support program chips in when interventions or inputs are necessary. And we have comprehensive and robust lab-to-industry processes and pipelines that are morally, ethically sound and cutting edge in character.Experience-induced Agility
Beinex has a talent pool of coveted consultants who are change agents in diverse domains capable of ushering in an organisation-wide transformation in terms of People-Process-Technology-Data. The depth and breadth of their experience adds to agility and brings adaptability to business contexts.Tool Mastery & Use-case Libraries
The Consultants at Beinex are masters of the tools they operate in. They are well-versed in the range of tools available in the market of which Beinex is a partner to many of them. A robust eco-system of use-case libraries results in minimal turnaround time from a business point of view.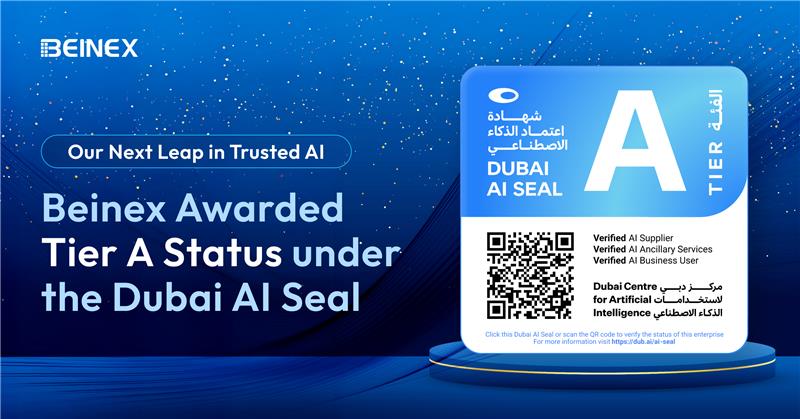
Beinex Advances to Tier A Status of Dubai AI Seal: Leading with Trust and Impact in AI Excellence
Beinex has achieved a Tier A status under the prestigious Dubai AI Seal, awarded by the Dubai Centre for Artificial Intelligence (DCAI) and Dubai Future Foundation (DFF). This upgrade marks a significant advancement in Beinex's AI journey, reflecting our commitment to building trusted, responsible AI solutions that align with Dubai's vision for ethical and future-ready innovation.

Learning to Trust Zero Trust
ZTA in Simple Terms
It is a cybersecurity paradigm focused on enterprise resource protection. This includes data; no matter where it resides, cloud or on-premises, and resources like printers, compute resources and Internet of Things (IoT) actuators. The objective of the paradigm is to prevent unauthorised access to data and resources but at the same time enable authorised and approved subject to have access to the same. The word subject can mean user, device or an application/ service. The paradigm also envisions making the access control enforcement as granular as possible. Thus, “Zero trust architecture (ZTA) is an enterprise’s cybersecurity plan that utilizes zero trust concepts and encompasses component relationships, workflow planning, and access policies. Therefore, a zero-trust enterprise is the network infrastructure (physical and virtual) and operational policies that are in place for an enterprise as a product of a zero trust architecture plan.” Zero trust (ZT) provides a collection of concepts and ideas designed to minimize uncertainty in enforcing accurate, least privilege per-request access decisions in information systems and services in the face of a network viewed as compromised. The crux of the concept is that trust must be continually evaluated. If a subject needs access to data or resources, it is granted after authentication and authorisation, but it will not go beyond the minimum privileges needed to perform the mission.Benefits of Implementing ZTA
The ZTA paradigm comes packed with a slew of benefits:- Supporting employees/ workers with secure and reliable access to a multitude of resources from anywhere using any device, any time
- Resource protection irrespective of whether it is on-prem or cloud
- Improving visibility and governance: who, what, and how users are accessing enterprise data and apps.
- Limiting of insider threat borne of the need-to-know approach to resource access
- Limiting of lateral movements of attackers in the system which perimeter security-oriented networks are otherwise prone to.
- Limiting the cost for recovery and mitigation
- Ensuring confidentiality and security of sensitive enterprise data
- Enhanced risk mitigation courtesy of continuous assessment and review of resource access
ZTA: How it Works
The Zero Trust Architecture evaluates the level of confidence about the subject’s identity for a unique request and if the device used to place the request have proper security posture. The system also evaluates if there are other factors that should be considered and that change the confidence level. Also the access rules are made as granular as possible to enforce those least privileges needed to perform the action in the request. Image courtesy: https://nvlpubs.nist.gov/nistpubs/SpecialPublications/NIST.SP.800-207.pdf
Three terms assume significance in the context of Zero Trust. They are Implicit Trust Zone, Policy Decision Point (PDP) and Policy Enforcement Point (PEP). Implicit Trust Zone represents an area where all the entities are trusted to at least the level of the last PDP/PEP gateway. In other words, the PDP/ PEP engine decides as to whether a request for resource should be allowed access to the Implicit Trust Zone from where it can access the resource.
The PDP/ PEP gate is more like an airport security checkpoint. The passengers, once they have been through the security check are granted access to boarding gates where they can wait for the entry to the airplane. They are considered worthy of trust once they are through. The boarding area is thus the Implicit Trust Zone in the analogy. In our case, the idea is to explicitly authenticate and authorize all subjects, assets and workflows that make up the enterprise.
Image courtesy: https://nvlpubs.nist.gov/nistpubs/SpecialPublications/NIST.SP.800-207.pdf
Three terms assume significance in the context of Zero Trust. They are Implicit Trust Zone, Policy Decision Point (PDP) and Policy Enforcement Point (PEP). Implicit Trust Zone represents an area where all the entities are trusted to at least the level of the last PDP/PEP gateway. In other words, the PDP/ PEP engine decides as to whether a request for resource should be allowed access to the Implicit Trust Zone from where it can access the resource.
The PDP/ PEP gate is more like an airport security checkpoint. The passengers, once they have been through the security check are granted access to boarding gates where they can wait for the entry to the airplane. They are considered worthy of trust once they are through. The boarding area is thus the Implicit Trust Zone in the analogy. In our case, the idea is to explicitly authenticate and authorize all subjects, assets and workflows that make up the enterprise.
Challenges of Implementing the ZTA
For where there are opportunities, there are challenges. The road to ZTA implementation has its fair share of challenges.- There is no single solution encompassing all the tenets of Zero Trust. A one-size-fits-all approach is off the table for obvious reasons. Many different technologies need to be integrated and often, they are of varying maturity.
- Investment in terms of time, resources and technical capabilities. Migration of extant and legacy systems to a Zero Trust environment is not as easy as it sounds.
- And finally, there is no such thing as 100% fool-proof security. The ZTA control plane is still susceptible to compromise.
Overcoming ZTA Implementation Challenges
The challenges need a holistic approach to overcoming them.- Getting hold of visibility: The resources within the enterprise and who needs access to the same and when; these queries should be ascertained at a granular level. This exercise must be inclusive of:
- Identities
- Permissions
- Configurations
- Activities crisscrossing the cloud infrastructure which are about access to networks and resources that are publicly exposed.
- Managing risk: Continuous risk assessment exercise across the cloud IT stack including but not limited to:
- Identity
- Networks
- Compute & storage segments
- Publicly exposed resources if any
- Third-party risks originating from vendors, clients etc.
Beinex and the Zero Trust Architecture
Beinex has solid experience in fostering Zero Trust Architecture capabilities amongst clients. Considering the fact that 90+ entities of Beinex are government clients, our Digital Transformation Team is well positioned to implement the paradigm in multiple domains. Contact us to know more about our offerings.
AWS and GRC Framework: A Comprehensive Approach to Secure and Compliant Data Management
Top Five Benefits of AWS GRC Solutions
Implementing AWS’s GRC solutions offers several advantages that go beyond compliance. Here are the top benefits: • Data-Driven Decision Making: Real-time monitoring and analytics enable organizations to make informed decisions that align with both strategic goals and compliance objectives. • Fostering Responsible Operations: By promoting a culture of governance and ethical practices, AWS helps organizations operate responsibly and build trust. • Advanced Security Measures: Features like encryption, identity management, and continuous threat detection provide robust protection for sensitive data. • Scalability and Flexibility: AWS solutions scale with your business, ensuring that governance and compliance measures grow alongside your operations. • Cost-Effective Operations: AWS’s pay-as-you-go model allows organizations to optimize their IT budgets while maintaining governance and compliance standards.
AWS and GRC Tools
Amazon Web Services (AWS) provides a comprehensive set of GRC tools and practices that can be integrated into the Governance, Risk Management, and Compliance (GRC) framework that empower businesses to effectively manage their data while adhering to industry standards and regulations. Below are some examples of AWS and GRC (Governance, Risk, and Compliance) tools and practices:
Governance: Establishing a Solid Framework
In the AWS ecosystem, governance refers to setting up policies, guidelines, and processes to ensure effective data and resource management. This framework supports business objectives while promoting ethical practices, transparency, and adherence to regulatory requirements. AWS provides several GRC tools and practices that centralize governance and enhance control over accounts, resources, and configurations. • AWS Organizations: This tool helps organizations manage multiple AWS accounts in one place, allowing for the easy implementation and enforcement of policies across the enterprise. Through Service Control Policies (SCPs), organizations can control permissions and ensure only authorized actions occur. • AWS Config: AWS Config is essential for governance as it tracks changes in AWS resource configurations. By providing detailed insights into the state and relationships of these resources over time, AWS Config ensures compliance with internal and external standards. • AWS Service Catalog: The AWS Service Catalog allows organizations to maintain oversight of their IT environment by managing catalogs of approved services. This guarantees that only pre-approved and compliant software, databases, and configurations are deployed. • AWS Control Tower: AWS Control Tower simplifies setting up and managing a secure, multi-account AWS environment. It automates governance best practices and continuously monitors compliance with pre-configured guardrails.
Risk Management: Safeguarding Against Threats
Identifying and managing risks is crucial in today's digital landscape. AWS offers a range of services to help organizations monitor their infrastructure, detect potential vulnerabilities, and respond to security threats swiftly. • AWS CloudTrail: CloudTrail logs and monitors API activity within AWS, allowing organizations to trace user actions and conduct investigations after security incidents. It’s also useful for forensic analysis to determine the cause of issues. • AWS Security Hub: As a centralized security dashboard, AWS Security Hub aggregates findings from multiple AWS services, helping businesses streamline incident response and maintain compliance. • Amazon GuardDuty: GuardDuty is a security service that detects suspicious activities and unauthorized behavior in AWS accounts. By leveraging machine learning and threat intelligence, it helps organizations preemptively address potential risks. • AWS Config Rules: These customizable rules automatically check resource configurations for compliance. If a resource deviates from the expected settings, alerts are triggered, enabling proactive issue resolution.
Compliance: Ensuring Adherence to Regulations
Compliance is vital for any organization handling sensitive data. AWS simplifies the process with a variety of tools to help organizations meet regulatory requirements and reduce audit burdens. • AWS Artifact: AWS Artifact offers on-demand access to important compliance documents, such as SOC reports and certifications like ISO and PCI DSS. This is especially helpful during audits, providing immediate access to evidence of AWS's adherence to standards. • AWS Shield & AWS Web Application Firewall (WAF): These services protect against DDoS attacks and unauthorized access attempts, ensuring web application availability and data integrity. Shield and WAF work together to filter out malicious traffic and ensure the security of incoming requests. • AWS Key Management Service (KMS) & AWS Certificate Manager (ACM): Data encryption is critical for compliance, and AWS KMS helps manage encryption keys securely. ACM automates the deployment of SSL/TLS certificates, protecting data both in transit and at rest. • AWS Audit Manager: AWS Audit Manager automates evidence collection for audits, continuously assessing your environment against industry standards. This reduces manual effort and ensures that organizations remain consistently compliant. AWS’s robust GRC framework empowers organizations to effectively manage data, mitigate risks, and ensure regulatory compliance. Leveraging AWS’s advanced tools not only supports meeting industry standards but also fosters innovation, resilience, and future-readiness within businesses.
Beinex: AWS Partner for the Middle East
Beinex is an AWS consulting partner, and we empower customers with AWS managed services to host their BI solutions and much more on the cloud. Our cloud migration experts bring in best-in-class stability and reliability by understanding your business strategy and working closely with you to deploy AWS infrastructure as a service. Connect with Us for a Free Demo Interested in our services? Try AWS for free: https://beinex.com/beinex-amazon-web-services/

AWS Systems Manager: Proven Best Use Cases and a Real-World Success Story
AWS Systems Manager seamlessly operates with both Windows and Linux OS and integrates with CloudWatch metrics, CloudWatch Dashboard, and AWS Config. Moreover, it enables the creation of resource groups spanning various AWS services, allowing for aggregated operational data viewing and facilitating monitoring, troubleshooting, and resource group-specific actions.
Common use cases and best practices for AWS Systems Manager capabilities are listed below:
Automation
Inventory
Maintenance Windows
Parameter Store
Patch Manager
Run Command
Session Manager
State Manager
Managed Nodes
Case Study: A Global Cloud Solutions and Services Company Enhances Scalability and Efficiency with AWS Systems Manager
Client: A Global Cloud Solutions and Services Company
A technology services company that specialises in helping organisations across 120 countries adopt modern technologies and manage them efficiently. They focus on creating solutions for hybrid and multi-cloud environments.
Requirement: Finding Scalability on AWS Systems Manager
The client faced a significant challenge in managing multi-cloud environments at scale reliably and cost-effectively. Manually handling activities across hundreds of thousands of different compute instances was resource-intensive and delayed issue resolution. They needed a solution that could run both on-premises and on the cloud and wanted a single tool for managing their suite of solutions.>
Challenges
Process: Supporting Automation, Staff Productivity, and Transparency on AWS
The client began using AWS Systems Manager in 2015 for various products and extended its use to other cloud environments in 2019. Since 2019, the client has utilised AWS Systems Manager to power patching activities across all major cloud providers they support. They perform mass patching at scale, covering over 62,000 VMs across all their managed services. VM Management automates traditionally manual tasks like patching, agent distribution, server diagnostics, and issue remediation. It significantly reduces labour, costs, and errors associated with manual tasks, enhancing security and efficiency.
SmartTickets, a component in VM Management, handled thousands of incidents and automated responses using AWS Systems Manager, saving time and reducing costs for the company. They also used Amazon CloudWatch for monitoring and observability and automated runbooks for real-time monitoring and alerts.
AWS Systems Manager provides a single-pane view of environments, improving customer visibility and decision-making.
Result: Taking Automation to the Next Level on AWS
The client plans to develop custom runbooks with customers and further automate responses and resolutions using AWS Systems Manager. They have successfully solved industry challenges by saving time, cutting costs, and reducing complexity for both their customers and themselves.
Key Takeaway
The client leveraged AWS Systems Manager to streamline and automate their operations, resulting in improved efficiency, cost reduction, and enhanced customer satisfaction. With automation, they can swiftly respond to and resolve issues, meeting customer expectations effectively.
How Beinex Can Help You
Beinex is an AWS consulting partner, and we empower customers to host their BI solutions and much more on the cloud. Our cloud migration experts bring in best-in-class stability and reliability by understanding your business strategy and working closely with you to deploy AWS infrastructure as a service.