How AI Decision-Making is Improving Enterprise Outcomes
Blog
Share 
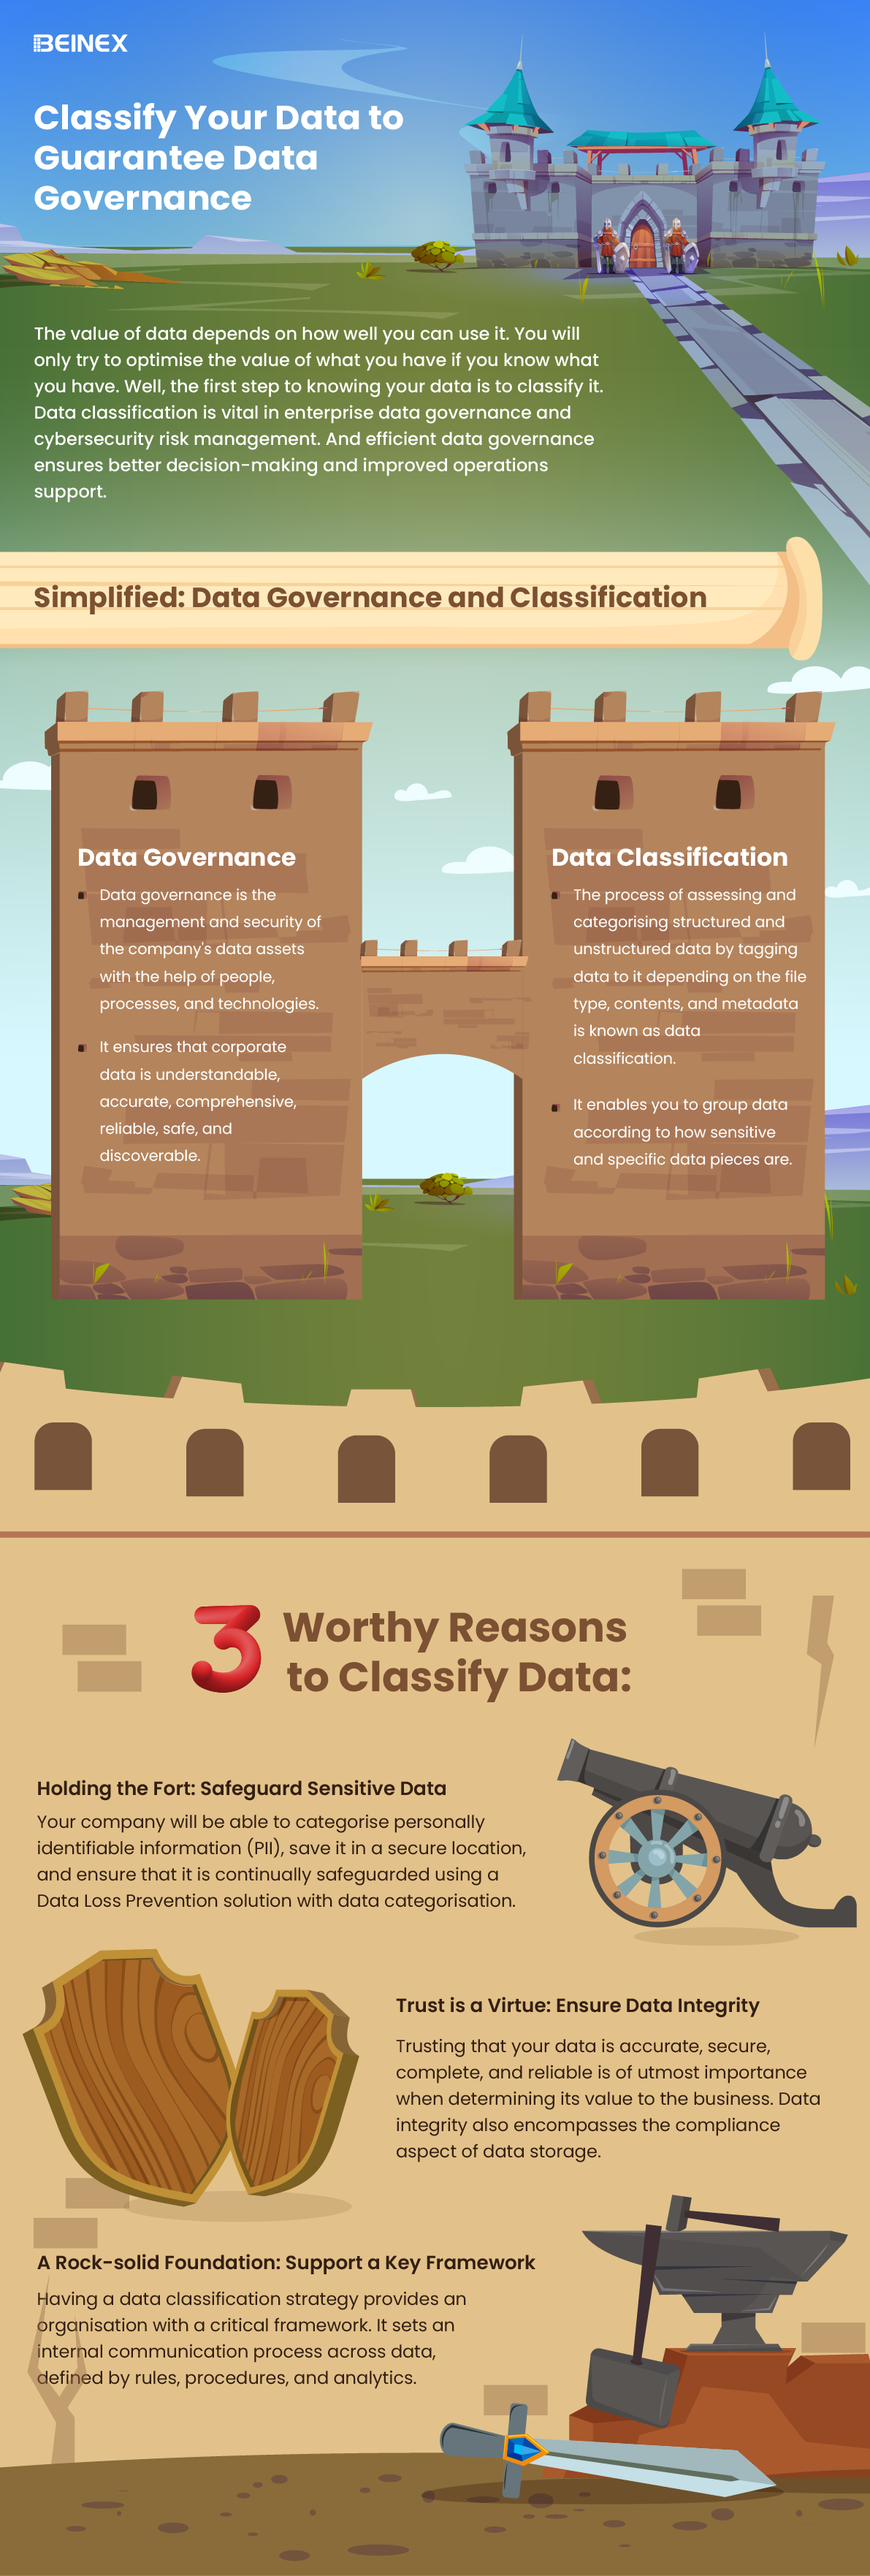
Classify your Data to Guarantee Data Governance(Infographics)
-
Related Articles
Let the force be with you: Data residency and Hyperforce
After two very long masked years, the world has slowly started to breathe, again!
With lockdowns on and work taking place from the very room you had slept a couple of hours back -- the human universe has been phenomenally re-engineered by a microscopic organism.
Your geographical location has been made immaterial in the digital world. But the same cannot be said about data, and this may sound paradoxical and ironic. For instance, an MNC’s location of the data now matters more than ever before. With a major chunk of data of many entities, especially government ones, on the public cloud, the airing of concerns related to data security, data sovereignty, data localisation/ data residency is growing louder in decibel terms.
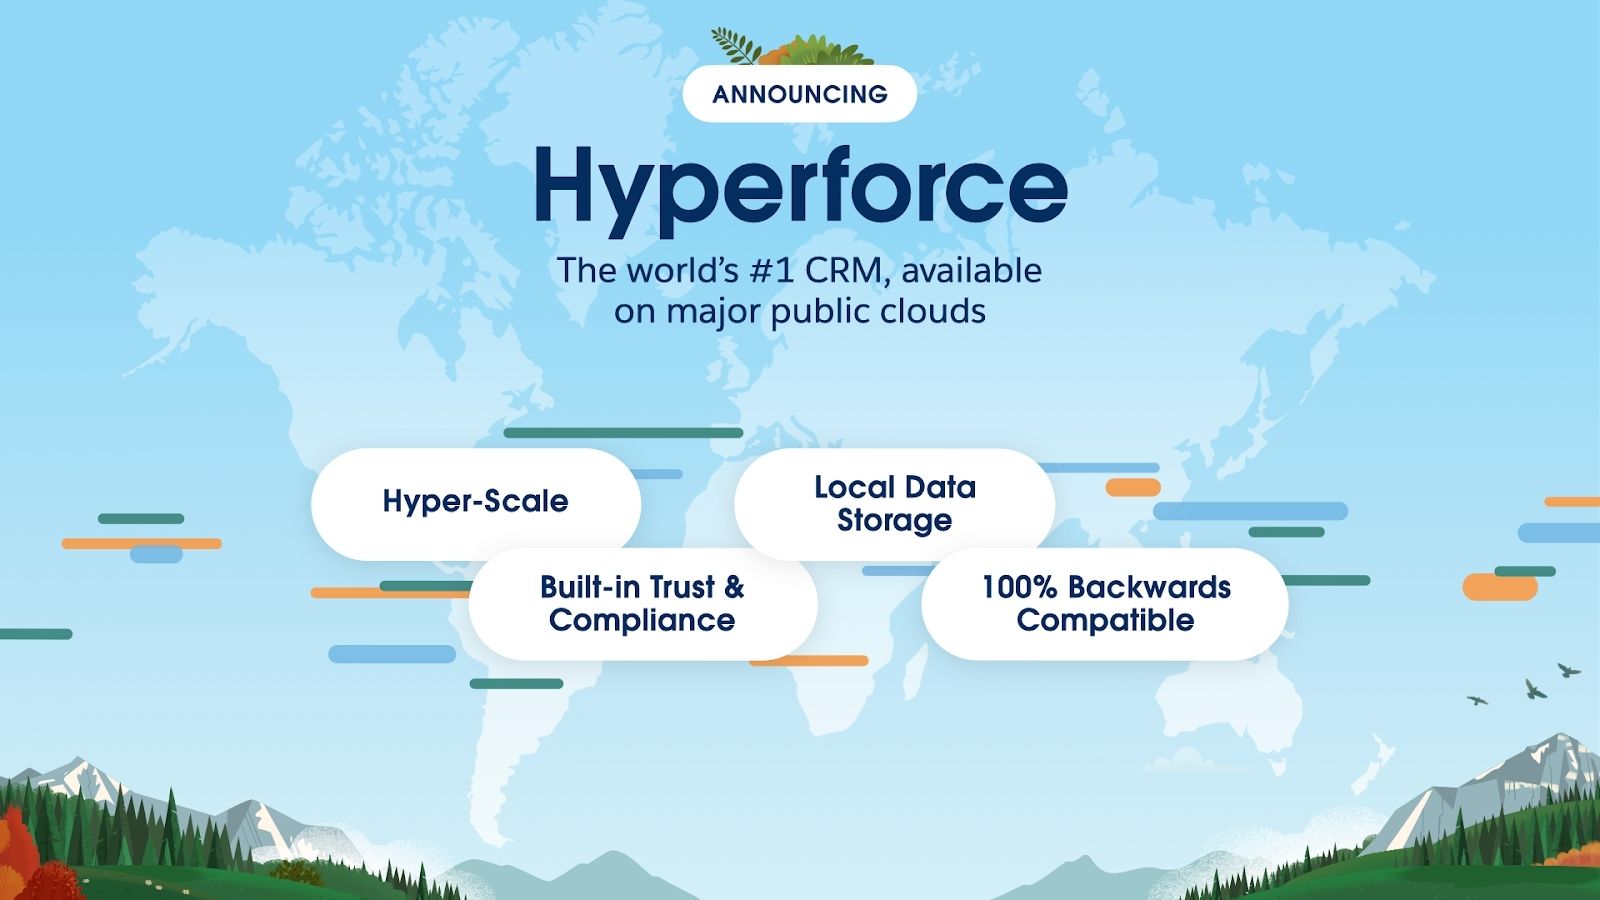
This is where Hyperforce comes in.
Hyperforce is how Salesforce has reimagined its platform. It is now horizontally scalable, and through tie-ups with major cloud providers, the scalability has grown by leaps and bounds. Imagine you are a B2B company with 10,000 customers or a B2C company with tens of millions of customers: Hyperforce lets you scale up your capabilities and provides you with a single source of truth. But what if you are a multi-geographic business conglomerate in a heavily regulated industry like finance or health? How will you comply with data sovereignty, data localisation/ data residency requirements? Hyperforce’s collaboration with public cloud companies ensures that the data can be located at any specified place in the world, adhering to the local rules of data governance and storage locations. “Choose the location where your data will be stored to comply with regulations specific to your company, region, or industry — even in highly regulated industries like the public sector,” the store-data-locally-keep-it-compliant-globally mantra tells. Other features Hyperscalable: Hyperforce also enables you to scale the infrastructure as per the needs of the business by letting you access extra computing capacity as and when required. You can employ resources in the public cloud rather quickly. Yes, it is your decision whether to scale up or not, and the elasticity can be dictated by the nature of your requirements. Hypersecure: Also, trust is built-in, which puts security at the forefront of the architecture. Data privacy and security are sacrosanct. This leaves you with enough room to focus on innovation. Hypercompatible: And most important of all, backward compatibility ensures that all the extant Salesforce apps, customisations and integrations will continue to work on Hyperforce regardless of cloud. In the physical world, your geographical location assumes importance. But in the digital world, it is the location of the data that matters. Hyperforce, by virtue of its collaboration with major players in the cloud domain, ensures data residency requirements are adhered to when and where needed. The architecture is hyper-scalable, secure, and comes with backward compatibility. Hyperforce is soon to be launched in the UAE, and Beinex, a Salesforce partner, is all set to carry out implementation and consulting of and for Hyperforce.
Data Blending for Spatial Analytics in Just 6 Steps Using Alteryx
What is Spatial Analysis?
Spatial analysis is the art and science of extracting insights from data that has a geographic component. Think of it as giving your data a physical address! Traditionally, this involved complex Geographic Information Systems (GIS) software. But today, spatial analysis is more accessible than ever, thanks to data science and machine learning.
Pinpointing locations on a map is just the first step. Spatial analytics goes far beyond that, offering a powerful lens to understand how relative location impacts your business. It allows you to see the bigger picture: how customers, stores, services, and other factors interact with each other geographically.
This magic happens by blending spatial data (think zip codes, store addresses) with your existing data sets (sales figures, customer demographics). By analyzing these combined datasets, you gain a wealth of insights that can transform your decision-making process.
What Spatial Analytics Can Do for You
Here's how spatial analytics can help you understand and optimize key areas:
- • Customer Behavior and Inventory: Analyze nearby consumer buying habits for specific products and services. This allows you to customize inventory and service experiences at each location based on local demand.
- • Strategic Location Planning: Optimize your location strategyby determining how the proximity of competitors or existing locations impacts new site expansion. You can also understand how far customers are typically willing to travel for your product or service.
- • Improved Customer Experiences: Ensure service availabilityand minimize service gaps by strategically locating key hubs within an appropriate distance from each other. This translates to a smoother and more efficient experience for your customers.
- • Targeted Marketing: Drive efficiencies in your marketing programs by customizing your offerings to match demographic purchasing preferences in specific locations. This targeted approach allows you to reach the right audience with the right message.
- • Import and Unify: Easily bring in various datasets, regardless of format.
- • Effortless Geocoding: Transform addresses and other location data into usable geographic coordinates with a few clicks.
- • Spatial Blending: Combine your location data seamlessly with traditional datasets for a holistic view.
- • Advanced Analytics Made Simple: Perform complex spatial analyses without needing specialized coding skills.
- • Data Enrichment: Boost your insights by adding demographic, firmographic, or industry-specific data to your spatial datasets.
- • Visualize and Explore: Discover hidden patterns and relationships through interactive maps and visualizations.
- • Gather Data: Gather all the data sets you need for your analysis, from customer information to market demographics.
- • Translate Your Addresses: Use Alteryx's geocoding tools to transform addresses and other location data into usable geographic coordinates.
- • Define Your Trade Zone: Create a virtual boundary to analyze specific locations based on radius
- • Blend Datasets Together: Seamlessly combine your spatial data with traditional datasets to create a comprehensive picture of customer-location relationships.
- • Use Advanced Spatial Analytics for Additional Insights: Perform complex spatial analyses within Alteryx's user-friendly interface, unlocking hidden insights without needing specialized coding skills.
- • Visualize and Share Your Findings: Prepare your data for reports and interactive visualizations that effectively communicate your insights. Alternatively, export the data for further analysis or integration with downstream processes.
How Alteryx Enables Data Blending for Spatial Analytics
Forget complex GIS! Alteryx's no-code tools make spatial analysis a breeze, unlocking location intelligence for all data users. Optimize resources, plan assets, manage logistics, and more - all in a user-friendly platform.
Alteryx offers an intuitive workflow that streamlines the entire process:
A 6-Step Recipe for Blending Spatial Data in Alteryx
Alteryx makes blending spatial data with your existing information a breeze. Here's a step-by-step guide to get you started:
Find a detailed 6-step guide for blending spatial data using Alteryx:
1. Gather Data
Alteryx's Input tool lets you grab data from anywhere – spreadsheets, databases, even social media! Just connect to your desired sources, and Alteryx will get your data ready for spatial exploration.

2. Turn Addresses into Locations:
The Street Geocode tool in Alteryx quickly transforms your standard addresses (like customer locations or branch sites) into geographic coordinates (latitude and longitude). This "spatializes" your data, adding a new data point for each location.
In this example, we'll use it to geocode both customer and site data.
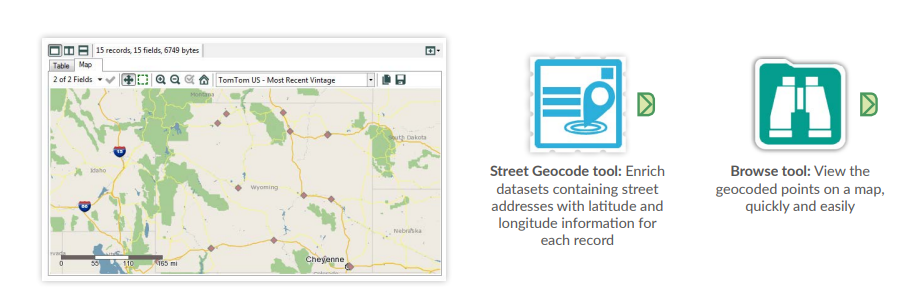
3. Define Your Trade Zone:
The Trade Area tool lets you see what's happening within a specific area around each location. For example, you can create a 10-minute drive time polygon. This "draws" a zone around each location, encompassing all areas reachable within a 10-minute drive using the road network.

4. Blend Datasets Together:
The Spatial Match tool lets you see how different sets of locations relate to each other. For instance, you can use it to find out how many customers live within (or outside) the 10-minute drive time zone you created for each location. It essentially compares your customer data points (spatial points) with the trade area polygons (spatial objects) to identify matches based on spatial relationships (like "contains" or "intersects").

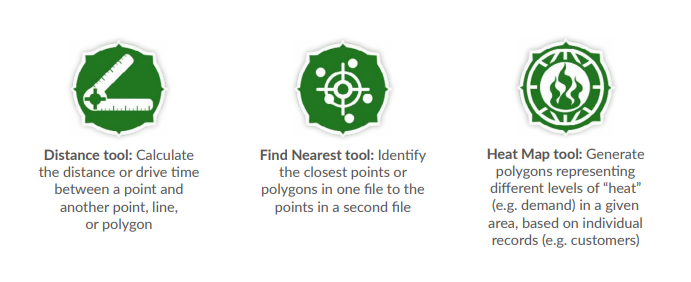
5. Use Advanced Spatial Analytics for Additional Insights
Alteryx offers a range of additional tools for advanced spatial analysis, making it accessible to users beyond data specialists. Additional tools include:
6. Visualise and Share Your Findings:
Alteryx doesn't just help you crunch data - it enables you to share your insights clearly.
Visualize Your Success: Overlay data on detailed maps or satellite imagery using advanced mapping tools.
Spread the Knowledge: Export your analysis in various formats like Excel, ESRI, or even Tableau and Qlik for seamless integration with other data workflows and presentations.
Beinex + Alteryx Offerings
As a Premier Alteryx partner, we have extensive experience and a proven track record of success. Our team is highly skilled in Alteryx solutions and can help you unlock the full potential of this powerful platform.
Contact us today to learn more about how Alteryx and our partnership can take your business to the next level.
Image Source: https://community.alteryx.com/pvsmt99345/attachments/pvsmt99345/general-discussions/2303/2/Spatial_Cookbook_Victa.pdf
Top Picks: Tableau 2020.4
As a frequent user of Tableau Desktop and Server, check out my top picks from the list.
• Improved dynamic parameter
• Multiple marks layer support for maps
• Block comments in calculations
• Web authoring enhancements
• Offline map support for Tableau Server
• Tableau Server Management (TSM) improvements
• Multiple key activation on Tableau Server prior to TSM initialization
• Analytics Extension for Tableau Online
• Merge duplicate external assets
• Tableau Prep Builder in the browser
Tableau Desktop
Improved Dynamic Parameter
The dynamic parameter was one of the features which I used extensively starting from 2020.1. The feature allows us to populate parameter values based on a specified field whenever the workbook is opened. We will be able to select only the field with matching data types.
The feature update announced in Tableau 2020.4 gives me more privilege to customize the Dynamic Parameter. I can now set a parameter’s range to a field’s min and max value upon opening the workbook, or when the field’s data source is refreshed.
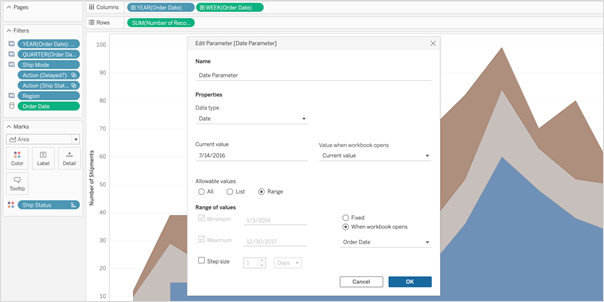 So, whenever I open the workbook or the extract is refreshed, Tableau displays the unique values within the range specified, giving more control over the parameter values displayed.
Multiple Marks Layer Support for Maps
This is an exceptional feature to bring multiple spatial layers and context together to better understand and analyze geospatial data and map views. I will be able to include multiple marks layers from a data source to map visualizations and enhance the geospatial analysis. I can present more context in a single map view and perform further analysis with this feature.
So, whenever I open the workbook or the extract is refreshed, Tableau displays the unique values within the range specified, giving more control over the parameter values displayed.
Multiple Marks Layer Support for Maps
This is an exceptional feature to bring multiple spatial layers and context together to better understand and analyze geospatial data and map views. I will be able to include multiple marks layers from a data source to map visualizations and enhance the geospatial analysis. I can present more context in a single map view and perform further analysis with this feature.
 Block Comments in Calculations
Block comments is a simple yet one of the most useful features for me, which Tableau has announced in 2020.4. I often used to add comments in complex calculations for easy understanding in future references. Earlier, only single-line comments were possible, limiting the description I could add. But from now on, I can add comments of any length to calculation windows with block comments by simply starting the comment with /* and ending with */.
What makes it unique is that the new multi-line block comment feature is consistent with other popular programming languages. This feature is an example of Tableau’s on-going effort to provide its customers with an intuitive user experience.
Block Comments in Calculations
Block comments is a simple yet one of the most useful features for me, which Tableau has announced in 2020.4. I often used to add comments in complex calculations for easy understanding in future references. Earlier, only single-line comments were possible, limiting the description I could add. But from now on, I can add comments of any length to calculation windows with block comments by simply starting the comment with /* and ending with */.
What makes it unique is that the new multi-line block comment feature is consistent with other popular programming languages. This feature is an example of Tableau’s on-going effort to provide its customers with an intuitive user experience.
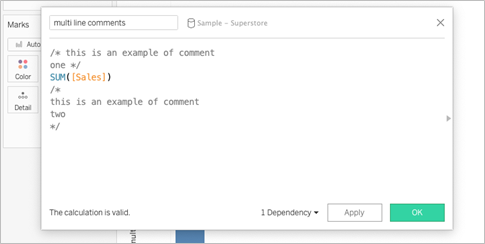 Tableau Server
Web Authoring Enhancements
Starting from Tableau 2020.4, it is possible to author dashboards from the browser just like how we design it in Tableau Desktop. With this web authoring enhancements, I can include Highlight actions, Format Mark Labels, apply filters to worksheets, create fixed sets, and even create extract in my workbooks from the browser itself. I no longer have to make changes from Tableau Desktop and publish it to the server. I can directly do it from the browser itself.
Tableau Server
Web Authoring Enhancements
Starting from Tableau 2020.4, it is possible to author dashboards from the browser just like how we design it in Tableau Desktop. With this web authoring enhancements, I can include Highlight actions, Format Mark Labels, apply filters to worksheets, create fixed sets, and even create extract in my workbooks from the browser itself. I no longer have to make changes from Tableau Desktop and publish it to the server. I can directly do it from the browser itself.
 Offline Map Support for Tableau Server
Rendering dashboards with maps is now faster compared to previous versions. Now, I can create maps using the offline map style in web authoring, ensuring the performance of map views in Tableau Server. Offline map support is a great deal for organizations with strict internet access restrictions, assuring that map view access to all its users.
Tableau Server Management (TSM) Improvements
Tableau Server Administration activities like installation, upgrade and backup are now easy like never before. I can retry installation or upgrade from the last checkpoint in case of an unexpected issue or error during installation or upgrade, saving my efforts to obliterate tableau server.
Backups can be performed twice as fast as previous versions, and I can monitor the progress with the new progress bar giving visibility into what step the backup is on and how much time is remaining.
Backups can also be scheduled using TSM command starting from 2020.4 and that is awesome. I no longer need to prepare batch script and depend on the windows task scheduler to schedule the backups on regular intervals; instead, I can schedule it with just a single command.
Multiple Key Activation on Tableau Server Prior to TSM Initialization
During Tableau Server installation, it is now possible to activate multiple license keys prior to TSM initialization. I will be able to save a lot of time by eliminating the need to restart after the installation is completed to activate multiple licenses and experience a smoother installation.
Analytics Extension for Tableau Online
The power of the Analytics extension is now unlocked in Tableau Online too. The feature was already available in Tableau Server, and it helped us dynamically perform advanced analysis with models and functions in R, Python and other platforms.
Analytics extension in Tableau Online significantly enhances the scope of using Advanced Analytics by the common users.
Merge Duplicate External Assets
Earlier, the Database or Table with similar names used to appear as multiple assets within Tableau Catalog. But, the new feature helps me to merge those multiple assets into a single one. I can manage assets easily and keep an organized view of External assets by merging the common ones.
Offline Map Support for Tableau Server
Rendering dashboards with maps is now faster compared to previous versions. Now, I can create maps using the offline map style in web authoring, ensuring the performance of map views in Tableau Server. Offline map support is a great deal for organizations with strict internet access restrictions, assuring that map view access to all its users.
Tableau Server Management (TSM) Improvements
Tableau Server Administration activities like installation, upgrade and backup are now easy like never before. I can retry installation or upgrade from the last checkpoint in case of an unexpected issue or error during installation or upgrade, saving my efforts to obliterate tableau server.
Backups can be performed twice as fast as previous versions, and I can monitor the progress with the new progress bar giving visibility into what step the backup is on and how much time is remaining.
Backups can also be scheduled using TSM command starting from 2020.4 and that is awesome. I no longer need to prepare batch script and depend on the windows task scheduler to schedule the backups on regular intervals; instead, I can schedule it with just a single command.
Multiple Key Activation on Tableau Server Prior to TSM Initialization
During Tableau Server installation, it is now possible to activate multiple license keys prior to TSM initialization. I will be able to save a lot of time by eliminating the need to restart after the installation is completed to activate multiple licenses and experience a smoother installation.
Analytics Extension for Tableau Online
The power of the Analytics extension is now unlocked in Tableau Online too. The feature was already available in Tableau Server, and it helped us dynamically perform advanced analysis with models and functions in R, Python and other platforms.
Analytics extension in Tableau Online significantly enhances the scope of using Advanced Analytics by the common users.
Merge Duplicate External Assets
Earlier, the Database or Table with similar names used to appear as multiple assets within Tableau Catalog. But, the new feature helps me to merge those multiple assets into a single one. I can manage assets easily and keep an organized view of External assets by merging the common ones.
 Tableau Prep
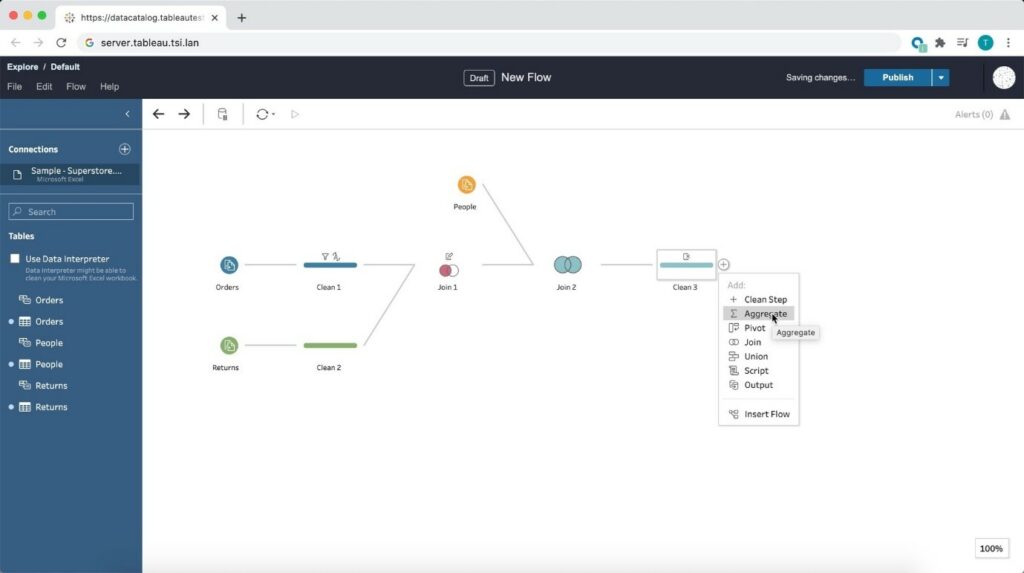
 Builder in the Browser
Prepare the data for visualizations from anywhere using a browser! Starting from 2020.4, Tableau is bringing the data prep process into one integrated platform on the web. Now I can easily prepare and manage prep flows from anywhere using a browser.
Tableau Prep
Tableau Prep Builder in the Browser
Prepare the data for visualizations from anywhere using a browser! Starting from 2020.4, Tableau is bringing the data prep process into one integrated platform on the web. Now I can easily prepare and manage prep flows from anywhere using a browser.
 Conclusion
Tableau is progressively evolving as a single platform for data preparations, visualization, and collaboration with every update and version release.
Author : Firdous Maqbool
Images Courtesy : Tableau
Conclusion
Tableau is progressively evolving as a single platform for data preparations, visualization, and collaboration with every update and version release.
Author : Firdous Maqbool
Images Courtesy : Tableau
So, whenever I open the workbook or the extract is refreshed, Tableau displays the unique values within the range specified, giving more control over the parameter values displayed.
Multiple Marks Layer Support for Maps
This is an exceptional feature to bring multiple spatial layers and context together to better understand and analyze geospatial data and map views. I will be able to include multiple marks layers from a data source to map visualizations and enhance the geospatial analysis. I can present more context in a single map view and perform further analysis with this feature.
Block Comments in Calculations
Block comments is a simple yet one of the most useful features for me, which Tableau has announced in 2020.4. I often used to add comments in complex calculations for easy understanding in future references. Earlier, only single-line comments were possible, limiting the description I could add. But from now on, I can add comments of any length to calculation windows with block comments by simply starting the comment with /* and ending with */.
What makes it unique is that the new multi-line block comment feature is consistent with other popular programming languages. This feature is an example of Tableau’s on-going effort to provide its customers with an intuitive user experience.
Tableau Server
Web Authoring Enhancements
Starting from Tableau 2020.4, it is possible to author dashboards from the browser just like how we design it in Tableau Desktop. With this web authoring enhancements, I can include Highlight actions, Format Mark Labels, apply filters to worksheets, create fixed sets, and even create extract in my workbooks from the browser itself. I no longer have to make changes from Tableau Desktop and publish it to the server. I can directly do it from the browser itself.
Offline Map Support for Tableau Server
Rendering dashboards with maps is now faster compared to previous versions. Now, I can create maps using the offline map style in web authoring, ensuring the performance of map views in Tableau Server. Offline map support is a great deal for organizations with strict internet access restrictions, assuring that map view access to all its users.
Tableau Server Management (TSM) Improvements
Tableau Server Administration activities like installation, upgrade and backup are now easy like never before. I can retry installation or upgrade from the last checkpoint in case of an unexpected issue or error during installation or upgrade, saving my efforts to obliterate tableau server.
Backups can be performed twice as fast as previous versions, and I can monitor the progress with the new progress bar giving visibility into what step the backup is on and how much time is remaining.
Backups can also be scheduled using TSM command starting from 2020.4 and that is awesome. I no longer need to prepare batch script and depend on the windows task scheduler to schedule the backups on regular intervals; instead, I can schedule it with just a single command.
Multiple Key Activation on Tableau Server Prior to TSM Initialization
During Tableau Server installation, it is now possible to activate multiple license keys prior to TSM initialization. I will be able to save a lot of time by eliminating the need to restart after the installation is completed to activate multiple licenses and experience a smoother installation.
Analytics Extension for Tableau Online
The power of the Analytics extension is now unlocked in Tableau Online too. The feature was already available in Tableau Server, and it helped us dynamically perform advanced analysis with models and functions in R, Python and other platforms.
Analytics extension in Tableau Online significantly enhances the scope of using Advanced Analytics by the common users.
Merge Duplicate External Assets
Earlier, the Database or Table with similar names used to appear as multiple assets within Tableau Catalog. But, the new feature helps me to merge those multiple assets into a single one. I can manage assets easily and keep an organized view of External assets by merging the common ones.
Tableau Prep
Tableau Prep Builder in the Browser
Prepare the data for visualizations from anywhere using a browser! Starting from 2020.4, Tableau is bringing the data prep process into one integrated platform on the web. Now I can easily prepare and manage prep flows from anywhere using a browser.
Conclusion
Tableau is progressively evolving as a single platform for data preparations, visualization, and collaboration with every update and version release.
Author : Firdous Maqbool
Images Courtesy : Tableau
What’s New in Tableau's 2024.1 Release: Tableau Pulse, Metrics Layer, Viz Navigation, and More
Tableau's 2024.1 Release: What’s in it for you
Do your employees struggle to understand complex data visualizations? Does your organization lack a consistent approach to defining metrics? Are you looking for ways to make data more accessible for everyone? If you answered yes to any of these questions, then the new features in Tableau 2024.1 are for you! This release addresses these common challenges head-on, offering solutions like Viz Navigation for Text Tables, the Metrics Layer in Tableau Pulse, and more. Keep reading to learn more about these innovations and how they can revolutionize your data analysis workflows:
1. Tableau Pulse: Personalized Insights Delivered
Tableau Pulse is a real lifesaver, transforming how your organization interacts with data. Here's how it empowers your workforce:
To learn more about Tableau Pulse, click here: https://beinex.com/topics/tableau-ai-and-tableau-pulse-tableaus-dynamic-duo/
2. The Metrics Layer: Building a Unified Language for Data
Achieving consistency and clarity in data analysis is key to making informed decisions. The Metrics Layer within Tableau Pulse tackles this challenge by providing a central hub for defining and managing metrics.
Here's how it works:
By creating a unified language for data, the Metrics Layer empowers collaboration and drives data-driven decision making throughout your organization.
3. Tableau Pulse on Mobile: Stay on Top of Your Data Anywhere
Monitor key metrics and gain actionable insights, even when you're on the go. Tableau Pulse seamlessly integrates with Tableau Mobile, allowing you to access your personalized AI-powered insights directly from your smartphone or tablet.
Get a quick snapshot of your metrics:
Dive deeper for a comprehensive analysis:
This one-click access empowers everyone in your organization to make data-driven decisions, regardless of location. Tableau Pulse is available on both iOS and Android versions of Tableau Mobile.
4. Tableau Available Through AWS Marketplace: Streamlined Procurement and Deployment
For organizations leveraging the power of AWS cloud infrastructure, Tableau Cloud is now available on the AWS Marketplace. This integration offers several benefits:
5. Viz Navigation for Text Tables: Enhanced Accessibility
Tableau 2024.1 introduces a groundbreaking feature for exploring data visualizations: Viz Navigation for Text Tables. This innovative capability empowers users to navigate and interact with text tables using their keyboard or assistive technologies, removing the need for a mouse.
Benefits for all users:
This new feature signifies Tableau's commitment to making data accessible to everyone, regardless of their ability or preferred method of interaction.
6. Tableau Prep: Identify Duplicate Rows
Tableau Prep enables you to take control of your data quality. By removing or correcting duplicates, you can build trust in your data and generate reliable insights that drive better business decisions.
Effortlessly Spot Duplicates:- Remove identified duplicates to ensure a clean and accurate dataset.
- Fix the underlying issues causing the duplication, preserving valuable data points.
A New Era of Data-Driven Decision Making
With Tableau 2024.1 and Tableau Pulse, you have everything you need to democratize data across your organization. Empower your employees to leverage insights and make data-driven decisions that drive real business impact.
How Beinex Can Assist You
Beinex, a premier Tableau partner, provides sustainable analytics solutions to organizations and help to build superior data visual analytics capabilities internally through our bespoke training programs. Our team of Tableau-certified consultants are real-life Tableau business users who are passionate about Tableau and delivering a world-class experience. Connect with us for a Tableau free trial.

The Future of Business Intelligence: AI-Augmented Analytics
The Struggles of Traditional Business Intelligence
Traditional BI platforms, while valuable, suffer from several limitations:
These limitations force businesses to make a tough choice: sacrifice the quality of insights by limiting analysis or invest significant time and resources into data preparation and model building.
The Rise of Augmented Analytics
Augmented analytics emerges as a powerful solution, addressing the shortcomings of traditional BI. It leverages the power of Artificial Intelligence (AI), Machine Learning (ML), and Natural Language Processing (NLP) to revolutionize data analysis:
How Does Augmented Analytics Work?
Augmented analytics enhances the four core stages of data analysis:
- Data Preparation: Traditionally, data preparation involves manual tasks like data cleaning and integration. Augmented analytics automates these processes, allowing data scientists to focus on more strategic tasks.
- Insight Discovery: Traditional BI requires pre-defined models to uncover insights. Augmented analytics utilizes ML algorithms to analyze all available data, regardless of size or complexity, to deliver targeted and nuanced insights in response to user queries.
- Insights Sharing: Sharing insights often involves generating reports and charts, a time-consuming task. Augmented analytics utilizes Natural Language Generation (NLG) to present insights in real time through online dashboards. These dashboards explain the "why" behind the data, giving decision-makers the context they need.
The Benefits of Augmented Analytics
By implementing augmented analytics, businesses can unlock a multitude of benefits:
Augmented Analytics Use Cases
Let's explore how augmented analytics is transforming various industries:
- Pharmaceutical Companies: Analyze vast datasets to optimize go-to-market strategies and uncover hidden patterns in market share data.
- Financial Lenders: Assess credit risk with greater accuracy by analyzing all relevant data points in real-time, leading to faster loan approvals and better risk management.
- Consumer Goods Companies: Gain real-time insights into product sales, customer churn, and satisfaction, allowing for proactive customer engagement strategies.