How AI Decision-Making is Improving Enterprise Outcomes
Blog
Share 
Budgeting Made Easy: Beinex Budget Allocation Accelerator (Infographic)
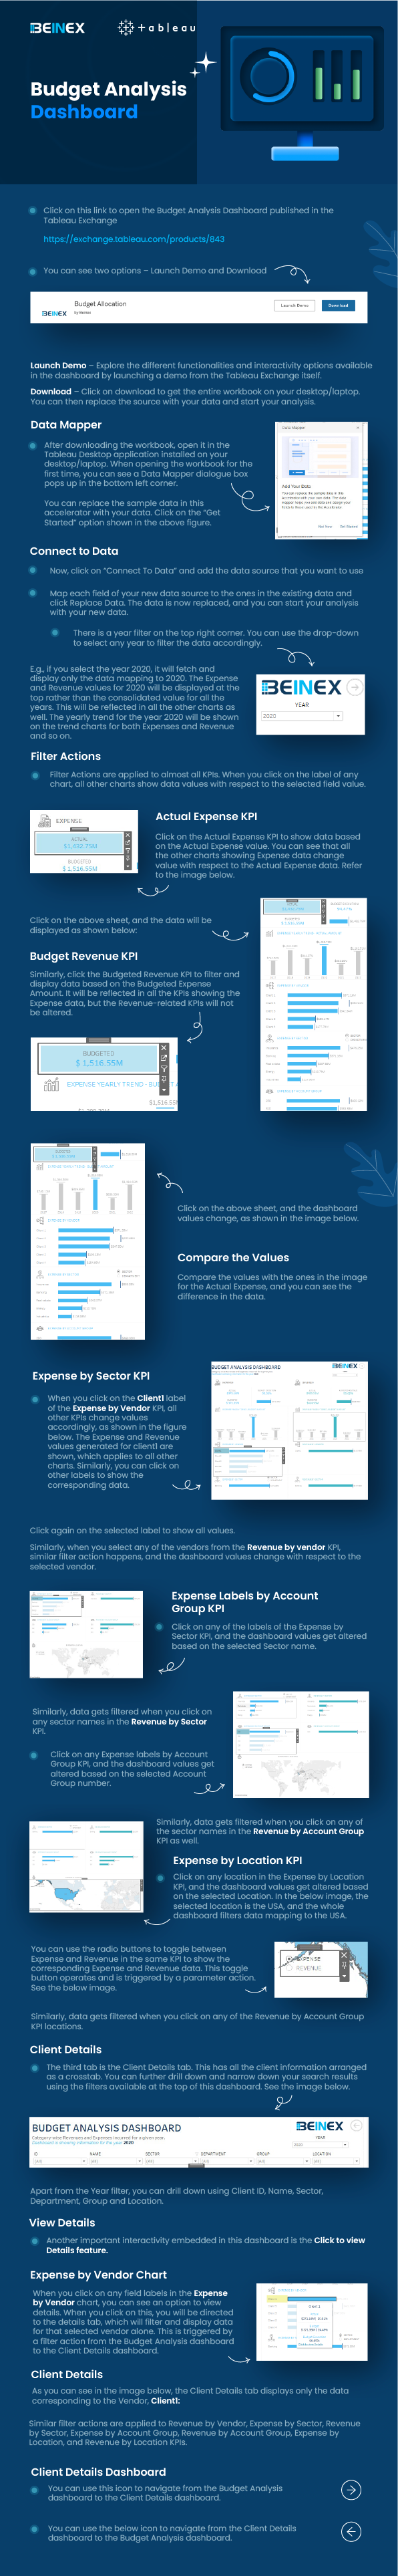
Gone are the days of manual and time-consuming budgeting tasks. With our cutting-edge accelerator, you can unlock the power of data-driven insights and make informed decisions that drive growth and profitability. Say goodbye to guesswork and hello to precision, as our Budget Allocation Accelerator empowers you to allocate resources effectively and maximise ROIs.
Related Articles
SELF SERVICE AUDIT ANALYTICS
TRANSFORM THE WAY YOU AND YOUR ORGANIZATION WORK WITH DATA –SELF SERVICE AUDIT ANALYTICS
Increasing complexities of risks and incessant emergence of disruptive technologies are demanding substantial change in internal audit processes. In today’s world of constant disruption, internal audit should evolve into a dynamic and future-oriented function. Businesses need broad-spectrum audit processes that extend beyond reviewing the obvious. Auditors should adopt forward-looking IA approaches, and should be able to provide deeper and valuable insights on strategy, execution, emerging risks, and hidden opportunities.
The 2016 Deloitte Global Chief Audit Executive Survey that polled more than 1200 CAEs from 29 countries and a diverse range of industries, reaffirms the growing need to conduct analytics-based auditing. More than a three quarter of the CAEs (79%) recommend the need for digital disruption and innovation to transform internal audit and enhance its value. The survey also cited the increasing relevance of cutting-edge technologies such as artificial intelligence, cognitive computing, and visual analytics.
Is skill-gap a concern?
More than half of CAEs (57%) who participated in the survey expressed their intense dissatisfaction about inadequate skills and insufficient expertise of audit teams.
When left unaddressed, these skill gaps will weaken auditors’ capabilities to deliver on changing stakeholder expectations. Stakeholders expect more forward-looking analysis to uncover risks and hidden opportunities. Or, gone are the days of static audit reports and analysis of sample data.
The Deloitte survey also cites risk anticipation (39%) and data analytics (34%) as the two groundbreaking innovations that are most likely to impact internal audit within the next five years. Changing business landscapes, technological advancements, and proliferation of data have brought forth the imminent need to leverage analytics and data visualization to increase the impact, influence, and effectiveness of internal
audit
Analytics Adoption Challenges
Even after 30 years of inception of data analytics, many auditors continue to adopt conventional internal audit methods and lag in technology adoption. Wondering why? Here are some of the reasons:
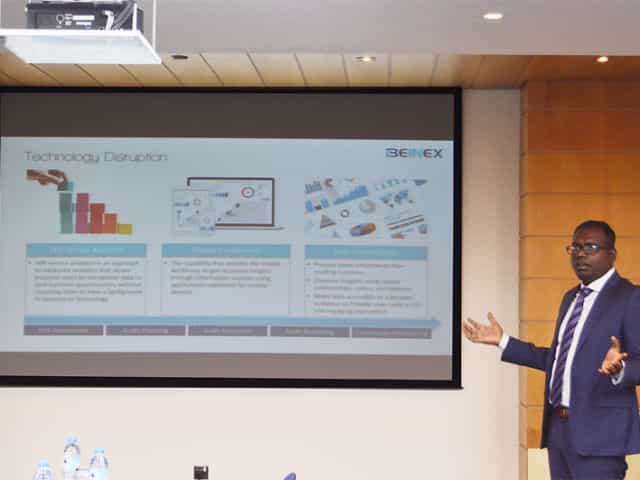
Can technology disruption be a savior?
Advancements in technology are fundamentally changing the nature of the audit and improving its effectiveness and relevance. Here are a few game-changing technology solutions that auditors can harness effectively to enhance the way they work with data:
1.Self-service analytics – Smart analytics for all
Self-service analytics is no more a buzzword. It’s the new norm. Self-service analytics empowers auditors to access data, perform queries, and create interactive reports that add richness and granularity to the insights derived. Anyone and everyone, with or without technical expertise, can harness the power of self-service analytics to work seamlessly with large data sets of any size or type, and discover savvy insights without having to write codes or learn programming languages.
Key advantages of using self-service analytics tools: Explore your data and create ad-hoc reports without IT skills
2.Mobile Analytics – Audit insights on the go
Regardless of the size of an organization or availability of data, it takes weeks to prepare and present comprehensive audit reports. The numbers are usually saved offline as large files or copied to multiple slides for boardroom meetings.
Mobile data analytics enables a concise and easily accessible digital avatar of audit reports and dynamic dashboards that can be accessed on mobile devices to interact and proactively monitor the business information on the go.
3.Data Visualization
When it comes to presenting audit data, reports and findings, one gets a single view of the entire raw data, all at once. This makes it difficult to decipher what is important and what isn’t, the reason why the point of sharing information gets defeated. Data visualization helps get a flexible and reliable way to identify and share pertinent information in a manner that everyone can easily understand.
There are many reasons why auditing is ripe for self-service analytics and visualization driven transformation. There is more data to examine within limited time span. Most financial and operational transactions are moving online, and the number of variables, outliers, trends, and patterns to identify and analyze continue to increase each day.
Visual analytics is the fastest way to analyze and understand structured or unstructured data of any size, without IT assistance. Visual technologies help speed up and improve decision making with heat maps, bubble charts, and interactive dashboards that are easy for C-suite executive, non-technical business users, and stakeholders to understand.
Everything gets better when you can do it yourself, right? Self-service audit analytics and visualization too are not different.
Benefits of self-service analytics in Internal Audit
Skills gap
Insufficient IT support
Difficulty to manage and manipulate data
Increasing requests for ad-hoc analysis and one-off reports
Difficulty in dealing with the basic aspects of data management and governance
Easy access to any source data
Guided analysis – Faster answers to complex questions
Intuitive drag-and-drop interface to create and share interactive reports.
Natural language processing to respond to complex queries
Interactive visualizations and personalized dashboards to identify patterns and trends
Fast to deploy and easy to manage
All-encompassing data analysis anywhere, at anytime
Process more information than reading numbers
Discover insights using spatial relationships, colors, and textures
Make data accessible to a broader audience and provide users with a rich and engaging experience
A DEEP DIVE INTO TABLEAU 2019.3
TABLEAU CATALOG
What could be better than a feature that could provide better visibility and better data management at the same time, and also ensure that the right data is always used for analysis. This is possible with the new feature -Tableau Catalog.
 This feature provides a complete picture of the data and how each data is connected.
Another use of Tableau Catalog is linear and impact analysis. This not only shows which assets will change but also who will be affected by it, which makes work easier for many and avoids wastage of time.
EXPLAIN DATA
Tableau 2019.3 is up with a new Al-driven feature called the “Explain Data”, which helps people go from the “what” of the data to the “how” of it. With explain data, we can get an explanation for each unexpected value in the data by just a single click. On selecting the desired data point, the ‘explain data’(lightbulb) icon appears.
For each value there might be a number of explanations. Each of these explanations are checked and only the most likely ones are provided as visualizations.
This feature provides a complete picture of the data and how each data is connected.
Another use of Tableau Catalog is linear and impact analysis. This not only shows which assets will change but also who will be affected by it, which makes work easier for many and avoids wastage of time.
EXPLAIN DATA
Tableau 2019.3 is up with a new Al-driven feature called the “Explain Data”, which helps people go from the “what” of the data to the “how” of it. With explain data, we can get an explanation for each unexpected value in the data by just a single click. On selecting the desired data point, the ‘explain data’(lightbulb) icon appears.
For each value there might be a number of explanations. Each of these explanations are checked and only the most likely ones are provided as visualizations.
 Now these visualizations can be used for further explorations.
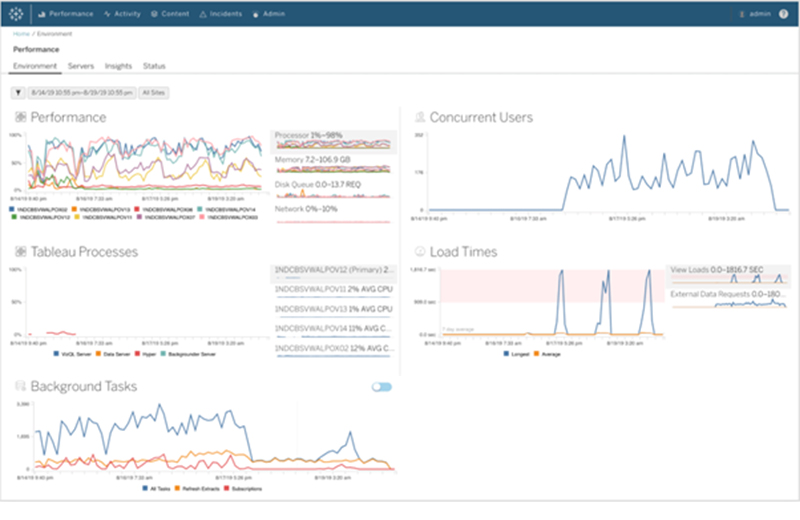
TABLEAU SERVER MANAGEMENT ADD-ON
Organizations that run critical deployment of Tableau Server at a large scale, have mentioned concerns over manageability and scalability. They have been in search for tools that could organize the management process in an efficient way, which could save a lot of time. Tableau solved this problem by introducing the Tableau Server Management Add-on – a new feature designed to help organizations manage the deployment of Tableau Server. With this, they can quickly react to the changing needs of the business as well as save time by organizing the management process in the most efficient way. Tableau Server Management Add-on, which makes running the critical deployment of tableau at a large-scale server much simpler.
Now these visualizations can be used for further explorations.
TABLEAU SERVER MANAGEMENT ADD-ON
Organizations that run critical deployment of Tableau Server at a large scale, have mentioned concerns over manageability and scalability. They have been in search for tools that could organize the management process in an efficient way, which could save a lot of time. Tableau solved this problem by introducing the Tableau Server Management Add-on – a new feature designed to help organizations manage the deployment of Tableau Server. With this, they can quickly react to the changing needs of the business as well as save time by organizing the management process in the most efficient way. Tableau Server Management Add-on, which makes running the critical deployment of tableau at a large-scale server much simpler.
 The server management add-on feature can help in optimising the performance of deployment by customizing which nodes process background jobs such as extract refreshes and subscriptions and isolating these workloads, to specific nodes. This makes it easier to scale deployments to the needs of their organization.
This feature has a few tools, including two for better reliability and scalability and one for content migration, all of which helps the organizations to govern their data effectively.
If you are interested in learning more about the latest Tableau release and use cases, please contact us at training@beinex.com/ info@beinex.com and we would be happy to schedule a Tableau demo or training for you and your company.
The server management add-on feature can help in optimising the performance of deployment by customizing which nodes process background jobs such as extract refreshes and subscriptions and isolating these workloads, to specific nodes. This makes it easier to scale deployments to the needs of their organization.
This feature has a few tools, including two for better reliability and scalability and one for content migration, all of which helps the organizations to govern their data effectively.
If you are interested in learning more about the latest Tableau release and use cases, please contact us at training@beinex.com/ info@beinex.com and we would be happy to schedule a Tableau demo or training for you and your company.
This feature provides a complete picture of the data and how each data is connected.
Another use of Tableau Catalog is linear and impact analysis. This not only shows which assets will change but also who will be affected by it, which makes work easier for many and avoids wastage of time.
EXPLAIN DATA
Tableau 2019.3 is up with a new Al-driven feature called the “Explain Data”, which helps people go from the “what” of the data to the “how” of it. With explain data, we can get an explanation for each unexpected value in the data by just a single click. On selecting the desired data point, the ‘explain data’(lightbulb) icon appears.
For each value there might be a number of explanations. Each of these explanations are checked and only the most likely ones are provided as visualizations.
Now these visualizations can be used for further explorations.
TABLEAU SERVER MANAGEMENT ADD-ON
Organizations that run critical deployment of Tableau Server at a large scale, have mentioned concerns over manageability and scalability. They have been in search for tools that could organize the management process in an efficient way, which could save a lot of time. Tableau solved this problem by introducing the Tableau Server Management Add-on – a new feature designed to help organizations manage the deployment of Tableau Server. With this, they can quickly react to the changing needs of the business as well as save time by organizing the management process in the most efficient way. Tableau Server Management Add-on, which makes running the critical deployment of tableau at a large-scale server much simpler.
The server management add-on feature can help in optimising the performance of deployment by customizing which nodes process background jobs such as extract refreshes and subscriptions and isolating these workloads, to specific nodes. This makes it easier to scale deployments to the needs of their organization.
This feature has a few tools, including two for better reliability and scalability and one for content migration, all of which helps the organizations to govern their data effectively.
If you are interested in learning more about the latest Tableau release and use cases, please contact us at training@beinex.com/ info@beinex.com and we would be happy to schedule a Tableau demo or training for you and your company.
Note: The Server Management Add-on is not available for Tableau Online, as they manage everything from scaling, performance, and security on behalf of their Tableau Online customers. The Tableau Server Management Add-on can be separately purchased from the Tableau Server deployment.

Gamification: The New Engaging Prospect in UAE Digital Health Care
The adoption of digitalised solutions in the healthcare sector has been sparked by the pandemic and a sharp change in people's expectations and lifestyles. Additionally, consumers are in a better position since they enjoy high levels of digital connectivity thanks to reasonably priced internet access, various mobile device technologies, and a sizable app development ecosystem.
What is Gamification
Gamification, frequently used across various business use cases like loyalty management, has gained popularity in the healthcare sector over the past few years. It is the process of introducing game components to solutions, such as activity design, and providing incentives within already-existing processes to create engaging experiences and increase process adoption.
The main goals of gamification in healthcare are to tailor each patient's care and participation and to develop better patient-centred services. Since it incorporates action-based challenges and rapid rewards, gamification has increased patient motivation and engagement. This makes it easier for patients to keep track of their progress.
By using gamification tactics to organise their activities, gamified actions to fulfil the targets, and the chance to share their progress with others, patients can be guided, monitored, and kept interested.
Tracking symptoms and overall health: Instead of consulting doctors, most internet users conduct online searches for information on health-related topics or related topics. The patient's journey begins at this digital entrance. Healthcare providers have the chance to establish themselves as industry leaders by offering digital platforms for consumers to interact, measure wellness, and monitor their health metrics. Some widely used apps use gamification techniques to deliver physical treatment through a virtual learning environment. Motion-guided technology is used to monitor and guide patients. Healthcare professionals can connect to this platform, which enables patients to communicate virtually with licensed physical therapists.
Appointment scheduling: Giving patients a seamless appointment-making experience is one of the critical elements in patient engagement. Patients can use digital health platforms or applications to automatically book appointments with qualified practitioners based on their locations and symptoms. The gamification tactics that engage patients before entering medical facilities can reduce their worry about health outcomes.
Treatment and ongoing care: Data from activity and behaviour monitoring is integrated with health systems that can be used to enhance patient profiles. By better understanding the symptoms, doctors can correctly identify severe disorders. Remote patient activity and critical health metrics can be monitored with data integration between clinical health systems and health apps on patients' mobile devices. Some gamification applications are made to help users create customised health plans, track, and analyse behavioural patterns, and encourage adherence to plans by delivering reminders and tracking user behaviour.
Health insurance: The amount of engagement between patients and insurance companies is minimal. Medical bill payments, reimbursement, and claims are often the focus of this conversation. Nevertheless, by using gamification techniques, health insurance providers can expand and improve their services. Using virtual money and discounts to provide quotations is one example of how such tactics have been used. Price reductions for customers may be offered.
Healthcare providers who lead the charge in the digitalisation of healthcare will be those who use data linkages and gamification techniques to build and improve the patient journey. Applying gamification strategies across healthcare processes for proactive patient engagement and data analytics to monitor, predict, and design true personalisation across the illness or wellness lifecycle are critical components to achieving a fully digitalised healthcare ecosystem. Compliance, data security, and privacy continue to be critical issues. Healthcare providers must comply with patient privacy laws when implementing system integrations and gamified applications.
Gamification opportunities for the entire patient journey
A technology component at each stage of the patient journey can be leveraged to enhance the user experience. Gamified health platforms are projected to progressively use relationships with health providers, health data products, mobile apps, wearable devices, and insurance companies for data integration. Many data aggregators gather information from numerous other health monitoring applications on patients' mobile phones and wearable technology like smartwatches.
Digital services have been enthusiastically accepted all over the UAE. It has been incorporated into UAE healthcare to benefit patients and enhance outcomes in areas including chronic illness management, diagnostics, and preventative care. The UAE's most popular digital health solutions are online pharmacies, fitness applications, teleconsultations, online fitness classes, and diet-management apps.
You can build gamification capabilities and digitally transform your healthcare ecosystem by implementing data integration and analytics strategies, which Beinex Digital can assist you with.
10 Tableau Data Dashboard Design Hacks for Clear Insights & Faster Decisions
1. Understand Your Audience
The best dashboards are built with a specific audience in mind. Consider who will be using your dashboard and what their goals are. Are they busy executives who need to quickly grasp key performance indicators (KPIs), or are they analysts who need to drill down into details? Once you know your audience, you can tailor your dashboard design to their needs.
 Source: https://www.tableau.com/learn/whitepapers/10-best-practices-building-effective-dashboards?utm_medium=blog
2. Optimize Layout
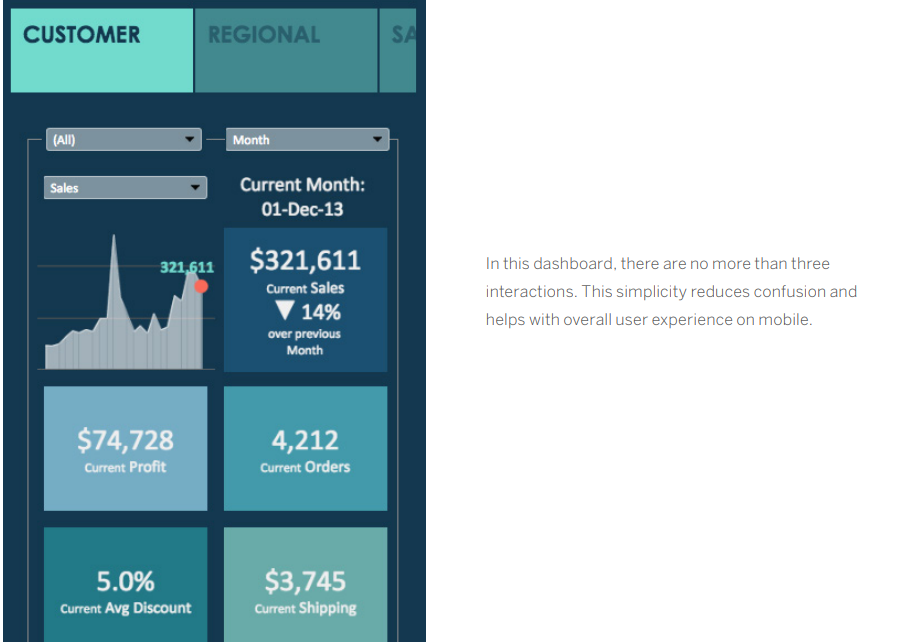
In today's mobile-first world, it's important to design dashboards that look good and function well on a variety of devices. When designing your dashboard, consider how your audience will be consuming the information. If they're primarily using mobile phones, you'll need to prioritize the most important KPIs and optimize the layout for a small screen.
3. Minimize Page Load Times
No one wants to wait for a dashboard to load. Slow load times can be caused by a variety of factors, including the size of your data set and the complexity of your visualizations. To improve load times, you can optimize your data queries, use extracts, and leverage Tableau's built-in performance optimization features.
4. Insights-Based Design
When designing your dashboard layout, consider how your audience will naturally "read" the information. Group related pieces of information together and use visual cues like shading, lines, and white space to guide the eye. The most important information should be placed in the upper left corner of the dashboard, as this is where most viewers will start looking.
5. Minimize Views and Colors
It's tempting to include every relevant piece of data in your dashboard, but this can lead to information overload. Stick to two or three key views, and use color strategically to highlight important trends or patterns. Avoid using too many colors, as this can make your dashboard visually overwhelming.
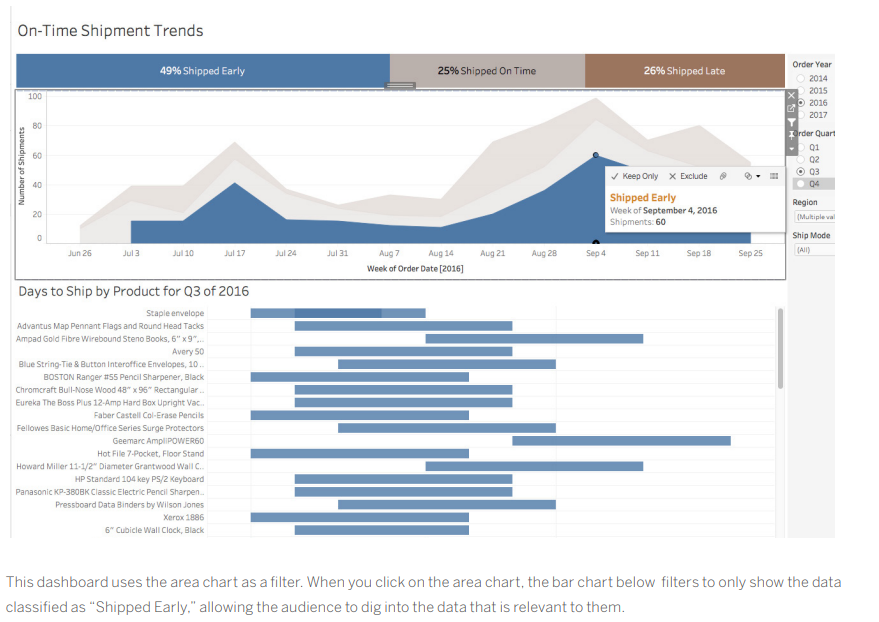
6. Incorporate Interactive Features
Dashboards are most powerful when they allow users to interact with the data. Use filters, highlights, and actions to let users explore the data in different ways. This will help them to gain a deeper understanding of the information and answer their own questions.
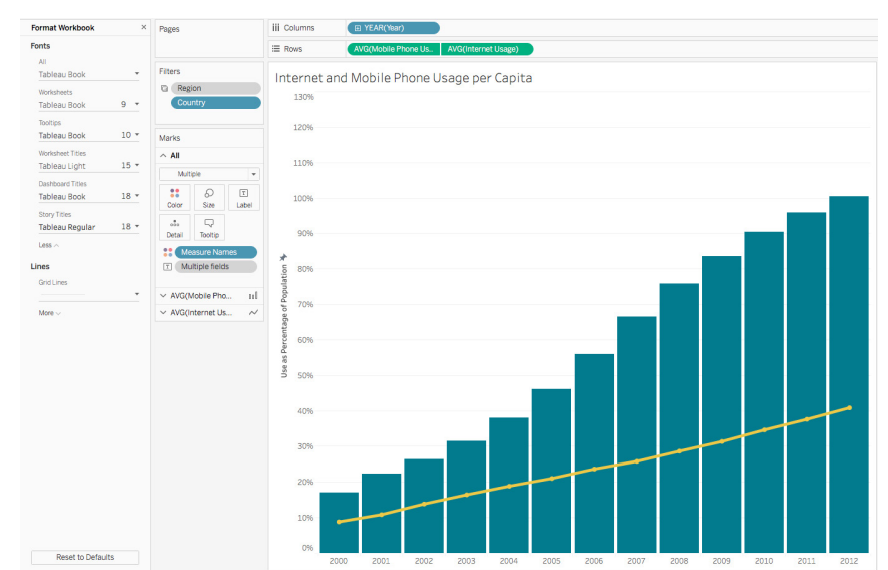
7. Arrange by Hierarchy
When formatting your dashboard, it's best to start with the largest elements and work your way down to the smallest. This will help you to avoid accidentally overwriting your changes. The hierarchy of dashboard formatting typically follows this order: theme, workbook, and worksheet.
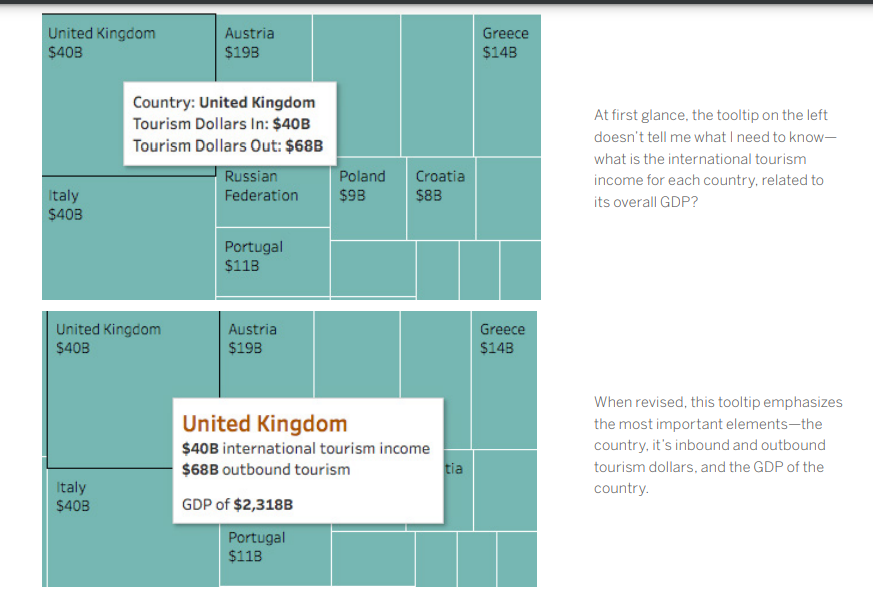
8. Utilize Tooltips and Whitespace for Effective Design
Tooltips are a great way to provide additional information without cluttering up your dashboard. Use tooltips to display detailed data points or to link to external resources. White space is also essential for good dashboard design. It helps to improve readability and make your dashboard less visually overwhelming.
9. Prioritize Clarity
Every element on your dashboard should serve a purpose. If a title, legend, or axis label isn't necessary, get rid of it. Consider using a floating layout to create more white space and improve readability.

10. Ensure Dashboard Effectiveness
Once you've built your dashboard, it's important to test it with your target audience. Ask them how they're using the dashboard and if it helps them answer their questions. Use their feedback to iterate on your design and create dashboards that are truly effective.
By following these best practices, you can create dashboards that are clear, concise, and actionable. Effective dashboards will help your audience understand your data and make better decisions.
How Beinex Can Assist You
Beinex, a premier Tableau partner, provides sustainable analytics solutions to organizations and helps to build superior data visual analytics capabilities internally through our bespoke training programs. Our team of Tableau-certified consultants are real-life Tableau business users who are passionate about Tableau and delivering a world-class experience. Connect with us for a Tableau free trial: www.beinex.com/free-tableau-software
Image source: https://www.tableau.com/learn/whitepapers/10-best-practices-building-effective-dashboards?utm_medium=blog

AWS vs AZURE vs GCP: THE LEADING CSPs FROM A COMPARATIVE LENS
Benefits of Cloud Computing
Worldwide Vendor Market Share
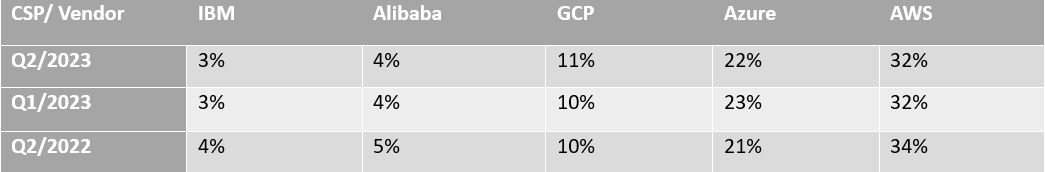 Sourced from: Cloud Market Share Q2 2023: AWS, Microsoft, Google Battle | CRN
AMAZON WEB SERVICES (AWS)
Amazon Web Services is the most extensive and widely adopted cloud platform worldwide, offering over 200 fully featured services across global data centres. AWS is used by millions of customers, including fast-growing startups, major enterprises, and prominent government agencies, to reduce costs, enhance agility, and accelerate innovation.
The USPs of AWS
Popular Customers of AWS
Netflix:Netflix relies on AWS for most of its computing and storage requirements, including analytics, databases, recommendation engines, video transcoding and numerous functions utilizing over 100,000 server instances on the AWS platform.BMW Group: BMW Group leverages AWS to acquire the agility and flexibility necessary for democratizing data usage and expediting innovation.
Philips: Philips is an early adopter of AWS that utilizes AWS services to manage the Philips HealthSuite Platform, ensuring scalability, cost-effectiveness, and regulatory-compliant solutions.
Salesforce: Salesforce shares a global strategic relationship with AWS, utilizing AWS compute, storage and AI solutions to create and deploy innovative business applications.
Pinterest: The exabyte data platform of Pinterest is hosted exclusively on AWS, managing log search and analytics that surpass 1.7TB. This implementation has led to a 30% reduction in operational costs.
Coca-Cola: After its migration to AWS, Coca-Cola has reduced operational costs by 40% and IT ticket volume by 80%.
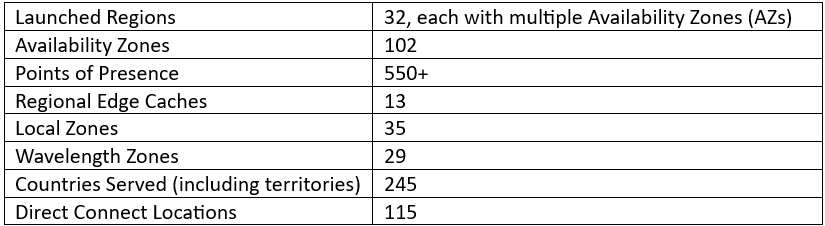
Regions & Availability
AWS boasts the most expansive global cloud infrastructure. Gartner has acknowledged the AWS Region and Availability Zone framework as the endorsed strategy for operating enterprise applications demanding high availability.
The AWS Cloud covers 102 Availability Zones across 32 geographic regions worldwide, with disclosed intentions to introduce an additional 15 Availability Zones and 5 AWS Regions in Germany, Canada, Thailand, Malaysia and New Zealand.
MICROSOFT AZURE
The Azure cloud platform encompasses over 200 products and services crafted to empower you to bring innovative solutions to fruition, addressing current challenges while shaping the future. It offers the flexibility to build, run, and manage applications across various clouds, on-premises, and at the edge, utilizing the tools and frameworks as per your preferences.
The USPs of Microsoft Azure
Popular Customers of Microsoft Azure
New York City Department of Environmental Protection (DEP): DEP uses a Microsoft infrastructure specifically designed with modern security considerations. With the solution in the cloud, Microsoft manages disaster recovery, reducing the necessity for maintaining certain skill sets in-house. CCC Group: CCC Group utilizes Azure Data Lake and Data Warehouse to collect, store, and segment data. Panasonic Connect Co: Panasonic Connect Co maximizes the benefits of PaaS services such as Azure IoT Hub, Synapse Analytics, and Azure Kubernetes Services. Hamburg Commercial Bank: Hamburg Commercial Bank opted for Microsoft Azure Virtual Desktop to achieve improved performance, reliability, and enhanced interoperability with other Microsoft technologies previously invested in. Barnsley Hospital NHS Foundation Trust: Barnsley Hospital NHS Foundation Trust adopted a new, integrated platform using Power Platform and Microsoft Teams for video consultations. During the COVID-19 pandemic lockdowns, the Trust rapidly deployed Microsoft Teams to facilitate remote work and staff collaboration.Regions & Availability:
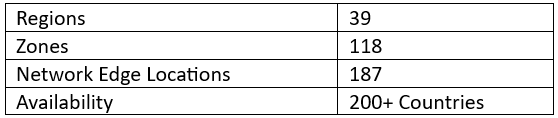
Microsoft operates highly secure data centre facilities globally, forming a distributed infrastructure that sustains thousands of online services. This expansive, globally distributed infrastructure prioritizes sustainability, bringing applications closer to users, ensuring data residency, and providing customers with comprehensive compliance and resiliency options.
As of March 2023, Microsoft Azure boasts 160 active data centres spread across 60 regions worldwide. These Azure regions, defined by geographical areas, house one or more physical Azure data centres. Operating within a latency-defined perimeter, these data centres are strategically positioned to deliver optimal performance and security to users.
Azure leads with over 60 announced regions, surpassing all other cloud providers. It is accessible in 140 countries, showcasing a global presence that sets it apart in cloud computing.
GOOGLE CLOUD PLATFORM (GCP)
Google Cloud, also called Google Cloud Platform, offers computing resources dedicated to developing, deploying, and operating web applications. While its cloud infrastructure supports applications like Google Workplace, GCP primarily serves as a platform for constructing and managing custom applications. These applications can subsequently be published on the web, leveraging the extensive capabilities of its hyperscale data centre facilities.
The USPs of the Google Cloud Platform
Popular Customers of the Google Cloud Platform
Etsy: Utilizing the collaborative tools offered in Google Workspace, Etsy meets the evolving needs of sellers and buyers innovatively, fostering continued growth and enhancing the sustainability of its operations. X (formerly Twitter): Twitter's complete shifting of its ad analytics data platform to Google Cloud granted developers increased agility, allowing them to configure existing data pipelines more easily and build new features acceleratedly. Airbus Defence and Space: Airbus Defence and Space's Intelligence business line employs Google Cloud to construct a scalable online platform, enabling customers to access petabytes of satellite imagery in real-time.Regions & Availability
Google Cloud provides global coverage through regions distributed worldwide, ensuring low cost, minimal latency, and optimal application availability for customers.
Follow the link to have a look into a tabular comparison of the solutions provided by the CSPs: AWS, Azure and GCP. https://cloud.google.com/docs/get-started/aws-azure-gcp-service-comparison