How AI Decision-Making is Improving Enterprise Outcomes
Blog
Share 
Best Cloud Data Management Tools Fit for Businesses of All Sizes
 13 September 2024
  Sumi S
 What is Cloud Data Management?
Cloud data management refers to the framework that allows businesses to store, manage, and access their data using cloud-based services and applications. It encompasses the entire data lifecycle, from collection and storage to processing and analysis, while ensuring that data remains secure and compliant with regulatory standards. The flexibility of cloud data management allows organizations to scale up or down based on their needs and optimize data operations, which in turn leads to better decision-making and actionable business insights.
The Importance and Benefits of Cloud Data Management
Cloud data management has become a necessity in the data-centric world. Organizations are immersed with vast amounts of data, which must be efficiently stored, processed, and analyzed. Here are the key benefits:
- Scalability and Flexibility: One of the biggest advantages of cloud data management is its ability to scale as needed. Traditional data management systems often require substantial infrastructure investment, but cloud solutions allow businesses to pay only for the resources they use, making it cost-effective.
- Enhanced Data Security: With stricter regulations on data privacy (such as GDPR and HIPAA), cloud data management ensures that data is securely stored and compliant with global standards. Cloud service providers offer tools to protect data from unauthorized access and breaches.
- Improved Collaboration and Accessibility: Cloud data management allows users to access data from anywhere at any time, enabling remote work and collaboration across geographically dispersed teams.
- Disaster Recovery and Business Continuity: Cloud-based data management systems offer advanced disaster recovery options. By replicating data across multiple locations, organizations can ensure that their data is safe and accessible, even in the event of hardware failure or a catastrophe.
Cloud Data Management vs. Traditional Data Management
In contrast to traditional on-premises data management (TDM), cloud data management (CDM) provides enhanced flexibility and scalability. Traditional data management systems require a significant upfront investment in physical servers, storage, and IT staff, whereas CDM enables rapid scaling with minimal financial and physical overhead.
CDM also offers superior disaster recovery by distributing data across multiple locations, a benefit that is difficult to achieve with TDM’s centralized approach. Furthermore, CDM allows team members to access data remotely, enhancing collaboration—something that traditional systems often struggle to provide.
A Hybrid Approach to Data Management
For businesses looking to maintain control over sensitive data while leveraging cloud-based tools, a hybrid approach to data management combines the strengths of both cloud and traditional systems. A hybrid model allows organizations to store sensitive data on-premise while utilizing cloud resources for dynamic, less sensitive data. This approach offers scalability, cost-efficiency, and disaster recovery while keeping critical data secure and compliant with industry regulations.
Top Cloud Data Management Tools
Several leading cloud data management tools dominate the market, offering comprehensive solutions for businesses with various data needs. Here are the top three tools:
1. Amazon Web Services (AWS)
Amazon Web Services offers an extensive range of cloud-based tools and services that allow businesses to manage their data effectively. Notable AWS services include:
• Amazon S3: A scalable storage service designed for temporary and intermediate data storage.
• Amazon S3 Glacier: A low-cost cloud storage service ideal for long-term data archiving.
• Amazon Redshift: A fully managed data warehouse that makes analyzing large datasets using SQL simple.
• Amazon Athena: An interactive query service that allows users to analyze data in Amazon S3 using SQL.
• Amazon QuickSight: A scalable, serverless business intelligence service for building interactive dashboards.
AWS Pricing: AWS follows a pay-as-you-go pricing model, making it highly flexible for businesses of all sizes.
2. Microsoft Azure
Microsoft Azure provides a wide range of cloud-based tools for data management, making it a popular choice for enterprises. Key Azure services include:
• Azure Blob Storage: A massively scalable object storage solution for unstructured data.
• SQL Databases: Managed SQL database services that simplify data management without the need for complex infrastructure.
• Azure Data Explorer: A real-time data analytics service that can handle large datasets with minimal preprocessing.
• Private Cloud Deployments: For businesses looking for more control over their infrastructure.
Azure Pricing: Like AWS, Microsoft Azure also offers flexible pricing based on the services and resources used.
3. Google Cloud Platform (GCP)
Google Cloud Platform offers a range of cloud-based data management services, known for their strong integration with Google’s ecosystem and ease of use. Prominent services include:
• Google Cloud Storage: A fully managed service for storing unstructured data.
• Google BigQuery: A fully managed data warehouse that allows users to run SQL queries on large datasets.
• Cloud BigTable: A NoSQL database service designed for large-scale workloads.
• Google Data Studio: A business intelligence platform for building intuitive dashboards and visualizing data.
• Cloud Datalab: A powerful tool for machine learning and data science projects.
• Cloud Pub/Sub: A messaging service designed for real-time data ingestion and processing.
GCP Pricing: Google Cloud Platform offers competitive pricing with a flexible pay-as-you-go model that caters to various business needs.
Conclusion
Cloud data management is essential for modern businesses looking to stay competitive in the digital era. By offering scalability, enhanced security, improved collaboration, and disaster recovery, cloud data management tools like AWS, Microsoft Azure, and Google Cloud Platform provide a comprehensive solution to managing data efficiently and effectively. As data grows in volume and complexity, leveraging these tools will be key to driving innovation and maintaining a competitive edge.
Cloud data management has transformed the way businesses handle and process their data. In the fast-paced digital era, shifting from traditional databases to cloud-based solutions has become essential for organizations seeking agility, scalability, and enhanced security. Cloud data management represents the technologies and practices used to manage, store, and access data across cloud platforms, providing immense benefits for businesses.
Related Articles

Prepping the data on Tableau: Five aspects that matter
Data preparation is purging imperfectly formed data, reorganising unclean data, and merging various data sets for analysis. Rows and columns in the data structure must be changed, and data types and values must be cleaned up. The amount of time it takes to find insights directly depends on how quickly and well you prepare your data. The entire process can be sped up by being aware of the extent of the data you're studying and observing the modifications you make to the data.
With the help of Tableau Prep Builder, data can be combined, shaped, and cleaned more quickly and easily for analysis within Tableau. You can swiftly obtain high-quality data using the linear and visual approach when preparing your data.
When ushering in data into a data prep tool, it is always better to know what you're working with and whether you're looking at the complete data set or just a subset. Before you begin cleaning, you might also need to undertake some data research. Five crucial steps are to be taken care of for prepping the data.
Let's have a look:



 One technique to get beyond this obstacle is visualising the data pane in Tableau Desktop as to how it should appear. Do you have columns with the same value in several places? Should each product be in a single field with the sales transactions stated below, or should each product have its column with the sales transactions listed underneath? The latter is more likely, and a pivot is necessary for this situation.
You will be joining the data if you need to combine two tables. By using a join, you can increase the number of fields in your data source that you can investigate. Although a join can be added at any point during the data preparation process, the sooner you use it, the sooner you will comprehend the data set and identify areas that require immediate attention.
One technique to get beyond this obstacle is visualising the data pane in Tableau Desktop as to how it should appear. Do you have columns with the same value in several places? Should each product be in a single field with the sales transactions stated below, or should each product have its column with the sales transactions listed underneath? The latter is more likely, and a pivot is necessary for this situation.
You will be joining the data if you need to combine two tables. By using a join, you can increase the number of fields in your data source that you can investigate. Although a join can be added at any point during the data preparation process, the sooner you use it, the sooner you will comprehend the data set and identify areas that require immediate attention.
 Like appending two data sets together, a union enables you to do so. For instance, you might have an Excel file where each sheet displays transactions from different years. You may maintain the same structure with extra rows by using a union rather than joining the tables.
After your data has been organised, processed, and filtered, it's time to interpret what it is trying to tell you. Tableau Prep connects with your entire business intelligence platform like many other data preparation products. To allow others to begin their analysis, publish the extract to Tableau Server or Tableau Cloud. Bring it into Tableau Desktop to start posing and investigating more in-depth queries. The hardest part of the data analysis process is now complete. It's time to share the breakthroughs that resulted from your hard work.
Like appending two data sets together, a union enables you to do so. For instance, you might have an Excel file where each sheet displays transactions from different years. You may maintain the same structure with extra rows by using a union rather than joining the tables.
After your data has been organised, processed, and filtered, it's time to interpret what it is trying to tell you. Tableau Prep connects with your entire business intelligence platform like many other data preparation products. To allow others to begin their analysis, publish the extract to Tableau Server or Tableau Cloud. Bring it into Tableau Desktop to start posing and investigating more in-depth queries. The hardest part of the data analysis process is now complete. It's time to share the breakthroughs that resulted from your hard work.
1. Adjust the data sample size
To speed up your data preparation process and improve performance, you should generally only connect to a small portion of a vast data set. You might occasionally prefer to view the entire data set, and Tableau Prep enables you to do so. If a sample doesn't help you complete your data preparation task, you can try the following:
- a. Boost the size of your data sample: Adjust the sample's row count by returning to the input stage. You can add more rows or include all the data but remember that doing so might make the performance slower. Another word of caution is that utilising a specified number of rows will only return the fastest method the underlying database can find to replace the given rows.
- b. Take random sampling: Tableau Prep automatically chooses the optimal number of rows to return based on the total number of fields in the collection and the data types of those columns. The database level random sampling occurs and returns the specified number of rows. The database returns a sample after inspecting each entry. Not all data sources provide this option, which could also affect performance.
- c. Add a step filter at the input stage: You may ensure that the information pulled into your data set is pertinent to your research by including a filter at the input stage. This improves performance while providing you with a more representative sample.
2.Evaluate the data
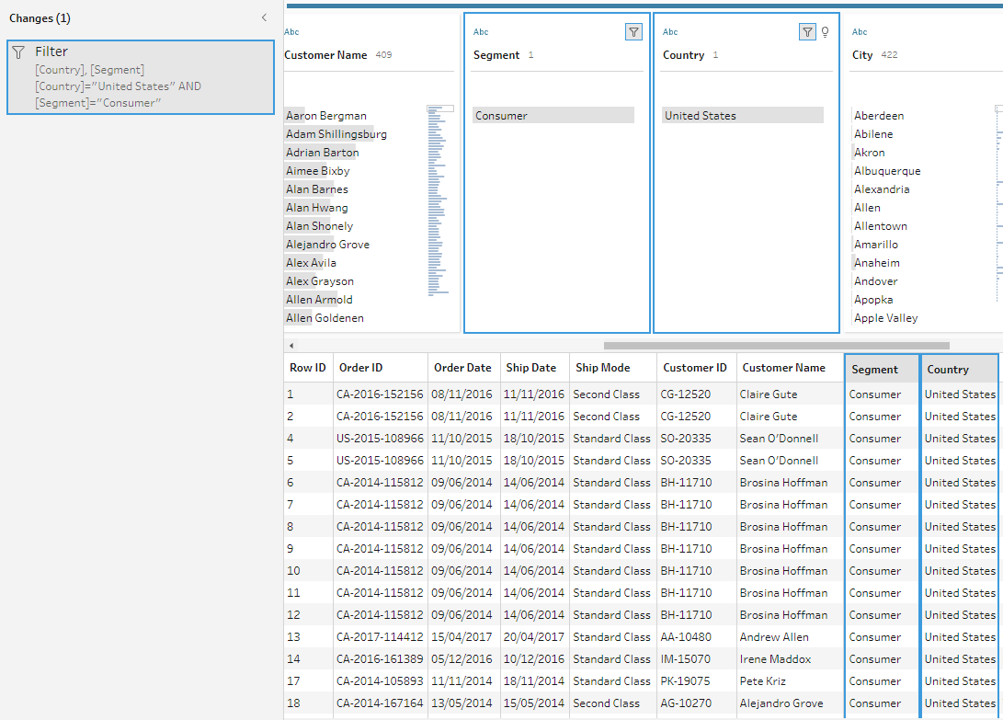
You'll probably want to start by counting the number of distinct values in each field. A simple check at the column header at the top reveals how many states are represented in the data set. You'll also want to understand how various values connect to identify data outliers or problems. You can utilise highlighting in Tableau Prep to find correlations between different fields. The data grid view is condensed to only display the records with the selected value in the chosen field when you click on a value in the profile pane. Tableau Prep highlights the corresponding values in blue, and the values span areas.
3.Filter the data
Limit the fields you import into Tableau Prep to those you'll need for your analysis to maximise the overall effectiveness of your data preparation process. By filtering your data, you can verify that you're performing the proper analysis while saving time. For instance, if you need to look at sales data from the previous two years, you may use the range or relative date filters to limit the date field to that period. You might want to eliminate any incorrect or irrelevant data. A value in the data pane can be excluded with a single click. You can do this at any time during your flow.
4.Assess and tidy up the data
Tableau's data types will have an impact on your analysis. Therefore, it's critical to correctly identify each field before beginning. Even though Tableau allows you to update aliases, alter data types, split lots, and create calculations, it is far simpler to carry out these tasks beforehand, particularly when preparing the data set for someone else. Tableau Prep includes built-in capabilities to aggregate and replace recurring characters or pronunciation, saving you from having to edit each one individually so that you don't have to; these solutions use algorithms to make cleaning easier. Or, if you foresee a missing value, you may manually add it so that it will be included when the flow processes the complete data set. You can apply a computation if you know that a field must be cleaned or filtered, but it takes more than the user interface offers.
5.Understand the data results
Deciding about the final data set's appearance while you begin to prepare your data can be difficult. For Tableau to effectively analyse your data, you might need to merge numerous data sources or pivot your data from columns to rows.
One technique to get beyond this obstacle is visualising the data pane in Tableau Desktop as to how it should appear. Do you have columns with the same value in several places? Should each product be in a single field with the sales transactions stated below, or should each product have its column with the sales transactions listed underneath? The latter is more likely, and a pivot is necessary for this situation.
You will be joining the data if you need to combine two tables. By using a join, you can increase the number of fields in your data source that you can investigate. Although a join can be added at any point during the data preparation process, the sooner you use it, the sooner you will comprehend the data set and identify areas that require immediate attention.
Like appending two data sets together, a union enables you to do so. For instance, you might have an Excel file where each sheet displays transactions from different years. You may maintain the same structure with extra rows by using a union rather than joining the tables.
After your data has been organised, processed, and filtered, it's time to interpret what it is trying to tell you. Tableau Prep connects with your entire business intelligence platform like many other data preparation products. To allow others to begin their analysis, publish the extract to Tableau Server or Tableau Cloud. Bring it into Tableau Desktop to start posing and investigating more in-depth queries. The hardest part of the data analysis process is now complete. It's time to share the breakthroughs that resulted from your hard work.
Data Sharing Best Practices in Snowflake
Snowflake Data Sharing
Data sharing in Snowflake equips you to share specific objects with another Snowflake account or a designated reader account. The beauty of this process lies in the fact that the data isn't duplicated or moved between accounts.
Now, why is this a game-changer for organisations? When constructing data pipelines and developing data products, it's a common practice to shuttle data between databases and diverse systems to blend different datasets.
Consider this scenario: You have transactional data within your online transactional processing (OLTP) database, and you wish to integrate it with external data for a machine learning model. Traditionally, organizations would export data into a data lake, import external data, and then employ tools like Apache Spark for analysis.
But what if, instead, you could simply deposit your data into Snowflake, and the external data source could seamlessly share its data with your organisation, eliminating the need to load it separately? This eradicates the challenge of keeping data copies synchronised, resulting in savings on storage, computing costs, and maintenance efforts.
Imagine your company possesses valuable information that can guide other companies in making informed decisions. For instance, let's say your company can provide precise estimates for product delivery times based on proprietary data, and you want to offer this information for sale to your customers.
Enter Snowflake data sharing—it empowers you to precisely do that.
Case Studies: Snowflake Data Sharing
Citing two instances where leading organisations use Snowflake to improve actionable data sharing, collaboration and reporting capabilities.
1. A Pioneering Technology Leader
A well-known Swedish-Swiss multinational corporation successfully implemented a streamlined data strategy using the Snowflake Data Cloud, adopting an "extract once, use everywhere" approach that simplified data consolidation and enablement. By transitioning from nightly extracts, which caused significant system overhead, to a single, near real-time Change Data Capture (CDC) process, the company achieved efficient replication of information to Snowflake with minimal impact. The utilisation of Snowflake Secure Data Sharing facilitated secure and governed data collaboration across the four business areas.
2. A Leading fast-food Restaurant Chain
Snowflake's data-sharing capabilities have revolutionised decision-making for a fast-food restaurant chain. They can effortlessly share crucial sales, inventory, and operational data with external entities, expanding from three to over 30 parties.
With a high-performance database platform hosting over 2 million transaction records, the restaurant chain has established a robust data management and analysis infrastructure through Snowflake, empowering its operational and marketing endeavours.
Moreover, by consolidating all data onto Snowflake, the organisation has achieved a remarkable 70% reduction in operational IT costs, demonstrating the platform's efficiency and cost-effectiveness.
Centralising and sharing data with Snowflake significantly eased the development of data products for various purposes, including marketing campaign analytics, quotation success metrics, production line tools, and supply chain dashboards. These data products are utilised by thousands of users globally, including internal stakeholders and external vendors, enhancing collaboration and efficiency across the organisation.
What are the best practices for Snowflake data sharing?
Optimize your Snowflake data sharing experience with these essential practices. Ensure data security by utilizing secure views to filter and mask sensitive information. Enhance clarity and understanding by employing descriptive names and comments for your shares. Monitor and fine-tune your sharing activities using Snowflake Information Schema or Account Usage views. Foster communication and collaboration with your consumers to create a seamless workflow.
Take command of your data sharing environment by setting quotas and limits with the ALTER SHARE command. Keep your consumers informed about any changes or updates to your shares, and actively seek feedback to refine your data-sharing strategy. Explore additional data sources through Snowflake Data Exchange or Data Marketplace to enrich your analytics.
These best practices safeguard sensitive data, ensure compliance with data privacy regulations, clarify the purpose of each share, and provide insights into usage and performance, ultimately enhancing your data analysis capabilities. Below are some best practices for data sharing with Snowflake:
- Understand Snowflake Data Sharing Familiarize yourself with Snowflake's data sharing features, such as Secure Data Sharing (SDS) and Sharehouse, to leverage the platform effectively.
- Role-Based Access Control (RBAC) Implement strong RBAC policies to control who can share data and who can access shared data. Define roles and permissions to ensure data security and compliance.
- Secure Data Sharing Use Secure Data Sharing (SDS) to securely share data with external parties without copying or moving the data. Implement encryption and access controls to protect sensitive information.
- Sharehouse Best Practices If using Sharehouse, follow best practices for creating and managing share objects. This includes defining share schemas, tables, and using the appropriate share options for your use case.
- Data Masking and Redaction Apply data masking or redaction policies to shared data to protect sensitive information. Ensure that shared data complies with privacy regulations and internal data governance policies.
- Query Performance Optimization Optimize query performance for shared data by using clustering keys, partitioning, and indexing. This helps enhance the efficiency of queries on large datasets.
- Versioning and Change Tracking Implement versioning and change tracking mechanisms to keep track of updates and changes in shared data. This ensures data lineage and helps with auditing and troubleshooting.
- Documentation and Metadata Maintain comprehensive documentation and metadata for shared datasets. Include information about the source, purpose, and any transformations applied. This helps users understand the shared data context.
- Governance and Monitoring Establish governance practices for data sharing, including regular reviews of shared data objects and access logs. Monitor data-sharing activities to identify any anomalies or potential security issues.
- Educate Users Provide training and documentation for users involved in data-sharing activities. Ensure they understand the best practices, security protocols, and the impact of data sharing on performance.
- Regular Audits and Reviews Conduct regular audits and reviews of shared data objects, permissions, and access controls. This helps maintain data integrity, security, and compliance with organizational policies.
- Cost Monitoring
By adhering to these best practices, you can:
1. Shield Sensitive Data: Employ secure views to fortify sensitive information.
2. Navigate Data Privacy Regulations: Ensure compliance with data privacy regulations by controlling access and usage.
3. Illuminate the Purpose of Each Share: Maintain transparency regarding the intended purpose and content of each shared dataset.
4. Efficiently Monitor Usage and Performance: Keep a finger on the pulse of usage patterns and optimize performance for streamlined data sharing.
5. Elevate Your Data Analysis Journey: Enrich your analytics by exploring diverse data sources and unlocking fresh perspectives.
What’s Next
1. Enhanced Data Collaboration Tools:
Best Way to Share Data for Your Business
For secure collaboration, old ways of copying data are no longer the best. If you're working with trusted partners and it's privacy-compliant, Snowflake Secure Data Sharing is a quick and secure option. But, if you're dealing with sensitive or regulated data, especially when the risk is high, consider using a data clean room for an extra layer of security and compliance.
Beinex + Snowflake Offerings
Beinex’s partnership with Snowflake enables us to offer you advanced features like automated tuning and elastic compute, along with analytics modernisation services, to help your organisation realise exponential Return on Investment.

RUNNING THE MIGHTY SMALL LANGUAGE MODEL PHI-3 ON SNOWFLAKE
What is an SLM?
A Small Language Model (SLM) is tailored to excel in simpler tasks, offering boosted accessibility and user-friendliness for organizations operating with limited resources. Besides, they can be readily fine-tuned to align with specific requirements. Small language models are particularly well-suited for organizations aiming to develop applications capable of operating local devices instead of relying on cloud infrastructure. They are especially beneficial for tasks that do not necessitate extensive reasoning or immediate responses.
Reasons to use SLMs
Given the growing popularity and applicability of SLMs across various domains, particularly in areas like sustainability and the volume of data required for training, there are multiple reasons for employing them.
What is Phi-3?
Microsoft has a suite of small language models (SLMs) known as 'Phi,' demonstrating outstanding performance across various benchmarks. Microsoft's recent release is Phi-3, a series of open AI models. The Phi-3 models represent a prototype of capability and cost-effectiveness among small language models (SLMs), exceeding models of equivalent and larger sizes across the spectrum of coding, language, reasoning, and mathematical standards. This launch broadens the array of high-calibre models accessible to customers, providing them with more practical options as they craft and construct generative AI applications.
Phi-3-mini, a 3.8B language model, is accessible through Microsoft Azure AI Studio, Hugging Face, and Ollama. It is offered in two context-length variations—4K and 128K tokens. Notably, it is the first model within its category to support a context window of up to 128K tokens with minimal impact on quality. Furthermore, it is instruction-tuned, implying that it has been trained to comprehend and adhere to diverse instructions, mirroring natural human communication patterns. This ensures that the model is readily deployable straight out of the box. Phi-3-mini is available on Azure AI to leverage the deploy-eval-finetune toolchain, and it is also accessible on Ollama for developers to execute locally on their laptops.
Features of Phi-3
Phi-3 models exhibit distinctive superiority over language models of comparable and larger dimensions on key benchmarks, showcasing the following features:
Snowflake meets Phi-3: Advantages
The key pain point about LLMs is the computing required to host and run them. Setting up a dozen GPUs to run models can be expensive and complex. There's where Snowflake steps up. Snowflake's compute pool option enables users to easily and quickly set up and manage compute clusters. Phi-3 comes into the picture because of its cost-effective GPU utilization.
Can you imagine a situation where your language model only requires less than 3GB of GPU memory for inference? Well, now it's possible, all thanks to Phi-3. It's a state-of-the-art SLM that produces excellent results over GP3.5 and Mistral 8x7B, which are much bigger models. This opens the door for more cost-effective solutions to be brought up in the AI space. Add Snowflake for hosting; you have an excellent setup to host, test, and build AI applications. Read below how Beinex managed to run Phi-3 on Day 0 in Snowflake.
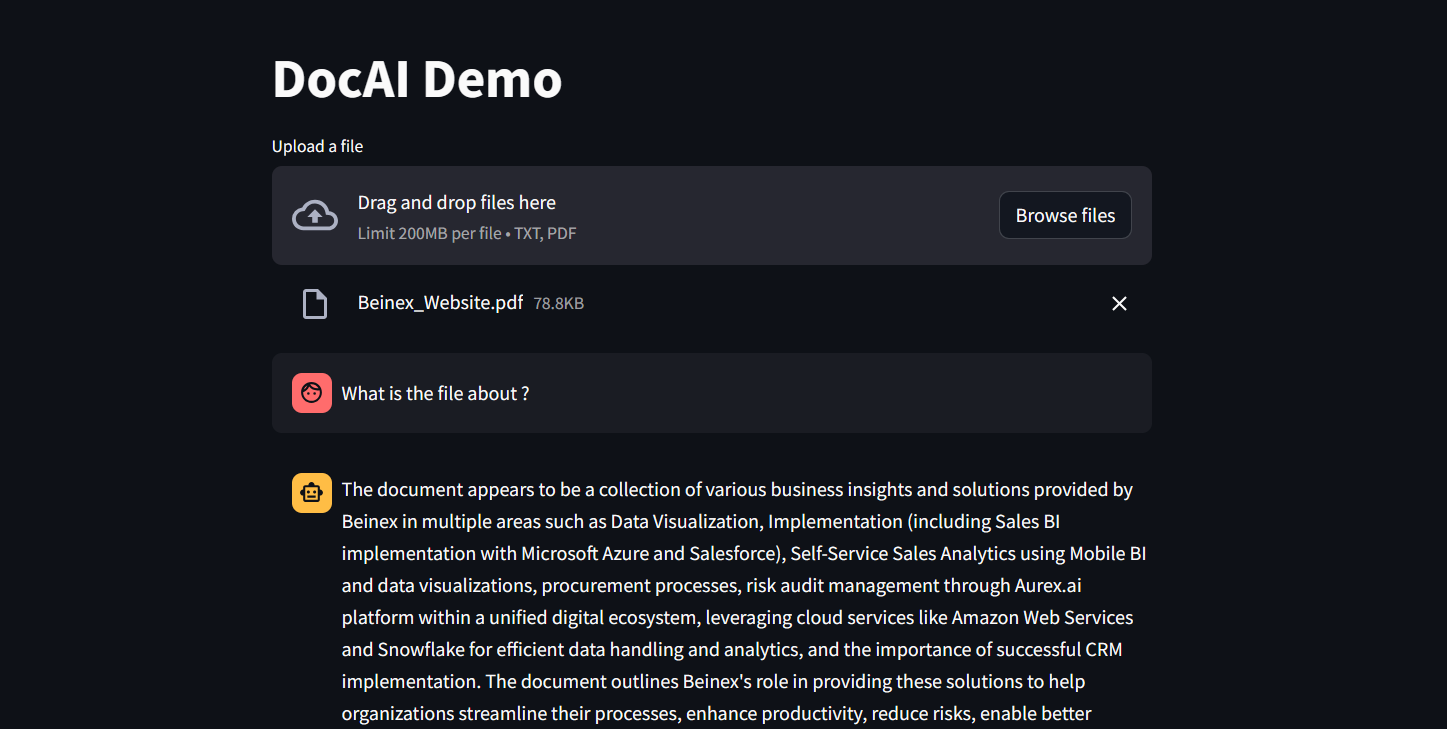 Figure 1: DocAI running on Phi-3
Implementing Phi-3 on Snowflake: What Beinex Did and How Beinex Did it?
Beinex has seamlessly integrated Phi-3 into Snowflake to help enterprises unlock their data's full potential through advanced language processing capabilities and enhance decision-making with deeper insights. The integration facilitates Snowflake users to:
Here's a detailed guide on implementing Phi-3 on Snowflake:
Step 1: Create Necessary Objects
-- Run by ACCOUNTADMIN to allow connecting to Hugging Face to download the model
-- Stage to store LLM models
CREATE STAGE <stagename> IF NOT EXISTS models
DIRECTORY = (ENABLE = TRUE)
ENCRYPTION = (TYPE='SNOWFLAKE_SSE');
-- Stage to store YAML specs
CREATE STAGE <stagename> IF NOT EXISTS specs
DIRECTORY = (ENABLE = TRUE)
ENCRYPTION = (TYPE='SNOWFLAKE_SSE');
-- Image repository
CREATE OR REPLACE IMAGE REPOSITORY images;
-- Compute pool to run containers
CREATE COMPUTE POOL GPU_NV_S
MIN_NODES = 1
MAX_NODES = 1
INSTANCE_FAMILY = GPU_NV_S;
Step 2: Docker Image Code - ollama
FROM ollama/ollama
RUN $(ollama serve > output.log 2>&1 &) && sleep 10 && ollama pull phi3 && pkill ollama && rm output.log
ENTRYPOINT ["ollama"]
CMD ["serve"]
Step 3: Tag and Push the Docker Image
docker tag ollama <SNOW_ORG-SNOW_ACCOUNT>.registry.snowflakecomputing.com/db/schema/image respository /ollama
docker push <SNOW_ORG-SNOW_ACCOUNT>.registry.snowflakecomputing.com db/schema/image repository /ollama
Step 4: Docker Image - UDF
FROM python:3.11
WORKDIR /app
ADD ./requirements.txt /app/
RUN pip install --no-cache-dir -r requirements.txt
ADD ./ /app
EXPOSE 5000
ENV FLASK_APP=app
CMD ["flask", "run", "--host=0.0.0.0"]
App.py content is given below :
from flask import Flask, request, Response, jsonify
import logging
import re
import os
from openai import OpenAI
client = OpenAI(
base_url='http://ollama:11434/v1',
api_key="EMPTY",
)
model = "phi3"
app = Flask(__name__)
app.logger.setLevel(logging.ERROR)
def extract_json_from_string(s):
logging.info(f"Extracting JSON from string: {s}")
# Use a regular expression to find a JSON-like string
matches = re.findall(r"\{[^{}]*\}", s)
if matches:
# Return the first match (assuming there's only one JSON object embedded)
return matches[0]
# Return the original string if no JSON object is found
return s
@app.route("/", methods=["POST"])
def udf():
try:
request_data: dict = request.get_json(force=True) # type: ignore
return_data = []
for index, col1 in request_data["data"]:
completion = client.chat.completions.create(
model=model,
messages=[
{
"role": "system",
"content": "You are a bot to help extract data and should give professional responses",
},
{"role": "user", "content": col1},
],
)
return_data.append(
[index, extract_json_from_string(completion.choices[0].message.content)]
)
return jsonify({"data": return_data})
except Exception as e:
app.logger.exception(e)
return jsonify(str(e)), 500
Step 6: YAML File
spec:
containers:
- name: ollama
image: <SNOW_ORG-SNOW_ACCOUNT>.registry.snowflakecomputing.com/ db/schema/image respository /Phi3
resources:
requests:
nvidia.com/gpu: 1
limits:
nvidia.com/gpu: 1
env:
NUM_GPU: 1
MAX_GPU_MEMORY: 24Gib
volumeMounts:
- name: llm-workspace
mountPath: /<stage name>
- name: udf
image: <SNOW_ORG-SNOW_ACCOUNT>.registry.snowflakecomputing.com/ db/schema/image respository /ollama_udf
endpoints:
- name: chat
port: 5000
public: false
- name: llm
port: 11434
public: false
volumes:
- name: llm-workspace
source: "@<llm stage_name>"
Step 7: Upload YAML File and Create Service
Upload the YAML file to the created stage, where the stage name in the YAML file should match the stage created in Step 2.
-- Create service
create service phi3
IN COMPUTE POOL <name of compute pool created>
FROM @dash_stage
SPECIFICATION_FILE = '<name of yaml file uploaded>';
Step 8: Create Service Function
Create a service function on the service (after it starts).
create or replace function phi3chat(prompt text)
returns text
service= phi3
endpoint=chat;
Check Service Status
Use the following command to check the status of the service:
SELECT
v.value:containerName::varchar container_name,
v.value:status::varchar status,
v.value:message::varchar message
FROM (
SELECT parse_json(system$get_service_status('<service name>'))
) t,
LATERAL FLATTEN(input => t.$1) v;
Benefits of Running Phi-3 on Snowflake
1. Cost-Effectiveness and Efficiency:
2. Compatibility with Smaller GPUs:
3. Exceptional Performance:
4. Faster Response Times:
SLM vs LLM
The choice between small and large language models hinges on organizational needs, task complexity, and resource availability.
LLMs excel in applications requiring the orchestration of intricate tasks, encompassing advanced reasoning, data analysis, and contextual comprehension.
On the other hand, SLMs present viable options for regulated industries and sectors facing scenarios necessitating top-tier results while maintaining data within their premises.
Both large and small language models possess distinct strengths and applications. While large language models thrive in managing complex workflows, small language models deliver impressive performance despite their compact size.
While some customers may exclusively require small models, others may favour larger models, with many seeking to integrate both types in various configurations. Ultimately, the optimal selection depends on the unique context and objectives of the organization. Besides transitioning from large to small models, the trend is evolving towards a diversified portfolio of models. This means that instead of relying on a single model, customers can choose from various models with different sizes, capabilities, and resource requirements. This empowers customers to decide the best model for their scenario, balancing performance and resource constraints.

Four Ways SMBs can Leverage Digital Transformation
The digital transformation uses digital technologies to transform businesses’ operations, deliver customer value, and compete in the market. For SMBs, digital transformation can provide a pathway to growth, unlocking new potential for efficiency, productivity, and innovation.
The Context and the Harvest Potential
Reports suggest that SMBs that are digitally engaged can increase their profits up to twice as fast as their offline counterparts. Digital transformation opens up new market opportunities for SMBs, driving overall growth.
Some noteworthy figures include the expected economic value of digital transformation to reach $100 trillion by 2025. While 21% of organisations believe their digital transformation efforts are complete, 87% of senior business leaders consider digitalisation a company priority, with 79% of corporate strategists indicating that it is reinventing their business and creating new revenue streams.
Moreover, 71% of leaders believe that the role of the workforce is crucial in implementing digital transformation, as employees play an essential part in driving and adopting new technologies.
How to Get Started?
To commence the digital transformation process for your SMB, you should initiate a discussion with your team regarding the concept of digital transformation and how it will impact your business. Additionally, it is crucial to consider a few points, such as:
• Identify the areas where your business is falling behind compared to your competitors.
• Determine which components of your current business plan require replacement or technological advancement.
• Evaluate the operations that are time-consuming and can be automated
Here are some key pathways in which SMBs can unlock their potential through digital transformation:
1. Embracing Cloud Computing
One fundamental way SMBs can unlock their potential through digital transformation is by embracing cloud computing. Cloud computing has become a game-changer for SMBs, providing access to powerful tools and technologies without significant upfront investment. With cloud-based solutions, SMBs can scale their operations, reduce IT costs, and gain the agility needed to compete in a fast-paced market.
Cloud computing provides SMBs access to various services, including storage, computing power, and software applications, all delivered over the Internet. Using cloud-based services, SMBs can eliminate the need for on-premise IT infrastructure, reduce maintenance costs, and free up resources to focus on core business activities.
Cloud-based solutions also offer SMBs the flexibility to scale their operations quickly and efficiently. With cloud computing, SMBs can easily adjust their IT infrastructure to meet changing business needs, whether adding new users, increasing storage capacity, or rolling out new applications.
2. Leveraging Data Analytics
Data is the lifeblood of modern businesses, and SMBs can harness the power of data analytics to gain insights into customer behaviour, market trends, and operational performance. By leveraging data analytics tools, SMBs can make more informed decisions, improve processes, and identify new growth opportunities.
Data analytics tools can help SMBs to:
• Monitor customer behaviour and preferences
• Identify trends and patterns in sales data
• Optimise pricing and inventory management
• Improve marketing effectiveness
• Enhance operational efficiency
To leverage data analytics effectively, SMBs must have the proper data management and analysis tools. This includes collecting, storing, and analysing data from various sources, such as customer relationship management (CRM) systems, sales data, and social media metrics.
3. Automating Business Processes
Automation has revolutionised how businesses operate, and SMBs can benefit from automating routine tasks and processes. Automation can help SMBs to reduce costs, increase efficiency, and improve customer satisfaction by freeing up resources to focus on higher-value activities.
Automated processes can include:
• Invoicing and billing
• Inventory management
• Payroll processing
• Customer service
• Marketing and sales
By automating these processes, SMBs can reduce errors, improve productivity, and deliver a more consistent customer experience. Automation can also free up resources to focus on more strategic initiatives, such as product development and business expansion.
4. Embracing E-commerce
E-commerce has become a vital channel for SMBs to reach customers and generate revenue. By embracing e-commerce platforms, SMBs can expand their reach, reduce overhead costs, and offer customers a convenient, digital-first experience.
E-commerce platforms provide SMBs with a range of benefits, including:
• Access to a global customer base
• Reduced overhead costs
• Increased sales and revenue
• Improved customer experience
• Flexibility and scalability
To remain competitive in the digital marketplace, SMBs must adopt online marketing strategies and cloud-based solutions for operational efficiency. Moreover, customer-centricity is the primary focus in the digital market, unlike the traditional profit-oriented approach.
Summing Up
The scope of digital transformation is vast, and there is much more to it than meets the eye. Studies show that 85% of decision-makers feel digital integration is necessary within two years or less.
As such, the future of digital transformation will feature technology at the heart of all business processes and prioritise customer satisfaction. However, there will be significant challenges regarding needing more resources and skills, which business leaders must address and mitigate.
Beinex Digital, a part of Beinex Holdings, is a digital transformation entity with a comprehensive suite of independent products that address specific business gaps, use cases, and needs. The growth strategy of Beinex Digital revolves around inducing digital transformation as a way of life for businesses worldwide.
Rather than waiting for change to happen, businesses should start acting. The question is, are you prepared to embrace digital transformation?

A Step-by-Step Guide to Predictive Analytics in Alteryx
5 Steps in Alteryx Predictive Analytics Process
The five major stages of the predictive analytics process cycle include selecting a target variable, examining the data, collecting the data, creating the model, and scoring the model.A detailed description of the steps involved in the predictive analytics process in Alteryx:
- Step 1: Select a Target Variable
- Step 2: Analyse Your Data
- Step 3: Run Calculations/ Collect New Data
- Step 4: Model Building
- Step 5: Score the Model
Step 1: Select a Target Variable
Select the target variable which is the column that should be predicted. It could be a binary or non-binary categorisation or a numerical value and it can be continuous or time-based. Each of these target variables helps in finding business solutions. But just because time is a variable in the problem does not mean that a time-based model will be the best way to solve it. Simultaneously if a field has a numeric value, it does not mean that a binary model cannot be utilised in finding insights.
Step 2: Analyse Your Data
The largest contributor to excellent predictive models is the sample size. Anything less than 5000 records is counted as under-sampled and using it is not considered the best practice.
Alteryx and Tableau Prep are both excellent tools for understanding data by creating histograms, scatterplots, and correlation matrices. Before step 3, in the data transformation procedure, it is better to know what types of variables are in the data. There are various sorts of predictor variables and several types of target variables, and each must be structured differently.
- Categorical Data: String fields with no order are categorical data. It contains data in the form of text.
- Ordinal Data: String fields with an order are ordinal data. It can be substituted into numeric order in a predictive workflow.
- Numeric Data: It represents information with a measurable value.
- Cyclical Information: Data which gets repeated as such in a cyclic process is cyclic information.
Step 3: Run Calculations/ Collect New Data
Obtaining the greatest data or inferring fields from present data, such as adding seasonality, can be a powerful predictor variable. Always be inventive in the choice of variables. It is crucial to note that if there is to infer a piece of data, it is sometimes unwise to include both that data and the original data column in the same model because the predictive model would automatically give higher weight to this column. It is also critical to recognise that while it is beneficial to include factors with correlation, variables that drown out all other variables must occasionally be removed.
Step 4: Model Building
a. Make Use of the Decision Tree
Using a Decision Tree, it is possible to rapidly discover which of the factors are the most crucial for predicting the target variable. This model will not be utilised in the final forecast since it will over-fit, but it will show whether some of the variables are overly connected to the target variable.
b. Experiment with Different Models
Data Science is complicated, and it is difficult to know which model will yield the best results, therefore a variety of models, such as Random Forest, Boosted Models, and Neural Networks can be employed for better results.
Step 5: Score the Model
Alteryx offers a scoring tool that may be used to score models. During this step, data should be withheld for the model to test and score. Even though different models can provide different scores, through testing and reconfiguring, accurate predictions can be made.
What makes Alteryx an exceptional tool for predictive analytics?
These remarkable capabilities make Alteryx an excellent tool to carry out predictive analytics tasks easily:
- • No or Low coding required
- • Predictive analytics by drag and drop
- • Predictive tool kit for specifically performing predictive analytics
- • Integration to R and Python
- • Variety of built-in and custom ML models are available
- • Model customizations are possible
- • Automation and/or scheduling of predictive analytics workflows
Predictive Analytics Tools
Predictive analytics solutions use the power of data to help businesses in identifying trends in customer behaviour, making predictions, and developing optimised marketing plans.
The tools that aid in predictive analytics are enlisted below:
- Data Investigation Tools
- Predictive Tools
- Tools for the Modern Statistical Learning Method
- Tools for Predictive Model Comparison and Hypothesis Testing
- Tool for Predicting Values for All General Predictive Modeling Tools
1. Data Investigation Tools
Data investigation tools contain tools that help to get a better understanding of data. To better understand the data used in a predictive analytics project including both visualization tools and tools that provide tables of descriptive statistics.
The list of data investigation tools is given below:
- Field Summary Tool
- Heat Plot Tool
- Histogram Tool
- Plot of Means Tool
- Scatterplot Tool
- Violin Plot Tool
2. Predictive Tools
This category contains general predictive modelling tools for classification and regression models, and also tools for predictive modelling related to model comparison and hypothesis testing.
Predictive tools are enlisted below:
- Count Regression Tool
- Gamma Regression Tool
- Linear Regression Tool
- Logistic Regression Tool
- Naïve Bayes Classifier Tool
- Neutral Network Tool
- Stepwise Tool
- Support Vector Machine Tool
3. Tools for the Modern Statistical Learning Method
- Boosted Model Tool
- Decision Tree Tool
- Forest Model Tool
- Spline Tool
4. Tools for Predictive Model Comparison and Hypothesis Testing
- Cross-Validation Tool
- Lift Chart Tool
- Model Coefficients Tool
- Model Comparison Tool
- Nested Test Tool
- Test of Means Tool
- Variance Inflation Factors Tool
5. Tool for Predicting Values for All General Predictive Modeling Tools
- Score Tool
6. Time Series Tools
- ARIMA tool
- ETS tool
- TS Compare Tool
- TS Covariate Forecast Tool
- TS Filler Tool
- TS Forecast Tool
- TS Forecast Factory Tool
- TS Model Factory Tool
- TS Plot Tool