How AI Decision-Making is Improving Enterprise Outcomes
Blog
Share 
Best AWS Services & Practices Every Data Engineer Should Master in 2025: Everything You Need in Your AWS Toolkit
 9 July 2025
  Sumi S
 1. Start with Storage Using Amazon S3
Amazon S3 is a secure and reliable storage solution when you are dealing with massive datasets. It's highly scalable, extremely durable, and serves as a foundation for most data workflows. You can depend on it from initial data landing zones to backup archives.
2. Spin Up Power with Amazon EC2
When you need raw computing power for heavy-duty tasks, such as batch processing or running data pipelines, EC2 gives you the flexibility to choose instance types suitable for your workloads. You're in control of the compute environment, which is key for tuning performance.
3. Simplify ETL with AWS Glue
Managing extract-transform-load operations can be messy. AWS Glue resolves this with automated data discovery, code generation, and job orchestration. AWS Glue can support you if you're managing multi-source ingestion and need to clean and prepare your data for use.
4. Query at Speed with Amazon Redshift
Redshift offers the easiest and quickest way to run complex queries against large volumes of structured data. It's perfect for powering dashboards, reports, and business intelligence tools without the drag of traditional databases.
5. Tackle Big Data with Amazon EMR
If your workloads involve distributed computing using Apache Spark or Hadoop, EMR helps you deploy and manage those clusters in a fraction of the time. It is ideal for advanced data transformations and machine learning (ML) workloads, as it integrates easily with other AWS services.
6. Event-Driven Logic with AWS Lambda
Forget provisioning servers to process a few files. Lambda allows you to write lightweight, trigger-based code that responds to data events. It is an efficient serverless solution for processing files as they arrive or triggering downstream processes.
7. Streamline Real-Time Data with Amazon Kinesis
Modern data doesn't always arrive in neat batches; it streams in constantly. Kinesis helps you manage this chaos by capturing, processing, and analyzing real-time data. You can utilize it for use cases such as log monitoring, clickstream analysis, and sensor data processing.
8. Store Fast & Flexible Data with DynamoDB
DynamoDB is a fully managed, serverless database ideal for workloads where speed and uptime are paramount. It provides a NoSQL solution that works best in situations where low latency is essential, such as recommendation engines or personalized content delivery.
9. Keep Your Metadata in Check: Glue Data Catalog
The Glue Data Catalog can be considered as a metadata hub that consolidates information regarding datasets, schemas, and transformations for you. It improves discoverability and governance—two things no engineer should overlook.
10. Coordinate Workflows with AWS Step Functions
As you know, data workflows can span multiple tools, services, and dependencies. AWS Step Functions help you string those steps together into one cohesive flow, complete with retries and error handling. It's a visual way to orchestrate and manage complex processes with clarity and ease.
Best Practices for Using AWS Tools as a Data Engineer
AWS tools are powerful, but knowing what to use isn’t enough; how you use them is what drives real impact. That’s where the best practices for using AWS services come in:
• Scalability: Use services that grow with your data. Enable auto-scaling in EC2, EMR, and Lambda to handle variable workloads.
• Automation: Set up Glue jobs, Lambda triggers, and Step Functions to run tasks without manual effort.
• Security: Encrypt your data (both at rest and in transit) and adhere to least-privilege access with IAM roles.
• Cost Monitoring: Use spot instances, archive old data in S3 Glacier, and monitor costs with AWS Budgets.
• Smart Workflows: Break pipelines into smaller, reusable steps. Use Step Functions for clear orchestration.
• Track & Monitor Everything: Use CloudWatch and CloudTrail to keep an eye on performance, errors, and user actions.
• Organize Metadata: Keep your Glue Data Catalog updated and use clear naming so your data is easy to find and understand.
• Test Before You Trust: Validate your data and test your pipelines with sample loads before pushing to production.
• Document as You Go: You can easily maintain notes on your workflows, data sources, and transformations for smoother teamwork.
Wrapping Up: Why These Services Matter
Tools that enable speed, flexibility, and automation are not just desirable; they're essential. AWS offers a comprehensive toolkit that covers all stages of the data lifecycle. By staying up to date with these services, you not only improve your performance at work but also position yourself to take the lead in a data-driven, cloud-first future.
For data engineers seeking to excel in their roles, it is beneficial to become proficient in at least 10 AWS services. By serving as the foundation for scalable and effective data pipelines, these services help businesses transform unstructured data into actionable insights. Data engineers can significantly contribute to fostering innovation and informed decision-making within their companies by leveraging the potential of Amazon Web Services.
In a world where data is the new currency, data engineers act as the architects of its flow, designing pipelines, transforming datasets, and enabling intelligent decision-making. As businesses scale and real-time data becomes mission-critical, mastering the best AWS services is no longer optional; it's essential. From data ingestion to transformation, storage, and analytics, AWS for developers and data engineers offers a comprehensive suite of cloud tools that AWS provides to build modern, scalable data ecosystems.
Let’s walk through the best AWS services and practices every data engineer should have in their 2025 toolkit.
Related Articles

Top 10 Game-Changing Benefits of Generative AI for Your Business
What is Generative AI
Generative AI is a subfield of Artificial Intelligence that utilizes patterns found in vast databases to produce original content, including text, images, music, and videos. GenAI aims to provide creative and human-like outputs, in contrast to classical AI, which primarily makes predictions or classifies data. Generative AI models, such as OpenAI's ChatGPT and DALL-E, utilize sophisticated neural networks, specifically transformer architecture, to produce content that is logical and sensitive.
Industries are transforming with the help of generative AI, and its benefits are innumerable. Marketers are using it to automate campaigns and generate personalized content at scale, while writers and creators rely on it to spark ideas and accelerate production. In healthcare, it's being explored for diagnostics, treatment planning, and medical research. At its core, Generative AI isn't just a tool; it's a transformative force reshaping how we create, innovate, and solve complex problems across sectors.
GenAI Solutions in the UAE
The Generative AI market in the UAE is on an impressive growth trajectory. Currently, the market is estimated to have reached USD 220 million and is expected to surpass USD 1.3 billion by 2030, growing at a CAGR of over 35%. With the UAE's commitment to becoming an AI-driven economy, including initiatives such as the UAE National AI Strategy 2031, the region is emerging as a hub for AI adoption and innovation.
Top 10 Benefits of Generative AI
Generative AI is reshaping how businesses create, operate, and innovate. Here are the top ten key benefits of GenAI that you can leverage for your business:
1. Automates Content Creation
Generative AI tools streamline content development, including blog posts, ad copy, social media content, and other types of content. Marketing teams use AI to generate drafts, brainstorm ideas, and iterate quickly. It speeds up production, improves quality through iterative feedback, and reduces the need for hiring additional staff. GenAI tools can craft landing page content or email campaigns that effectively highlight your brand's voice.
2. Delivers Hyper-Personalized Experiences
AI leverages customer and product data to generate personalized recommendations and messaging. In e-commerce, this can mean showing the right product to the right user at the right time. Personalized AI outputs enhance engagement and conversion rates.
To ensure ethical outcomes, businesses are auditing training datasets to prevent bias, which is particularly crucial in sensitive sectors such as healthcare, finance, and hiring.
3. Enhances Product Design and Innovation
AI models analyze market trends and customer behavior to guide product development. By processing vast datasets, they uncover unmet needs and help generate concepts that align with evolving consumer preferences. Many GenAI tools aid in rapid prototyping and idea testing.
4. Strengthens Cybersecurity
Generative AI boosts threat detection by identifying anomalies in network traffic and alerting teams in real time. It excels at identifying phishing patterns, malware signatures, and unusual behaviors more quickly than manual reviews. As attackers also begin using AI, this defense becomes increasingly critical.
5. Accelerates Healthcare Research
Generative AI is expediting drug discovery and diagnostics. AI also allows the generation of synthetic patient data, facilitating preclinical testing without privacy risks. It shortens development timelines and supports personalized medicine by analyzing genetic and clinical datasets. It can also predict diseases before they strike us.
Read Our AI in Healthcare Case Study on Cardiovascular Disease Prevention!
6. Streamlines Business Processes
AI automates repetitive tasks such as summarizing reports, drafting emails, or analyzing PDFs. GenAI Tools allow teams to focus on strategic work rather than data wrangling. For example, HR teams can auto-generate job descriptions, and sales teams can craft personalized follow-up emails using AI.
Book a Free Demo of Our Document Chatbot
7. Improves Customer Support
Generative AI chatbots offer 24/7 support, providing context-aware responses to resolve queries. Unlike traditional bots, these systems adapt in real time, understand tone, and escalate issues when necessary. Businesses utilize various tools to achieve faster resolution times and higher satisfaction scores.
8. Accelerates Market Innovation
By analyzing market signals, customer behavior, and industry shifts, AI uncovers opportunities for product, service, or business model innovation. It reduces risk and helps companies make data-backed decisions about where to invest. AI can forecast trends and simulate outcomes before committing resources, allowing for informed decision-making.
9. Drives Digital Transformation
AI encourages traditional industries, like oil & gas, construction, logistics, and agriculture, to adopt technology by demonstrating clear ROI. Predictive maintenance, supply chain optimization, and workflow automation are just a few areas where AI proves valuable. It helps leaders make faster, more informed decisions, accelerating digital adoption.
10. Accelerates Creative Innovation
Generative AI serves as a brainstorming partner. Designers utilize tools like Midjourney for rapid visual prototyping, while writers and product teams employ chatbots to refine their ideas. These tools provide novel starting points, enabling creators to break through mental blocks and explore new directions more quickly.
Summing Up
Beinex GenAI Solutions is at the forefront of transformation, helping organizations in the UAE explore the full potential of generative AI. As one of the recipients of the Dubai AI seal, Beinex is enabling businesses to innovate faster and operate smarter, from automating content generation to creating intelligent decision-making systems. Businesses that adopt it strategically are gaining a competitive edge, not just by saving time, but by reimagining what's possible.

Time-series Analysis in Tableau and 6 Real-world Success Stories
What is Time Series Analysis?
Time series analysis involves examining data that changes over time or where time is a variable in the outcomes. Time isn't just a data point; it's the primary axis on which the data is based.
The main difference with time series analysis is that data is collected at regular time intervals. This helps identify patterns in the data, forming trends, cycles, or seasonal variations. With a consistent time frame of historical data, time series forecasting becomes a valuable tool for predicting future data. Time's crucial role as a variable in data across industries makes time series analysis widely applicable. Explore a few examples outlined below.
6 Real-world Examples of Time Series Analysis in Various Industries
Example 1: Health Authority Enhances Patient Care
Problem: Inefficient resource use and rising costs of care and operations over time.
Solution: Utilizing data analytics, a prominent health authority conducted a comprehensive analysis of patient data. Examining historical data on patient stays, treatments, and conditions, they identified optimal times for administering medication, resulting in reduced average length of stay and cost savings for both patients and the system.
Insight: Time series analysis in healthcare extends beyond patient care to chronic disease research and epidemic-scale studies. Tracking chronic diseases over time and analyzing patient data using time series methods contribute to advancements in the field.
Example 2: Retail Giant Identifies Sales Opportunities
Problem: Slow data analysis affecting decision-making days before events.
Solution: A leading retail giant's front-office team integrated all data sources to gain a comprehensive view. Implementing time series analysis dashboards, they swiftly identified sales opportunities by forecasting against seasonal trends. Proactive measures were taken to increase ticket sales for upcoming events based on real-time insights.
Insight: Time series analysis aids retail giants in making data-driven decisions, predicting consumer trends, and strategizing marketing efforts, ensuring maximum impact.
Example 3: Manufacturing Company Improves Forecasting Accuracy
Problem: Inaccurate and time-consuming operations, manufacturing, and sales forecasting.
Solution: A manufacturing company revamped its forecasting process using time series analysis and modeling. By leveraging better data and faster analysis, they reduced analysis time from one day to one hour. Accurate forecasts in supply chain and manufacturing processes led to significant cost reductions in inventory, supply chain, labor, and capital equipment.
Insight: Time series analysis proves invaluable in optimizing forecasting models, enhancing accuracy, and streamlining operations in manufacturing.
Example 4: Marketing Analytics Scaling for Media Clients
Problem: Evolving marketing technologies making it challenging to quickly analyze information for media clients.
Solution: An analytics firm centralizes over 100 data sources using Tableau, allowing quick data retrieval and the creation of custom dashboards. Time series analysis aids in media forecasting, enabling the firm to develop insightful "what if" analyses. This empowers clients to make informed decisions about marketing investments.
Insight: Time series analysis combined with data centralization is crucial for scaling marketing analytics, providing clients with actionable insights.
Example 5: Streamlining IT Costs Through Self-Service Analytics
Problem: Business decisions based on static reports, consuming time and resources.
Solution: A retail group enables department staff with self-service analytics in Tableau, reducing IT costs by 20%. Time series analysis is applied for accurate forecasting of retail and IT trends, optimizing product orders and resource allocation.
Insight: Time series analysis aids in accurate forecasting for retail and IT trends, optimizing resource allocation, and reducing IT costs.
Example 6: Innovative Use of Data Analytics in Auditing Processes
Problem: Traditional audits were time-consuming and lacked value addition.
Solution: An organization in the energy sector used Tableau to analyze a year's worth of data, uncovering trends in financial processes. This data-driven approach revolutionized their auditing processes, providing deeper insights into the financial health of the organization.
Insight: Time series analysis proves instrumental in data-driven audits, providing a comprehensive view of historical data and uncovering trends for better decision-making.
These real-world examples showcase the versatility and impact of time series analysis across different industries, emphasizing its crucial role in data-driven decision-making and business optimization.

Why AI Safety Needs Standards: Moving Beyond Intentions in Enterprises
Enterprise AI adoption is accelerating faster than most governance frameworks can keep up. According to McKinsey’s State of AI 2025 report, 88% of organizations now use AI in at least one business function, yet only a small percentage have scaled it successfully across the enterprise. At the same time, 51% of organizations reported experiencing at least one negative AI-related consequence, including inaccuracies, compliance concerns, and explainability issues.
That gap matters. Enterprises are no longer experimenting with AI in isolated environments. AI systems are now influencing financial decisions, customer engagement, operations, and compliance workflows. In that environment, good intentions are not enough. Enterprises need measurable, repeatable, and enforceable AI governance standards.
DATA MONETIZATION USING SNOWFLAKE
Most of the companies operating today are data-driven as they have started identifying the value of data. The value of data and data marketplaces are evolving with the growth of big data and data requirements of companies.
Understand your Data Offerings - What types of data or data services are you producing that would be valuable to other organizations?
Decide How to Price Data Products - What should be the pricing strategy followed, and how easy would it be to put into action?
Know About Data Sharing Methods - Which distribution channel should be selected for data sharing that adheres to GDPR and data governance policies?
Once you have decided on the data offerings and priced the data products, the key to successfully monetize your data is by sharing the data with the clients/ prospects. The customers and business partners would be eager to get data from you, especially if you can make the process easy and secure. Traditional data sharing technologies often use FTP, Cloud Storage, or API. These methods generally do have few disadvantages.
Data Marketplace
In simple terms, these are online marketplaces where we can buy and sell data of any sort. Data marketplaces offer several kinds of data from a wide range of different data sources. These data include Business Intelligence, demographics, research, and marketing data. Data types are structured and offered to clients by data providers. Providing buyers with more choice of high-quality data generates more engagement and encourages fair pricing between the sellers. Every company has the potential to earn revenue from the information it generates. In a recent study of more than 400 organizations, only 1 in 12 were monetizing their data to its fullest extent. Modern data monetization strategies can help you open brand new revenue streams. There are 3 key steps to monetize your data and drive new revenue streams.- Storage costs for both vendors and buyers
- ETL costs and effort
- Security vulnerabilities
- Service and support costs
- Latency and potential errors leading to poor customer experience
Snowflake & Data Monetization
Snowflake is an analytic data warehouse provided as Software-as-a-Service (SaaS). It provides a data warehouse that is faster, easier to use, and far more flexible than traditional data warehouse offerings. Snowflake allows companies to easily publish a variety of data sets that become immediately available for use or purchase for clients. Snowflake Data Exchange, a modern data sharing method, reduces the time to market and significantly influences customer success. Data Exchange is your own data hub for securely collaborating around data between a selected group of members that you invite. It enables providers to publish data that can then be discovered by consumers. The benefits of Snowflake Data Exchange over Traditional Data sharing Methods are:- Secure Data Sharing
- Exchange data within your organization between different business units. Collaborate with external parties such as vendors, suppliers, partners, and customers.
- Reduce Time to Market
- Break down data silos and reduce time to market.
- Interchange data with third-party vendors to help augment internal datasets.
- Break down data silos by scaling multiple data sets from different sources within your organization.
- Find and consume data on other Data Exchanges to get business insights.
- Speed of Processing
- Snowflake’s multi-cluster shared data architecture is designed to process enormous quantities of data with maximum speed and efficiency.
- All data processing horsepower within Snowflake is performed by one or more clusters of computing resources.
- Data is cached locally within computing resources, along with the caching of query results, to improve the performance of future queries.
- Cost Benefits
- The costs for sharing data with Snowflake are minimal and straightforward.
- Simply pay for the data you store, i.e., you only pay for what you use.
- Reduce extract, transform, load (ETL), and data pipeline maintenance costs.
- Control and Govern Access
- Managing membership
- Granting and revoking access to data through standard and personalized listings
- Auditing data usage
- Applying security controls to your data
Real-life Implementation
A famous telecom organization in Europe was sitting on large silos of data that they could not monetize properly because of the complex architecture of the data warehouse operations and data security challenges involved in the data sharing process. The company has Customer Daily Records (CDR) of its subscribers that contains location data of the users. This data can be used to identify the places people visit and help with building consumer profiles. The gathered data allows advertisers to target messages to specific users while tracking whether they visited a retail store after seeing a mobile ad. This helps them plan personalized marketing strategies and business goals based on demography profiles for targeted users. However, due to the data privacy policies of the European Union like GDPR, organizations were struggling to share data with their potential clients. The GDPR policy makes it mandatory for organizations to ensure that the customer's personal information is not shared with third parties without the customer's consent and involves hefty fines and penalties for the data breach. Even the data sharing process was a source of concern as the data was often shared in text/excel files because of the different database architecture of the clients. With growing data privacy concerns and challenges in creating datasets adhering to the GDPR policies, organizations are strictly asked not to share customer data with third parties. The current system architecture forced the organizations to employ a large number of resources to extract the data from the database system and ensure that customer data is not compromised at any point. The companies were evaluating the possibilities of a potential system that would help them monetize the data they currently hold. The introduction of Snowflake into the organizational architecture solved the data monetization problem and improved the overall data culture in the organization. The unique architecture of Snowflake separates the data storage and computation layer to enhance organizational productivity. The pay as you use policy of the Snowflake and the zero maintenance of infrastructure helped the organization phase out the complex on-premise solutions required to handle the huge data volume. Easy connectivity with the existing solutions used for data analytics practice and on the fly scalability of the computation layer helped the organization increase productivity. It also paves the way for seamless integration to the organization's architecture. The Data Marketplace of Snowflake ensured secure data sharing with third parties adhering to the GDPR policies. The in-built data security policies and features minimize the role of organizations to provide data privacy as well. This enables the organizations to make only those data points visible to end-users that they seemed apt for sharing. It also ensures that the data always resides in the organizational Snowflake database rather than on third-party databases. Moreover, the organizations could reach out to thousands of potential clients through Snowflake Data Marketplace without relying on any intermediatory sources. All this ultimately brings out the scope of using the existing data to drive revenue to the organization and highlights the importance of having a complete environment like Snowflake to capture, preserve, access, and transform data. Authors: Rahul Vijayan, Firdous Maqbool
The Strategic AI Deployment: Integrating Llama 3 in the Snowflake Ecosystem
Businesses are indulging in the continuous endeavour to leverage the full potential of their data, and they are constantly seeking innovative solutions for the same. A solution capable of gaining traction is the integration of Meta Llama 3 into the Snowflake ecosystem. Beinex has brought this to fruition by establishing an innovative work model that guarantees an application that functions within Snowpark Container Services and harnesses the capabilities of Llama 3.
 Figure 1: Screenshot from DocAI. Zaki Document Chatbot (DocAI) tapping into Llama 3 by Meta and running in the Snowflake ecosystem.
Beinex tested Llama 3 on its in-house DocAI, a solution that runs on Snowflake using Snowpark Container services. The DocAI chatbot solution offers the flexibility to chat with documents such as PPT, PDF, word files, and text files. It currently uses llama3. Llama 3 is a major leap forward, establishing new standards for large language models. Its extensive training data, improved quality, and increased context length make it a powerful choice for document-related tasks, including our DocAI chatbot solution. The article will explain how Beinex deployed Llama 3 in the Snowflake ecosystem in the upcoming sections.
Recently, notable advances have been made in large language models — sophisticated natural language processing (NLP) systems equipped with billions of parameters. These models have demonstrated remarkable abilities, including generating creative text, solving complex mathematical theorems, predicting protein structures, and more. They illustrate the immense potential benefits that AI can offer to billions of people on a global scale.
Meta’s Llama (Large Language Model Meta AI), a state-of-the-art foundational large language model, is designed to support researchers in advancing their work within AI. By providing access to smaller yet highly efficient models like Llama, Meta aimed to empower researchers who may not have access to extensive infrastructure to delve into the study of these models. This democratization of access is pivotal in fostering innovation and progress in this dynamic and crucial field.
Figure 1: Screenshot from DocAI. Zaki Document Chatbot (DocAI) tapping into Llama 3 by Meta and running in the Snowflake ecosystem.
Beinex tested Llama 3 on its in-house DocAI, a solution that runs on Snowflake using Snowpark Container services. The DocAI chatbot solution offers the flexibility to chat with documents such as PPT, PDF, word files, and text files. It currently uses llama3. Llama 3 is a major leap forward, establishing new standards for large language models. Its extensive training data, improved quality, and increased context length make it a powerful choice for document-related tasks, including our DocAI chatbot solution. The article will explain how Beinex deployed Llama 3 in the Snowflake ecosystem in the upcoming sections.
Recently, notable advances have been made in large language models — sophisticated natural language processing (NLP) systems equipped with billions of parameters. These models have demonstrated remarkable abilities, including generating creative text, solving complex mathematical theorems, predicting protein structures, and more. They illustrate the immense potential benefits that AI can offer to billions of people on a global scale.
Meta’s Llama (Large Language Model Meta AI), a state-of-the-art foundational large language model, is designed to support researchers in advancing their work within AI. By providing access to smaller yet highly efficient models like Llama, Meta aimed to empower researchers who may not have access to extensive infrastructure to delve into the study of these models. This democratization of access is pivotal in fostering innovation and progress in this dynamic and crucial field.
Users can benefit from enhanced text understanding and generation
Enables more efficient and accurate data processing, analysis, and decision-making
Empowers users to interact with their data more intuitively and naturally
Drives greater productivity and insights within the Snowflake environment
Traditionally, utilizing modern LLMs at scale has necessitated reliance on proprietary services, often requiring organizations to abandon control over their data to service providers. This compromise between data residency and accessing advanced AI capabilities has been a conflict for many.
However, a solution has emerged with Beinex's innovative approach and successful Proof of Concept (PoC). Beinex has devised a model ensuring that applications function seamlessly within Snowpark Container Services while harnessing the power of Llama 3. This integration means organizations can now deploy Llama 3 directly within the Snowflake ecosystem, eliminating the need for reliance on external proprietary services.
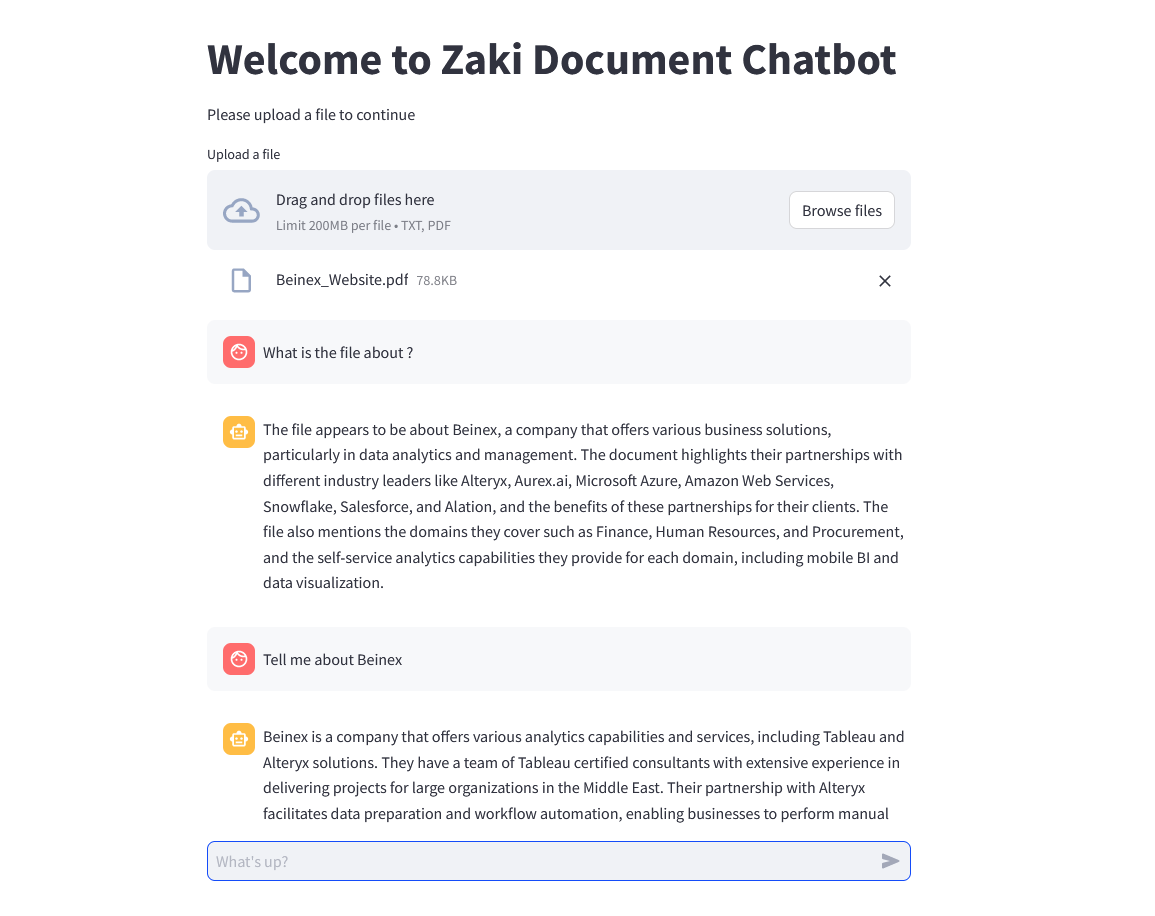 Figure 2: Zaki Document Chatbot (DocAI) in action!
Superior AI apps courtesy of Llama 3: Allows organizations to harness the full potential of this advanced LLM. Llama 3 offers avant-garde capabilities in natural language processing and generation, enabling the development of superior AI applications with enhanced performance, accuracy, and efficiency.
Data residency: Ensures that organizations maintain control over their data residency.
With Snowflake's robust data governance and compliance features and Llama 3's deployment within the same ecosystem, organizations can confidently adhere to data residency requirements and regulations, ensuring that sensitive data remains within specified jurisdictions or regions.
Scalability: Provides organizations with remarkable scalability for their AI applications.
This seamless scalability empowers organizations to handle large volumes of data and accommodate growing user demands without compromising performance.
Easy monitoring: Simplifies the monitoring and management of AI applications.
Snowflake's intuitive interface and comprehensive monitoring tools enable organizations to easily track the performance, usage, and health of their deployed Llama 3 models. It facilitates proactive identification of issues, optimization of resources, and overall better management of AI workloads, ensuring smooth and efficient operations.
By leveraging Llama 3 within Snowflake, organizations can alleviate data sovereignty and control concerns. They can rest assured that their precious and sensitive data remains within their realm of control while still being able to build and scale superior applications. This development marks a significant milestone in bridging the gap between data residency requirements and accessing the most effective LLM technology.
-Mebin Joy
Figure 1: Screenshot from DocAI. Zaki Document Chatbot (DocAI) tapping into Llama 3 by Meta and running in the Snowflake ecosystem.
Beinex tested Llama 3 on its in-house DocAI, a solution that runs on Snowflake using Snowpark Container services. The DocAI chatbot solution offers the flexibility to chat with documents such as PPT, PDF, word files, and text files. It currently uses llama3. Llama 3 is a major leap forward, establishing new standards for large language models. Its extensive training data, improved quality, and increased context length make it a powerful choice for document-related tasks, including our DocAI chatbot solution. The article will explain how Beinex deployed Llama 3 in the Snowflake ecosystem in the upcoming sections.
Recently, notable advances have been made in large language models — sophisticated natural language processing (NLP) systems equipped with billions of parameters. These models have demonstrated remarkable abilities, including generating creative text, solving complex mathematical theorems, predicting protein structures, and more. They illustrate the immense potential benefits that AI can offer to billions of people on a global scale.
Meta’s Llama (Large Language Model Meta AI), a state-of-the-art foundational large language model, is designed to support researchers in advancing their work within AI. By providing access to smaller yet highly efficient models like Llama, Meta aimed to empower researchers who may not have access to extensive infrastructure to delve into the study of these models. This democratization of access is pivotal in fostering innovation and progress in this dynamic and crucial field.
What is Llama 3?
Meta's latest advancement in the LLM (Large Language Model) series is Llama 3, the most sophisticated model with considerable advancements in performance and AI capabilities. Llama 3, built upon the architecture of Llama 2, is offered in 8B and 70B parameters, each featuring a base model and an instruction-tuned version tailored to enhance performance in specific tasks, particularly AI chatbot conversations. According to Meta, Llama 3 sets a new standard for open-source models, rivalling the performance of proprietary models available today. Llama 3 models will soon be accessible across various platforms, including AWS, Google Cloud, Hugging Face, Databricks, Kaggle, IBM Watson, Microsoft Azure, NVIDIA NIM, and Snowflake. Capabilities such as reasoning, code generation, and instruction following have seen substantial enhancements, rendering Llama 3 more adaptable and controllable. Meta plans to introduce additional capabilities, longer context windows, expanded model sizes, and enhanced performance. Utilizing Llama 3 technology, Meta AI emerges as one of the premier AI assistants globally, offering intelligence augmentation and support across various tasks, including learning, productivity, content creation, and connection facilitation.Llama 2 vs Llama 3
According to Meta, the newly introduced models, Llama 3 8B with 8 billion parameters and Llama 3 70B with 70 billion parameters, represent a significant advancement in performance compared to their predecessors, Llama 2 8B and Llama 2 70B. Meta describes these models as a ‘major leap’ in performance. Llama 2 serves research and commercial purposes, excluding the top consumer companies globally. Llama 2 boasts enhancements such as training on 40% more data, doubling the context length, and leveraging a vast dataset of human preferences to ensure safety and helpfulness, backed by over 1 million annotations. On the other hand, Llama 3 represents the next step in Meta AI's LLM evolution, catering to research and commercial applications, provided monthly active users are under 700 million. Positioned as the successor to Llama 2, Llama 3 showcases state-of-the-art performance on benchmarks and is lauded by Meta as the 'best open-source model of their class.'Ollama
There were times when accessing Large Language Models (LLMs) was restricted to cloud APIs offered by major providers like OpenAI and Anthropic. While these cloud API providers continue to dominate the market with user-friendly interfaces facilitating easy access for many users, it's important to recognize the trade-offs users make beyond the costs associated with pro plans or API usage. This trade-off involves granting providers full access to chat data. For those seeking to securely run LLMs on their hardware, the alternative has typically involved training their LLMs. Ollama, an open-source application, is designed to enable users to run, create, and share large language models locally through a command-line interface on MacOS and Linux. With Ollama, running LLMs on personal hardware requires minimal setup time. It caters to individuals seeking to run LLMs on their laptops, maintain control over their chat data without involving third-party services, and interact with models through a straightforward command-line interface. Additionally, Ollama offers various community integrations, including user interfaces and plugins for chat platforms.Deploying Llama 3 in the Snowflake Ecosystem: What Beinex Did?
Deploying Llama 3 in the Snowflake Ecosystem means integrating the advanced language capabilities of Llama 3, the latest version of Meta’s language model, into the Snowflake data platform. It represents a significant breakthrough for organizations seeking to maintain control over their data. It allows users to directly leverage Llama 3's powerful natural language processing capabilities within Snowflake for various tasks such as data analysis, querying, and generating insights.
Figure 2: Zaki Document Chatbot (DocAI) in action!
Deploying Llama 3 in the Snowflake Ecosystem: How Beinex Did it?
Here’s a detailed guide on deploying Llama 3 on Snowflake Container Services: Step 1: Create Necessary Objects -- Run by ACCOUNTADMIN to allow connecting to Hugging Face to download the model -- Stage to store LLM models CREATE STAGE <stagename> IF NOT EXISTS models DIRECTORY = (ENABLE = TRUE) ENCRYPTION = (TYPE='SNOWFLAKE_SSE'); -- Stage to store YAML specs CREATE STAGE <stagename> IF NOT EXISTS specs DIRECTORY = (ENABLE = TRUE) ENCRYPTION = (TYPE='SNOWFLAKE_SSE'); <br. -- Image repository CREATE OR REPLACE IMAGE REPOSITORY images; -- Compute pool to run containers CREATE COMPUTE POOL GPU_NV_S MIN_NODES = 1 MAX_NODES = 1 INSTANCE_FAMILY = GPU_NV_S; Step 2: Docker Image Code - ollama FROM ollama/ollama RUN $(ollama serve > output.log 2>&1 &) && sleep 10 && ollama pull llama3 && pkill ollama && rm output.log ENTRYPOINT ["ollama"] CMD ["serve"] Step 3: Tag and Push the Docker Image docker tag ollama .registry.snowflakecomputing.com/db/schema/image respository /ollama docker push .registry.snowflakecomputing.com db/schema/image repository /ollama Step 4: Docker Image - UDF FROM python:3.11 WORKDIR /app ADD ./requirements.txt /app/ RUN pip install --no-cache-dir -r requirements.txt ADD ./ /app EXPOSE 5000 ENV FLASK_APP=app CMD ["flask", "run", "--host=0.0.0.0"] App.py content is given below : from flask import Flask, request, Response, jsonify import logging import re import os from openai import OpenAI client = OpenAI( base_url='http://ollama:11434/v1', api_key="EMPTY", ) model = "llama3" app = Flask(__name__) app.logger.setLevel(logging.ERROR) def extract_json_from_string(s): logging.info(f"Extracting JSON from string: {s}") # Use a regular expression to find a JSON-like string matches = re.findall(r"\{[^{}]*\}", s) if matches: # Return the first match (assuming there's only one JSON object embedded) return matches[0] # Return the original string if no JSON object is found return s @app.route("/", methods=["POST"]) def udf(): try: request_data: dict = request.get_json(force=True) # type: ignore return_data = [] for index, col1 in request_data["data"]: completion = client.chat.completions.create( model=model, messages=[ { "role": "system", "content": "You are a bot to help extract data and should give professional responses", }, {"role": "user", "content": col1}, ], ) return_data.append( [index, extract_json_from_string(completion.choices[0].message.content)] ) return jsonify({"data": return_data}) except Exception as e: app.logger.exception(e) return jsonify(str(e)), 500 Step 6: YAML File spec: containers: - name: ollama image: <SNOW_ORG-SNOW_ACCOUNT>.registry.snowflakecomputing.com/ db/schema/image respository /llama3 resources: requests: nvidia.com/gpu: 1 limits: nvidia.com/gpu: 1 env: NUM_GPU: 1 MAX_GPU_MEMORY: 24Gib volumeMounts: - name: llm-workspace mountPath: /<stage name> - name: udf image: .registry.snowflakecomputing.com/ db/schema/image respository /ollama_udf endpoints: - name: chat port: 5000 public: false - name: llm port: 11434 public: false volumes: - name: llm-workspace source: "@<llm stage_name>" Step 7: Upload YAML File and Create Service Upload the YAML file to the created stage, where the stage name in the YAML file should match the stage created in Step 2. -- Create service create service llama3 IN COMPUTE POOL<name of compute pool created> FROM @dash_stage SPECIFICATION_FILE = '<name of yaml file uploaded>'; Step 8: Create Service Function Create a service function on the service (after it starts). create or replace function llama3(prompt text) returns text service=llama3 endpoint=chat; Check Service Status Use the following command to check the status of the service: SELECT v.value:containerName::varchar container_name, v.value:status::varchar status, v.value:message::varchar message FROM ( SELECT parse_json(system$get_service_status('<service name>')) ) t, LATERAL FLATTEN(input => t.$1) v;Benefits of Deploying Llama 3 in the Snowflake Ecosystem