How AI Decision-Making is Improving Enterprise Outcomes
Blog
Share 
Beinex Unveils Version 2 of the Cost Optimizer App on Snowflake
 12 March 2025
  Team Beinex
 What’s New in Version 2
Version 2 of the Cost Optimizer app brings a host of innovative features aimed at empowering organizations to better understand and manage their Snowflake-related costs. The highlight of this release is the introduction of Cortex Usage Insights, which provides unprecedented visibility into resource utilization and optimization opportunities.
Changelog:
• Cortex Usage Insights: This new analytics feature allows users to track and optimize Cortex resource utilization. By providing detailed insights into how Cortex services are being used, organizations can identify inefficiencies and make data-driven decisions to reduce costs without compromising performance. • Enhanced Cost Transparency: Version 2 also includes improved reporting capabilities for Cortex-related expenditures. Users can now access granular cost breakdowns, enabling them to understand exactly where their Snowflake budget is being allocated and how to optimize it further. These enhancements make the Cost Optimizer app an indispensable tool for organizations leveraging Snowflake’s advanced capabilities, particularly those utilizing Cortex services.
What is Cortex Services from Snowflake?
Snowflake Cortex is a powerful suite of services designed to simplify and accelerate AI and machine learning (ML) workflows directly within the Snowflake Data Cloud. Cortex enables organizations to harness the power of AI without the need for extensive coding or specialized expertise. Key features of Snowflake Cortex include: • AI and ML Integration: Cortex allows users to build, train, and deploy machine learning models using SQL, making AI accessible to a broader range of users. • No-Code Development: With Cortex, even non-technical users can leverage AI capabilities to derive insights and make data-driven decisions. • Advanced Analytics: Cortex provides pre-built models and functions for tasks like anomaly detection, forecasting, and sentiment analysis, enabling organizations to unlock the full potential of their data. • Cortex LLM: Snowflake Cortex LLM Functions offer businesses seamless access to industry-leading large language models (LLMs) with enhanced retrieval capabilities and improved AI safety. This update introduces support for new high-performing LLMs.
By integrating Cortex Usage Insights into the Cost Optimizer app, Beinex is helping organizations maximize the value of their Snowflake Cortex investments while keeping costs under control. The Cost Optimizer app is available on the Snowflake Marketplace, making it easy for organizations to access and deploy this powerful tool. Whether you’re looking to optimize costs, gain deeper insights into resource utilization, or enhance your Cortex-related analytics, the Cost Optimizer app is your go-to solution. Get the Cost Optimizer App on Snowflake Marketplace Version 2 of Beinex’s Cost Optimizer app represents a significant step forward in cost management and optimization for Snowflake users. With its new Cortex Usage Insights and enhanced cost transparency features, the app empowers organizations to make smarter, data-driven decisions while keeping costs in check. Explore the Cost Optimizer app on the Snowflake Marketplace today and take the first step toward unlocking the full potential of your Snowflake investment.
Revolutionizing Cost Management with Cortex Insights
Managing costs while maximizing the value of data platforms is a constant challenge for businesses today. Beinex has taken a significant leap forward with the release of Version 2 of its Cost Optimizer app on Snowflake. This latest version introduces advanced features designed to provide deeper visibility into resource consumption and cost optimization opportunities, particularly focusing on Snowflake Cortex. Let’s dive into what’s new and how it can benefit businesses.
Related Articles

Amazon CloudFront Case Study: How It Transformed the Customer Experience of Zalando, a Prominent E-commerce Platform
What is Amazon CloudFront?
Amazon CloudFront is a content delivery network offered by Amazon Web Services. It securely transfers content such as software, SDKs, and videos to clients with high transfer speeds. It helps to:
• Increase productivity while maintaining user-friendliness
• Cache your content in edge locations to reduce workload
• Provide high security through the "Content Privacy" feature.
• Utilize HTTPS protocols for fast content delivery.
• Support geo-targeting services for delivering content to specific end users.
The Amazon CloudFront solved the performance and scalability issues, providing Zalando's development teams more insight, flexibility, and control. Eventually, the shift set the stage for long-term innovation and large-scale customer happiness.
Amazon CloudFront Case Study: Challenges Faced by Zalando
In the face of rapid expansion, Zalando sought to maximize its offerings. With more than 49 million active users, Zalando links consumers with brands and goods in 25 European regions. Rich media content is integral to Zalando's website and app to enhance the online customer experience. However, the company's image management, transformation, and delivery system have limited visibility and control for developers. All these factors are crucial for sustaining growth and delivering a unique customer experience.
Zalando migrated its media management and delivery system to Amazon Web Services (AWS) by leveraging Amazon CloudFront, a content delivery network service designed for developer simplicity, security, and high performance. Using CloudFront, Zalando enhanced developer observability, scalability, and online purchasing experiences.
Strengthening Developer Ownership to Promote Development
Due to substantial expansion, Zalando outgrew its prior image management system, which provided its engineering and product teams with few configuration options. Furthermore, few operational insights were available, making it difficult to see how well the service was doing and what improvements could be made. It affected Zalando's capacity to modify and enhance its online stores. Delivering a consistent client experience during high-demand seasonal events was made difficult by the absence of comprehensive reporting regarding image transformation.
To overcome these obstacles and to develop their new media management system, the Zalando team used Amazon CloudFront. Because of its programmability and flexibility, Amazon CloudFront became crucial for scaling operations and keeping up with rising client demand.
Migrating to AWS Edge
Zalando executed its migration quickly and effectively. The company coordinated its migration schedule with AWS's Enterprise Support, Service Specialists, and Service Teams to avoid conflicts with customer campaigns and market events. Small client groups were used in the initial stages of the conversion so that the business could identify any areas for improvement without significantly impacting Zalando customers. During this procedure, Zalando moved more than 20 websites and apps, totaling 26.93 PB of data. CloudFront's peak load has consistently surpassed 100,000 requests per second.
The development team enhanced the image-delivery method using Zalando's prelaunch hands-on access to CloudFront Functions. The team was pleased to receive support on several levels throughout several stages. Regular contact began very early on, while they looked for proofs of concept and sent the code to verify its legitimacy and identify any obstacles.
Zalando started using CloudFront Functions in production in May 2021. Smooth configuration is a significant change with CloudFront Functions. On an operational level and for daily development, it makes it easier to deploy and reliably revert tasks and scale on demand. Zalando swiftly overcame challenges by implementing the new solution across its online domains. Zalando needed to be able to roll back quickly when necessary, making changes before actual downtime could happen. For various use cases, Zalando now employs both Lambda@Edge and CloudFront Functions. Multiple layers of edge computing give developers greater flexibility, visibility, and control while improving the client experience. It enabled Zalando to respond quickly and provide better consumer and business services.
Since the move, Zalando has been attaining cache hit percentages of 99.5 percent, and its new image-delivery system serves almost five billion images daily. They didn't face any challenges with Amazon CloudFront. With about 250 million online orders after the transformation, Zalando's CloudFront solution's size and effectiveness were crucial in providing a first-rate consumer experience.
Additional optimizations made by Zalando have resulted in a threefold decrease in requests for nonoptimized photos on the home screens of the company's online and mobile applications. Because of its improved efficiency and versatility, teams within Zalando have shifted to utilize the pipeline built on CloudFront for additional kinds of material.
Fostering Client Interaction
Using AWS, Zalando intends to keep innovating in managing and manipulating rich media assets. By developing an interactive e-commerce solution with AWS Elemental MediaConvert, a file-based video converting service with broadcast-grade features, it intends to promote consumer interaction. To better serve its clients, Zalando moved to CloudFront to enhance the media management and delivery systems that influence the shopping experience. Zalando could carry out a seamless move with the help of the AWS team, which had significant advantages. The business benefits of using Amazon CloudFront are the operational flexibility and the ability to monitor the health of the solution, experiment, and reverse changes quickly.
Summing Up
Zalando's decision to strategically switch to Amazon CloudFront was a watershed moment in its quest to provide a better, more scalable consumer experience. By tackling important issues with media delivery, performance, and developer control, Zalando increased operational efficiency and enhanced the user experience across all platforms. This success story illustrates how intelligent content delivery systems can enhance long-term value, performance, and customer satisfaction in digital commerce as the company grows and changes.
Making your Business Smart and Sustainable for the digital age A Guide for Thought Leaders
The road to sustainability
Reducing your IT footprint requires a multi-pronged approach. Here are some key steps: 1. Energy Efficiency: • Optimize Data Centers: Virtualization and cloud computing can significantly reduce the number of physical servers needed. Implementing efficient cooling systems, such as liquid cooling, can minimize energy consumption. Continuously monitor and improve Power Usage Effectiveness (PUE) to track and enhance energy efficiency. • Focus on Hardware and Software: Invest in energy-efficient devices like laptops, servers, and networking equipment. Optimize software for reduced energy consumption and implement robust standby power management features. • Embrace Renewable Energy: Explore the use of solar, wind, or hydro power to power data centers and office spaces. 2. E-waste Reduction: • Responsible Disposal: Establish proper e-waste recycling programs that ensure data security during device disposal. Partner with certified e-waste recyclers who adhere to responsible and environmentally sound practices. • Extend Product Life Cycles: Implement repair and refurbishment programs to extend the lifespan of IT equipment. Encourage modular designs that allow for easier upgrades and repairs, reducing the need for complete replacements. 3. Sustainable Procurement: • Prioritize Sustainability in Vendor Selection: Choose vendors with strong sustainability commitments, such as those that utilize renewable energy, minimize waste, and prioritize ethical sourcing. • Source Materials Responsibly: Favor materials like recycled plastics and metals and ensure that minerals used in electronics are sourced ethically and responsibly. • Evaluate the Entire Supply Chain: Assess the environmental impact of the entire IT supply chain, from manufacturing to transportation and disposal.New Trends in Sustainability
The landscape of sustainable IT is constantly evolving. Here are some key emerging trends: • Circular Economy Principles: Embrace a circular economy model by minimizing waste through reuse, repair, and recycling. Design products with end-of-life considerations, ensuring that components can be easily recovered and reused. Create closed-loop systems for IT components, where materials are recovered and remanufactured into new products. • AI and Machine Learning for Sustainability: Leverage AI and machine learning to optimize energy consumption in data centers through predictive maintenance. Utilize AI-powered resource management systems to optimize cooling, power distribution, and space utilization. Explore AI-driven solutions to address environmental challenges, such as developing more efficient renewable energy technologies. • Edge Computing and Sustainability: Edge computing, where data processing occurs closer to the source, can significantly reduce data transmission distances and latency. This can lead to reduced energy consumption associated with data transfer and improve energy efficiency by enabling localized renewable energy solutions.How Sustainability is Changing the Business Landscape
Sustainability is no longer just a "nice-to-have"; it's becoming a critical factor for business success: • Competitive Advantage: Companies with strong sustainability practices can attract environmentally conscious customers, enhance brand reputation, and build stronger customer loyalty. Sustainable practices can differentiate businesses in the marketplace and give them a competitive edge. • Regulatory Compliance: Increasingly stringent environmental regulations are driving businesses to adopt sustainable practices. Non-compliance can result in fines, penalties, and damage to brand reputation. • Investor Pressure: Investors are increasingly prioritizing Environmental, Social, and Governance (ESG) factors in their investment decisions. Companies with strong sustainability records are more likely to attract investment and access sustainable finance options.Impact of These Factors
By embracing sustainable IT practices, businesses can: • Reduce Environmental Impact: Lower carbon emissions, reduce energy consumption, and minimize e-waste, contributing to a healthier planet. • Achieve Cost Savings: Reduce energy costs, increase equipment lifespan, and improve resource utilization, leading to significant cost savings. • Drive Innovation and Job Creation: Foster innovation in sustainable technologies and create new job opportunities in the green IT sector. Embracing sustainability in IT is not just an environmental responsibility; it's a strategic imperative for businesses. By implementing the steps outlined above and aligning with emerging trends, businesses can not only reduce their environmental impact but also gain a significant competitive advantage in the evolving market. The future of IT lies in sustainability, and those who embrace it will be best positioned for success.
DATA MONETIZATION USING SNOWFLAKE
Most of the companies operating today are data-driven as they have started identifying the value of data. The value of data and data marketplaces are evolving with the growth of big data and data requirements of companies.
Understand your Data Offerings - What types of data or data services are you producing that would be valuable to other organizations?
Decide How to Price Data Products - What should be the pricing strategy followed, and how easy would it be to put into action?
Know About Data Sharing Methods - Which distribution channel should be selected for data sharing that adheres to GDPR and data governance policies?
Once you have decided on the data offerings and priced the data products, the key to successfully monetize your data is by sharing the data with the clients/ prospects. The customers and business partners would be eager to get data from you, especially if you can make the process easy and secure. Traditional data sharing technologies often use FTP, Cloud Storage, or API. These methods generally do have few disadvantages.
Data Marketplace
In simple terms, these are online marketplaces where we can buy and sell data of any sort. Data marketplaces offer several kinds of data from a wide range of different data sources. These data include Business Intelligence, demographics, research, and marketing data. Data types are structured and offered to clients by data providers. Providing buyers with more choice of high-quality data generates more engagement and encourages fair pricing between the sellers. Every company has the potential to earn revenue from the information it generates. In a recent study of more than 400 organizations, only 1 in 12 were monetizing their data to its fullest extent. Modern data monetization strategies can help you open brand new revenue streams. There are 3 key steps to monetize your data and drive new revenue streams.- Storage costs for both vendors and buyers
- ETL costs and effort
- Security vulnerabilities
- Service and support costs
- Latency and potential errors leading to poor customer experience
Snowflake & Data Monetization
Snowflake is an analytic data warehouse provided as Software-as-a-Service (SaaS). It provides a data warehouse that is faster, easier to use, and far more flexible than traditional data warehouse offerings. Snowflake allows companies to easily publish a variety of data sets that become immediately available for use or purchase for clients. Snowflake Data Exchange, a modern data sharing method, reduces the time to market and significantly influences customer success. Data Exchange is your own data hub for securely collaborating around data between a selected group of members that you invite. It enables providers to publish data that can then be discovered by consumers. The benefits of Snowflake Data Exchange over Traditional Data sharing Methods are:- Secure Data Sharing
- Exchange data within your organization between different business units. Collaborate with external parties such as vendors, suppliers, partners, and customers.
- Reduce Time to Market
- Break down data silos and reduce time to market.
- Interchange data with third-party vendors to help augment internal datasets.
- Break down data silos by scaling multiple data sets from different sources within your organization.
- Find and consume data on other Data Exchanges to get business insights.
- Speed of Processing
- Snowflake’s multi-cluster shared data architecture is designed to process enormous quantities of data with maximum speed and efficiency.
- All data processing horsepower within Snowflake is performed by one or more clusters of computing resources.
- Data is cached locally within computing resources, along with the caching of query results, to improve the performance of future queries.
- Cost Benefits
- The costs for sharing data with Snowflake are minimal and straightforward.
- Simply pay for the data you store, i.e., you only pay for what you use.
- Reduce extract, transform, load (ETL), and data pipeline maintenance costs.
- Control and Govern Access
- Managing membership
- Granting and revoking access to data through standard and personalized listings
- Auditing data usage
- Applying security controls to your data
Real-life Implementation
A famous telecom organization in Europe was sitting on large silos of data that they could not monetize properly because of the complex architecture of the data warehouse operations and data security challenges involved in the data sharing process. The company has Customer Daily Records (CDR) of its subscribers that contains location data of the users. This data can be used to identify the places people visit and help with building consumer profiles. The gathered data allows advertisers to target messages to specific users while tracking whether they visited a retail store after seeing a mobile ad. This helps them plan personalized marketing strategies and business goals based on demography profiles for targeted users. However, due to the data privacy policies of the European Union like GDPR, organizations were struggling to share data with their potential clients. The GDPR policy makes it mandatory for organizations to ensure that the customer's personal information is not shared with third parties without the customer's consent and involves hefty fines and penalties for the data breach. Even the data sharing process was a source of concern as the data was often shared in text/excel files because of the different database architecture of the clients. With growing data privacy concerns and challenges in creating datasets adhering to the GDPR policies, organizations are strictly asked not to share customer data with third parties. The current system architecture forced the organizations to employ a large number of resources to extract the data from the database system and ensure that customer data is not compromised at any point. The companies were evaluating the possibilities of a potential system that would help them monetize the data they currently hold. The introduction of Snowflake into the organizational architecture solved the data monetization problem and improved the overall data culture in the organization. The unique architecture of Snowflake separates the data storage and computation layer to enhance organizational productivity. The pay as you use policy of the Snowflake and the zero maintenance of infrastructure helped the organization phase out the complex on-premise solutions required to handle the huge data volume. Easy connectivity with the existing solutions used for data analytics practice and on the fly scalability of the computation layer helped the organization increase productivity. It also paves the way for seamless integration to the organization's architecture. The Data Marketplace of Snowflake ensured secure data sharing with third parties adhering to the GDPR policies. The in-built data security policies and features minimize the role of organizations to provide data privacy as well. This enables the organizations to make only those data points visible to end-users that they seemed apt for sharing. It also ensures that the data always resides in the organizational Snowflake database rather than on third-party databases. Moreover, the organizations could reach out to thousands of potential clients through Snowflake Data Marketplace without relying on any intermediatory sources. All this ultimately brings out the scope of using the existing data to drive revenue to the organization and highlights the importance of having a complete environment like Snowflake to capture, preserve, access, and transform data. Authors: Rahul Vijayan, Firdous Maqbool
Agriculture and the Internet of Things: The Present and the Future
. A farmer must be knowledgeable about soil, climate, and market. If something goes wrong with any of these areas the result will be devastating. This is where one of mankind’s biggest inventions, the Internet, offers the most reliable assistance. The Internet of Things has a plethora of devices that can make the work of a farmer far easier and more productive.
Smart Sensors
Smart sensors are the number one in a huge list of IoT devices being used in agriculture. These devices can be used to gather data about various aspects of agriculture like the humidity, acidity or mineral contents of the soil. Earlier these kinds of knowledge were something that farmers were supposed to gain after many years of experiences of both gain and loss. Or they had to depend on time taking and distant laboratories. But even a lab test had a limited chance of being hundred percent accurate as the soil’s quality could change in the blink of an eye. Smart sensors can provide the farmer with accurate data in real time. The data collected can precisely calculate and predict many changing or evolving aspects like the humidity content of the soil. These data can help decide:
- The crops to be planted
- The manures to be used
- The amount and timing of watering
- The market price for the final product
Drones
Next in the line is the use of drones. These can be used to:
- Observe vast areas and collect important information that can help decide the most efficient methods of cultivation.
- Provide the farmer with a bird’s eye view, thereby reducing the time and effort wasted in surveying the land personally.
- Assist in remote application of pesticides and herbicides.
- Track the cattle or scrutinize their health.
The data collected by sensors and drones can be used to create a plan through which the farmers can guarantee a good output with minimum input and loss. This will reduce a great percentage of both financial and manual investment. Besides, instead of depending on one’s gut feelings, a farmer can take a multitude of important decisions with scientifically backed technology. IoT devices can be easily operated by the farmers by connecting it to a laptop or mobile phone. There are various apps that are already very popular for providing agricultural data. There are also various government backed projects aimed at collection of data, providing online solutions and even arranging financial support for the smart framer.
Smart Greenhouses
Another IoT contribution is Smart Greenhouses. Greenhouses always contain plants which are out of their natural habitat and therefore need extra care. IoT enabled greenhouses can help:
- Monitor the procedures of watering
- Adjust the humidity inside
- Analyse and provide proper lighting
- Ensure proper balance in delicate matters like the level of carbon dioxide, temperature, etc.
- In disease control by providing a close watch on all the plants’ vitals.
Such precise and high level of attention makes sure that there is no contamination in the greenhouse environment that could lead to spread of diseases. It can also help in detection or prevention of theft, which is a big risk especially if the plants are of rare or protected species.
Livestock Management
IoT in livestock management is bringing about revolutionary changes. With the spread of COVID-19, it is now a very crucial requirement that the livestock are healthy throughout their life. Even a small disease in the animal could turn out to be dangerous for the human who finally consumes it. Also spread of diseases in small animals like poultry can lead to devastatingly large loss for the farmer. Smart devices can help:
- Track the vitals of each animal or bird through devices which are wearable.
- Alert the farmer of even slight variations in the vitals via SMS, notifications, etc.
- Administer medicines at the correct time, to any number of animals without having to keep manual tabs
All these crucial routines help in keeping diseases in check and thus reduce livestock loss.
There are many more IoT powered devices that are revolutionizing the field of livestock management like Geo-tagging and Geo-fencing.
- Geo-tagging: It is used to locate the cattle that has strayed away from the herd or gone missing. Geo-tags are especially useful in case of natural calamities like flood, tsunami, landslide, etc. For example, the farmers of Kerala in South India used geo-tags to locate their animals that had either gone missing or died in the flood of 2018.
- Geo-fencing: It is another popular method and it uses GPS to monitor and keep the cattle within a boundary without actual fencing. This can help in detecting cattle theft or even wild animal attacks on the livestock.
The Limitations and Solutions
IoT is already here to stay in the fields of agriculture, and there is more to come. But like anything else IoT in agriculture has certain cons. These limitations can thankfully be eliminated.
| Limitations | Solutions |
|---|---|
| The data that is being collected by the various devices is stored on cloud. So the farmers are required to have a basic know-how of data analyzing and even device maintenance. |
|
| IoT devices need a lot of investment and the farmers might find it difficult to find funds for them. |
|
| Another area that requires improvement is the availability of fast internet connectivity. Internet is still something expensive or even unavailable in many parts of the world. There are places too remote to have net access. | These limitations are being dealt with and hopefully can be improved with the help of technologies like space-based internet systems. |
The Future
The agriculture IoT market is estimated to grow from USD 11.4 billion in 2021 to USD 18.1 billion by 2026 at a CAGR of 9.8% during 2021-2026, as per ResearchAndMarkets.com.
A few insights can be:
- Precision Aquaculture: The agriculture IoT market for the precision aquaculture application segment is projected to register the higher CAGR during the forecast period, by application. Increasing demand for real-time tracking of fishing activity is the major reason behind the high growth of the agriculture IoT market in aquaculture farm monitoring applications.
- Production Planning: The production planning stage segment of the agriculture IoT market is estimated to register the largest market share in 2026, by the farm production planning stage.
- Small Farm Segment: The agriculture IoT market for small farm segment is projected to register the higher CAGR during the forecast period, by farm size. Small farms are expected to adopt automation and other advanced technologies at the highest rate in the coming years due to the reducing cost of farm automation equipment and advancements in technology that make it more feasible to deploy automation tools even on smaller farms to achieve high returns on investments.
- Automation & Control Systems: The automation and control systems for the precision farming hardware segment of the agriculture IoT market is estimated to register the largest market share in 2026, by hardware type. The increasing demand for drones/unmanned aerial vehicles (UAVs) is a major reason behind the high growth of the market for automation and control systems.
APAC is likely to be the fastest-growing agriculture IoT market during the forecast period. Agriculture IoT techniques are expected to be adopted at a high rate in the region. This region consists of emerging countries such as India, China, and countries in Southeast Asia. Rapidly growing population, availability of arable land, and strong government support for farmers through subsidies in these regions are the major factors driving the adoption of agriculture IoT technologies in APAC.
These projections show that IoT based agriculture is here to make a big splash and is a boon of science.

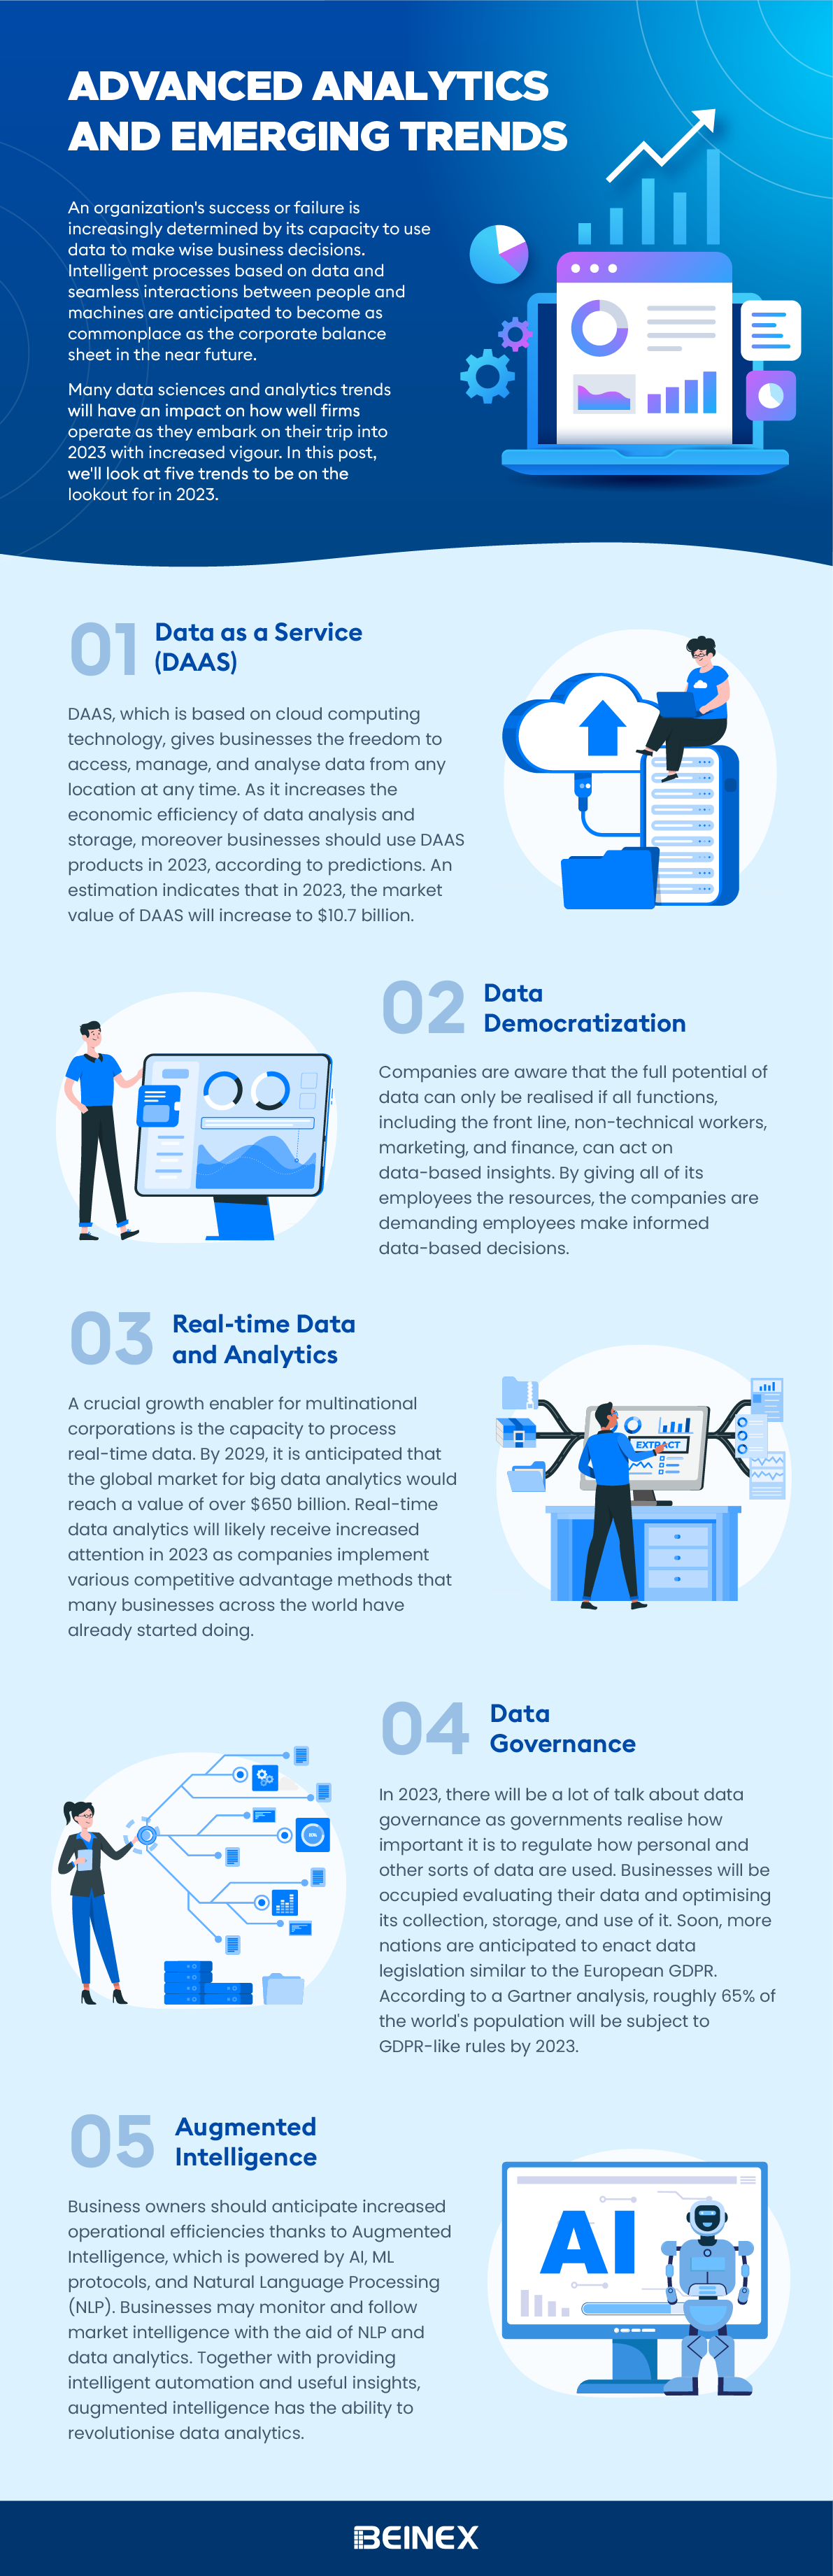
Advanced Analytics and Emerging Trends(Infographic)