How AI Decision-Making is Improving Enterprise Outcomes
Blog
Share 
Beinex Successfully Attains Alteryx Preferred Partner Status
 12 April 2021
  Admin
Admin We are delighted to achieve this award with our relentless dedication and unparalleled expertise on the Alteryx platform. With ample product knowledge, technical expertise, and sufficient focus on customer satisfaction, we were able to demonstrate the value that we offer as a partner. Our determination and dedication aided in supplementing our customers with the power to deliver faster and better business outcomes by intelligent decisioning using Alteryx.
 Last year, we were fortunate enough to successfully transform the majority of our clients’ businesses with Analytic Process Automation by quickly automating analytics and the entire data-driven business processes, resulting in quick wins and faster returns on ROI. We were also awarded with Alteryx 2020 Partner of the Year award, Middle East.
With the preferred partner status, we will be able to make even greater collaboration with the Alteryx team, helping us extract its possibilities to the next level.
Alteryx always stands for developing data-driven technical solutions to business problems by empowering its clients to be self-sufficient in handling data analytics and continues to provide unmatched services, like;
Last year, we were fortunate enough to successfully transform the majority of our clients’ businesses with Analytic Process Automation by quickly automating analytics and the entire data-driven business processes, resulting in quick wins and faster returns on ROI. We were also awarded with Alteryx 2020 Partner of the Year award, Middle East.
With the preferred partner status, we will be able to make even greater collaboration with the Alteryx team, helping us extract its possibilities to the next level.
Alteryx always stands for developing data-driven technical solutions to business problems by empowering its clients to be self-sufficient in handling data analytics and continues to provide unmatched services, like;
Last year, we were fortunate enough to successfully transform the majority of our clients’ businesses with Analytic Process Automation by quickly automating analytics and the entire data-driven business processes, resulting in quick wins and faster returns on ROI. We were also awarded with Alteryx 2020 Partner of the Year award, Middle East.
With the preferred partner status, we will be able to make even greater collaboration with the Alteryx team, helping us extract its possibilities to the next level.
Alteryx always stands for developing data-driven technical solutions to business problems by empowering its clients to be self-sufficient in handling data analytics and continues to provide unmatched services, like;
-
- Collecting data from multiple sources for quick analysis and faster insight generation.
- Exploration of data from on-prem databases, the cloud, and big or small data sets, and more.
- Analysis with maps, addressing solutions to deeply understand your customers and locations.
- Augmenting your team’s analytic output to gain insights by using data without any coding or analytics expertise.
- Embracing automation to effectively communicate with your stakeholders and enable intelligent decision-making to drive better, faster business outcomes.
We are privileged and grateful to announce that Beinex has achieved Alteryx Preferred Partner status for the year 2021! We are proud to share our immense happiness and gratitude with our reputable customers who have helped us reach this status.
Related Articles

Moving Beyond RPA: Building a Unified Intelligent Automation Platform for GCC Markets
Enterprises across the Gulf Cooperation Council (GCC) have deployed RPA widely across finance, HR, and IT, yet many still struggle to scale past a certain threshold: cycle times plateau, governance gaps widen, and headcount continues to grow alongside automation spend. The path forward isn't more bots. It's a unified platform.
As enterprises move toward AI-driven operating models, automation is being measured not by the number of bots deployed, but by the ability to orchestrate processes, data, decisions, and human interactions at scale. This shift is driving the move from standalone RPA implementations toward intelligent automation platforms that integrate AI, workflow orchestration, analytics, and governance capabilities.

Snowflake for Optimizing Big Data Workloads
The Snowflake data platform is built for efficiency, scalability, and ease of use. It supports unlimited Virtual Data Warehouse clusters, enabling real-time data sharing for optimal performance. Designed with simplicity, Snowflake requires minimal management or tuning and offers limited performance tuning options. The blog gives you a walkthrough of optimizing big data workloads with Snowflake and making the most of the platform to enhance performance.
Understanding Big Data
Big data is an immensely large and diverse dataset, with structured, semi-structured, and unstructured data that expands exponentially over time. Technological advances like AI, IoT, etc., stimulate the rapid proliferation of big data. Given their increasing volume, velocity, and variety, traditional data systems can't store, process, and analyze big data. In 2021, Gartner used volume, velocity, and variety to define the attributes of big data. Volume: It indicates the high volume of big data gathered from diverse sources continuously. Velocity: It is the speed at which data is collected and needs to be processed and analyzed. Variety: It refers to the diverse nature of data (structured, unstructured, and semi-structured) collected from various sources. In addition, big data can also be defined by the following: Veracity: It is about the accuracy and quality of big data, implying the potential of data to be inconsistent, unreliable, and error-prone. Variability: It indicates the inconsistency and fluctuations in data over time. Value: It is about the relevance and usefulness of the data you collect to add value to your business. However, platforms like Snowflake, AWS, and Google Cloud help businesses manage big data at a rate needed to leverage its power. The application of big data extends to advanced analytics, predictive modeling, and machine learning, enabling businesses to make informed decisions.The Benefits of Big Data
• Facilitates informed and strategic decisions by discovering patterns and insights from analyzing big data. • Helps mitigate risks better and easily with actionable insights from analyzing voluminous data • Boosts customer experiences by deriving useful insights from diverse data, enabling the comprehension, personalization, and optimization of user experience. • Gives businesses a competitive edge and enhances agility by analyzing data in real-time and expediting the further processes with data-driven insights. • Boosts efficiency by employing big data analytical tools that generate faster insights and assist in saving costs and time. • Integrates automated, real-time data streaming with advanced data analytics to continuously gather data, discover new insights and growth opportunities.Optimizing Big Data Workloads with Snowflake
Snowflake, a cloud-based data warehousing platform, offers scalable and flexible solutions for big data workloads. Here are some of the ways in which Snowflake optimizes performance when managing big data workloads. Warehouse Scaling: By configuring several warehouses based on file size and employing auto-scale capabilities, Snowflake can help stop timeouts and boost processing speed. Snowflake provides flexible scaling options (scale up and scale out) to fit your escalating data requirements. Scaling up refers to expanding the warehouse size to manage more workloads and is ideal for data workloads needing more resources. Scaling out is about adding more warehouses to enhance capacity by distributing workloads, and it is better suited to handle multiple workloads simultaneously. Snowflake also offers a warehouse of various sizes, organized into T-shirt sizes (X-Small, Small, Medium, Large, X-Large, 2X-Large, 3X-Large, 4X-Large, 5X-Large, and 6X-Large). The range of sizes makes choosing the right warehouse for your needs seamless and allows you to scale up or down as required. Besides, Snowflake's architecture enables you to decouple storage and compute resources, that is, scale your compute and storage independently while lowering costs and optimizing performance and resource utilization. Storage Optimization: The columnar storage engine of Snowflake helps optimize storage by reducing storage costs and enhancing query performance. Besides, leveraging Snowflake's automatic compression lowers storage costs and improves data transfer times. Micro-partitions are also important, allowing for efficient storage and querying of large datasets. The storage optimization faculty of Snowflake offers a powerful and flexible foundation for efficiently managing diverse data, including structured data, semi-structured data, and unstructured. It also ensures your data is accessible and never becomes a bottleneck. Snowflake has redundant data storage; it stores multiple data copies across various servers and locations, ensuring multiple workloads can run concurrently without resource contention, and your data is always available. Query Optimization: Snowflake's query acceleration features, like query result caching and materialized views, can be harnessed to boost query performance greatly. Materialized views store data physically and precompute complex queries, boosting performance. What makes it different from the traditional views is that it offers the capability to precompute data based on materialized view queries, expediting and streamlining access to complicated data. The automation and the routine refresh capabilities ensure the data is updated, eliminating the need for manual intervention. Snowflake's materialized views offer granular control over data management and scalability, simplifying the process and enhancing flexibility compared to the traditional materialized views. Also, queries can be optimized by utilizing efficient query patterns and specifying only the columns required. Techniques like Common Table Expressions help optimize joins and subqueries. Query performance can also be optimized by filtering data early, lowering operation counts, preventing unnecessary sorts, and using window functions. Data Loading Optimization: Snowflake's bulk loading capabilities, like Snowpipe and COPY INTO, enable the efficient loading of extensive datasets, optimizing data loading. Snowflake Functions and Snowflake Tasks, the transformation and processing faculties of Snowflake, run data processing and transformation during loading. Snowpipe offers scalable and serverless architecture and facilitates real-time data ingestion, processing, and integration with platforms like Kafka. With Snowpipe, you can stream data into Snowflake in real time, enabling immediate analysis and decision-making. Dynamic Tables and Streams: Dynamic Tables and Streams in Snowflake facilitate real-time data processing and analysis. Dynamic Tables make storing and managing structured and semi-structured data flexible and scalable. Streams enable real-time data ingestion and processing. By incorporating these features, Snowflake allows users to capture, process, and analyze changing data effortlessly, assisting in real-time analytics, IoT data processing, and machine learning. Resource Optimization: Right-sizing your warehouse optimizes resources by preventing over-provisioning or under-provisioning resources, ensuring the resources are sized right for the data workload. Snowflake's auto-suspend and auto-scaling features adjust warehouse size automatically based on the demand. Monitoring and optimizing resource usage by tracking resource utilization and optimizing data workload results in enhanced performance and cost efficiency. Search Optimization in Snowflake: Snowflake Search Optimization is a robust query optimization service that helps boost the performance of specific lookup and analytical queries that retrieve small subsets of data from large datasets. When enabled on a table, the search optimization service generates a Search Access Path, an additional dataset that tracks the micro-partitions where table values are stored. This mechanism significantly enhances query efficiency by minimizing the number of partitions scanned during table operations, eliminating the need to search through all partitions. Data Partitioning: To access relevant data quickly and decrease the volume of data analyzed during queries, data can be segmented based on specific criteria or keys. Managing big data workloads and large datasets in Snowflake comes with a few challenges, such as issues in query performance and data loading delays. However, effective strategies like employing Snowpipe for efficient data loading, advanced SQL techniques, and warehouse configuration for improved query performance help overcome the challenges. The advantages of using Snowflake for big data workloads include: • Seamless scaling to manage voluminous data • Attaining faster query performance and real-time insights • Streamlining data management and lowering administrative burdens • Facilitating data democratization and self-service analyticssea • Foster business growth and competitive edge through data-driven decisions. By leveraging Snowflake, businesses can optimize their big data workloads and achieve greater scalability, performance, and cost-efficiency.
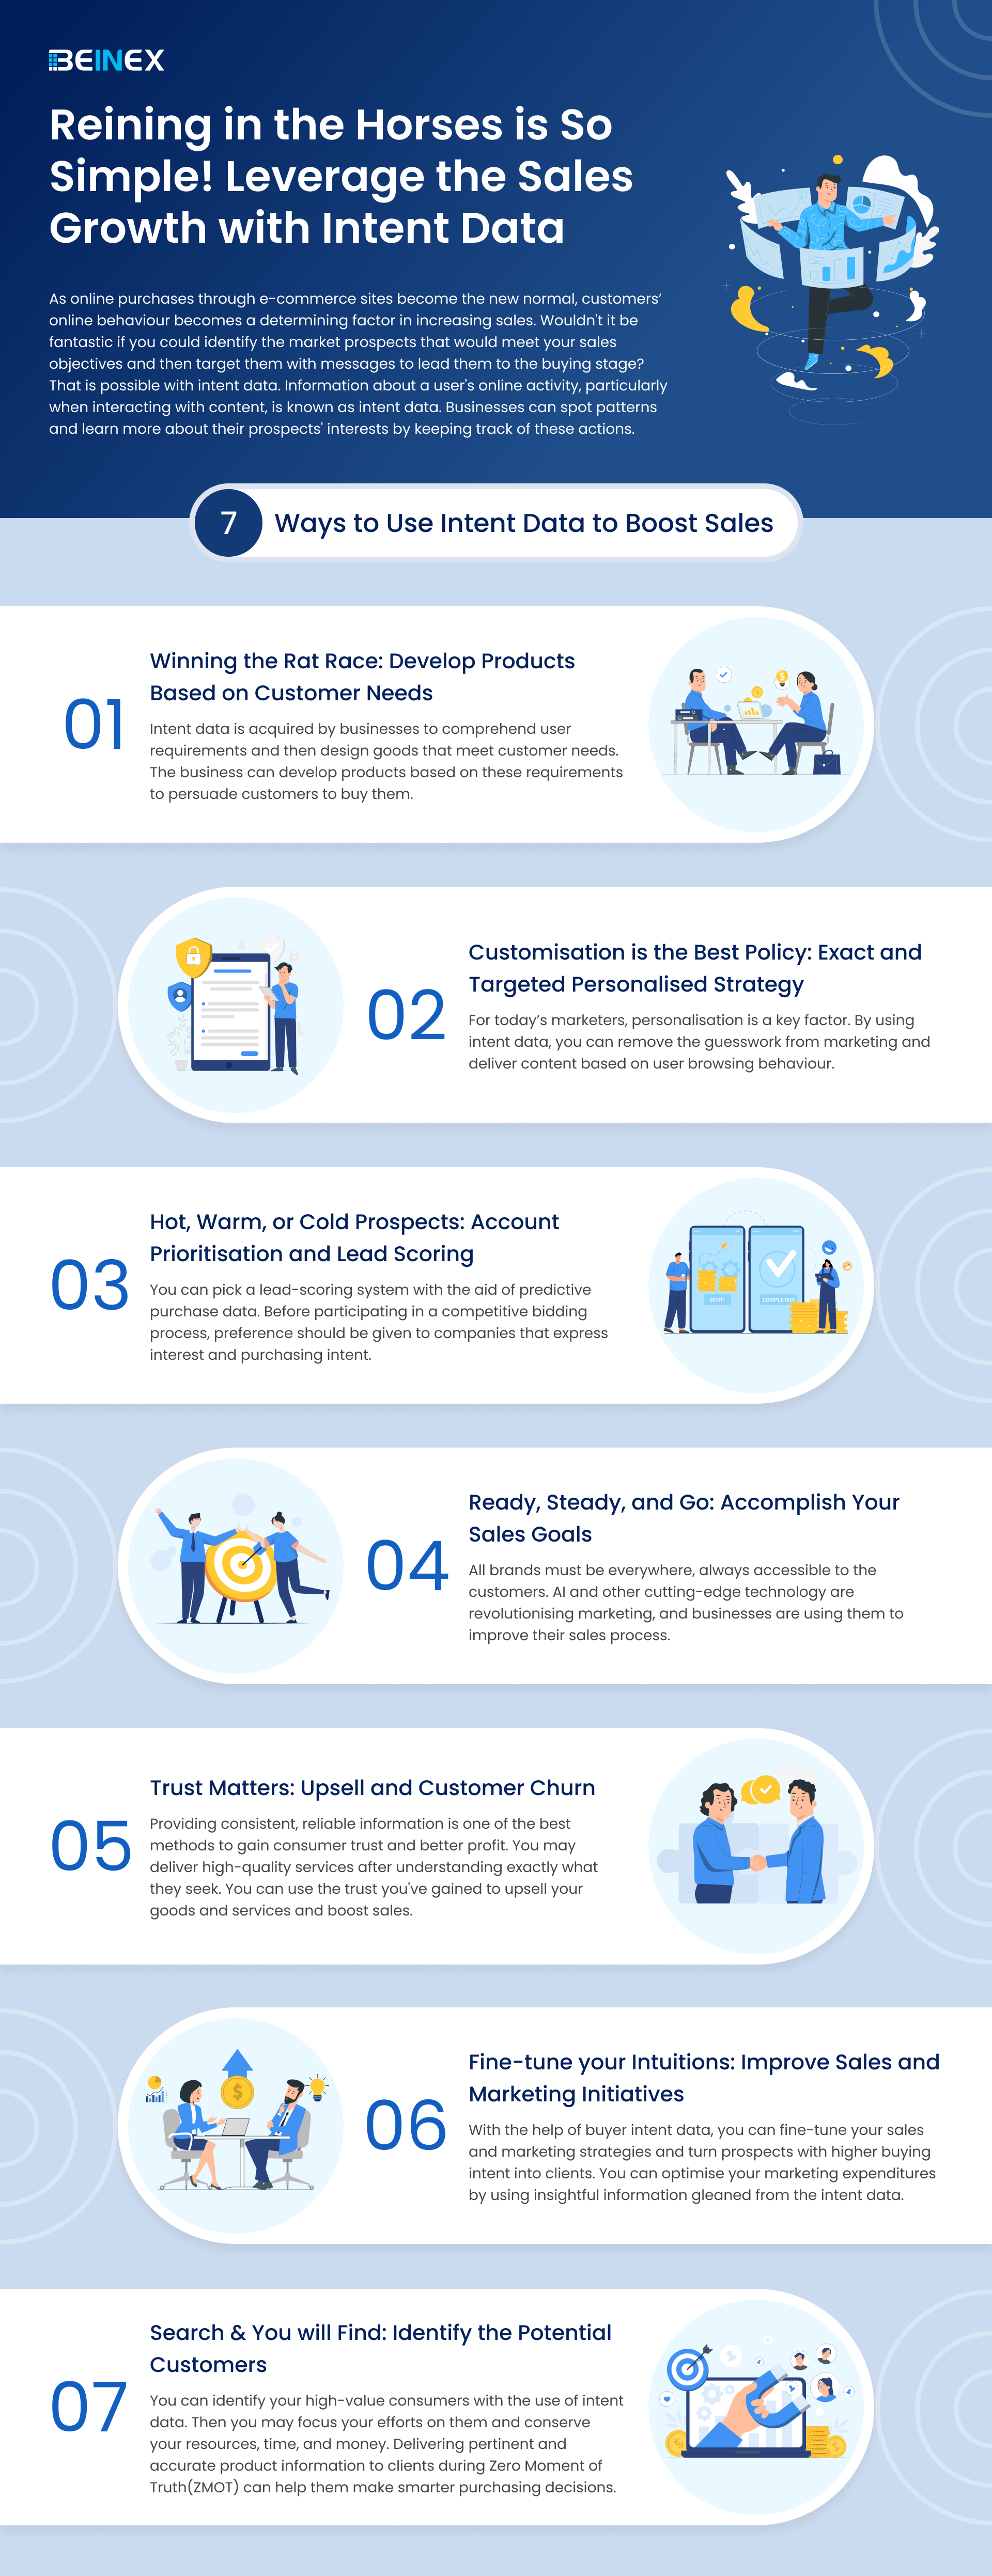
Reining in the Horses is So Simple! Leverage the Sales Growth with Intent Data(Infographic)

Data Governance Policies in the UAE: Key Components, Benefits & Best Practices
Poor data quality costs organizations an average of approximately $12.9 million a year, according to Gartner. Gartner projects that by 2027, 60% of data governance teams will prioritize governing unstructured data to support generative AI use. For businesses across the Middle East scaling cloud adoption, analytics, and AI, data governance has moved from a back-office IT concern to a board-level priority, and the organizations that treat it that way are the ones capturing measurable value from their data.

IMAGE IN BAR CHART – NEW LEVELS OF TABLEAU VISUALIZATION!
The following blog depicts the technique created by Alex Jones (@jusdespommes) blog about “How to… create a chart from an image in Tableau!”.
Show/Hide Containers
Tableau 2019.2 has introduced an option to show/hide containers (when the container is a floating type). Many experts have come up with different use cases such as hiding and showing the filters, parameters, or even a worksheet with a click which occupies much space in the dashboard using this feature.
This feature is pretty simple to use and comes in handy when we want to save some space in our dashboards.
How to Swap image in Bar Chart?
1.Create a simple bar chart in Tableau 2019.2. We have used “Top 5 Grossing Games Worldwide 2018” to create a bar chart and sorted based on the revenue.
2.Remove the label, header and export the worksheet to image. Worksheet > Export > Image (Choose ‘view’ in Export Image dialog box)
3. Open Photopea, which is an online photo editor and open the saved worksheet image.
File > Open > Image
4. Now, download 2 images from online which we are going to use for bar chart.
5.Copy and paste image 1 on top of the bar image. Now we will be having two layers of images one above another.
(We can even re-position, crop the image if needed)
6.Choose ‘Magic Wand’ from the tool bar at left side. Click on the image, and we can see the selection in dotted lines.
7.Choose the top layer (image 1) and click delete. Now we can able to get the below image.
8.The background of the image needs to transparent. So, delete the below layer (bar chart image) using delete icon at the bottom right corner.
9.Now, choose File > Export as > .PNG to save the image as .png format (this will retain the transparent layer)
10.Repeat the same steps with image 2 to get the same effect.
Note: Keep the same resolution and image size as the previous one.
10.1.Now, open Tableau Desktop and bring in the image as floating type.
11.We have to position the bar chart over the image. To make it easy, decrease the opacity of the bar chart and give border.
12. Add labels and tooltip to the bar chart.
13.Now the dashboard looks like this. We can able to hover on bars to see tooltip.
14.Now, comes the trick of using ‘Show/Hide Containers’ to swap image. Bring a container to floating and add image 2 to the container. (Set the padding to zero)
15.Next, we have to position the both images and the bar chart one above another. To make it easy, use x, y axes and size w, h to position accurately.
Note: Make sure the position of the 3 objects (Use Floating Order) follows the below order as all are in floating.
- Image 1 (Below layer)
- Image 2 inside container (Middle layer – where show/hide option is to be used)
- Bar Chart (Top layer)
16.Choose the container and right click at the top right corner. Enable ‘Add Show/ Hide Button.’ Now we can see a floating button.
17.We can customize the button by adding image and tooltip to buttons.
18.We have used below customized images (created with PowerPoint) for buttons to swap between 2 images.
19.Another simple trick is that we can control the transparency of the image by adjusting the opacity of the bars.
20.Take a look at the final dashboard….