How AI Decision-Making is Improving Enterprise Outcomes
Blog
Share 
Beinex Recognized as a Leading Consulting Firm in the Middle East by Consultancy-me
Accolades We Are Proud Of
Beinex earned top rankings across multiple domains: • Platinum in Business Intelligence • Gold in Data Science • Gold in Cloud Services
Industry-Specific Excellence
Our industry-focused consulting capabilities have also been recognized, and our ranking level is as follows: • Government Industry: Gold • Oil & Gas Industry: Gold • Public Sector Industry: Gold • Technology Industry: Gold • Banking Industry: Silver
A Milestone of Achievement
These accolades reaffirm our position as a trusted consulting partner for businesses and government entities across the Middle East. Our success is driven by a team of passionate professionals, innovative technologies, and strategic partnerships. Looking Ahead As we celebrate this achievement, we remain committed to delivering transformative solutions that empower businesses worldwide. Thank you to our clients, partners, and team members for making this success possible. If you are interested in our services, feel free to connect: https://beinex.com/contact-us/
Read More About Our Achievements
Beinex Among Top BI Consulting Firms in the Middle East Beinex Ranked as Top Data Science Consulting Firms in the Middle East Beinex Makes to the League of Top Consulting Firms for Cloud Services in the Middle East 2024Beinex has emerged as one of the top consulting firms in the Middle East for 2024, based on the prestigious Consultancy-me rankings. Based on the client and consultant reviews about our services, we are leading in multiple domains.
Related Articles
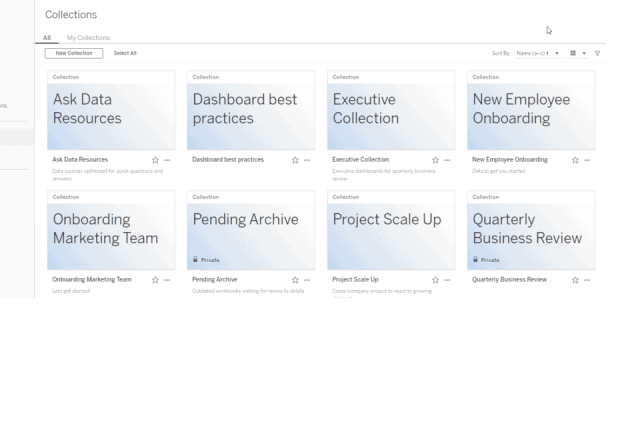
Tableau 2021.2 : New Features
This has changed the way we interpret information by giving us a look into past insights but also to forecast future events, allowing us to make informed decisions.
Tableau 2021.2. includes ‘ask and explain data’ for viewers, allow connected desktops, Collections, and many more valuable features. Some of the key enhancements are listed below.
Collections provides a new format to organize content across your sites on both Tableau Online and Server into manageable folders. You may group item together from different projects and workbooks and you can reuse content in multiple contexts without additional storage or resources. Collections also makes it easier to share content around a central theme. For example, you can create a “Daily Sales” collection that includes dashboards with daily sales statistics, ETL data flow, data sources, etc.
Collections helps you congregate your data. You are given the leeway to create, explore and save your content privately. Another key feature of ‘Collections” is that users can create customized collections which are by default private. However, you are given the option to share the collection with any authorized users you choose to provide access to.
1) User Management Enhancement


In earlier versions, a subscribed user, deleted by an admin, was not erased from the system entirely. They were then classified as an 'unlicensed user'.
With version 2021.2, the subscribed creator will be deleted automatically when an admin deletes a user either via the UI or the REST API, without the extra step of reassigning the subscription ownership.
2) Ask Data Enhancements
Ask Data Lenses
A new feature introduced with this update is 'Ask Data Lenses'. It allows for easy data curation with defined columns and value synonyms and also provides suggested questions to allow for more inclusive data from a variety of sources.
(The update brings a new content type that is Ask Data Lenses, making it easy to curate data with the definition of column and value synonyms and suggested questions so you can better leverage existing published data sources.)
They are created alongside published data sources Ask Data use case(s) while maintaining the underlying data source as its own entity.
These 'lenses' are comparable to ‘views’. For those of you who are adept with SQL, where you can write selected statements specifically to extract the required columns, give definitions, whilst maintaining the integrity of the data source. Similarly, once created, ‘lenses’ can be accessed by viewers, opening Ask Data to a new class of users that struggle to self-serve their needs today.
Entity Search
Entity Search shows users search results of keywords, like the Google search box. Ask Data gives you word-by-word search results, giving you instant feedback on your data and what Ask Data can do. Ask Data will automatically choose the most relevant interpretation of your search and these search results help you build that input more effectively by selecting the right fields and values in the data set. Ask data learns from your selections to choose smarter defaults for future searches.

MFA allows users to easily add an additional layer of security to their accounts.
This feature unlocks the ability for Tableau Online customers who utilize native Tableau ID authentication to enforce multi-factor authentication (MFA) when their users sign into their sites. End-users can use applications like Salesforce Authenticator or Google Authenticator to perform additional verification of their identity when they log on to Tableau.
MFA makes it much harder for common threats like phishing attacks and account takeovers to succeed. MFA is one of the easiest and most effective ways customers can enhance login security and safeguard their business and data against external threats.


 Easily rename multiple fields in prep allows creators to transition seamlessly from web authoring to Tableau Desktop with a single click of a button. Creators will now be able to edit any workbook that they have permission to on Desktop.
Prior to 2021.2, users had to manually change each header name. For example, if a user wanted to change “Customer” at the start of multiple header names, they would need to click on each field name and individually change/remove “Customer” in the field name. Not a big deal when there are less than 10 columns to update. However, for customers with data sets of 50+ columns, it is more cumbersome to have to individually change each field name. This feature allows a customer to quickly add a prefix, rename or add a suffix to multiple fields collectively.
Easily rename multiple fields in prep allows creators to transition seamlessly from web authoring to Tableau Desktop with a single click of a button. Creators will now be able to edit any workbook that they have permission to on Desktop.
Prior to 2021.2, users had to manually change each header name. For example, if a user wanted to change “Customer” at the start of multiple header names, they would need to click on each field name and individually change/remove “Customer” in the field name. Not a big deal when there are less than 10 columns to update. However, for customers with data sets of 50+ columns, it is more cumbersome to have to individually change each field name. This feature allows a customer to quickly add a prefix, rename or add a suffix to multiple fields collectively.
 Tableau Prep is expanding its output capabilities to include Google BigQuery, enabling you to add or update data in Google BigQuery with clean, prepped data from your flow each time it is run.
TABLEAU DESKTOP 2020.2 – Key Features
1) Maps: Spatial File Support
The Marks Layers Control SP1 feature provides a control that allows users to toggle the visibility of layers on a map viz. The control works like a filter and the user is free to choose which layer(s) to view in order to answer their question. In addition, the user can control the interactivity of the map viz by selectively enabling or disabling selection on the layer in question.
Tableau Prep is expanding its output capabilities to include Google BigQuery, enabling you to add or update data in Google BigQuery with clean, prepped data from your flow each time it is run.
TABLEAU DESKTOP 2020.2 – Key Features
1) Maps: Spatial File Support
The Marks Layers Control SP1 feature provides a control that allows users to toggle the visibility of layers on a map viz. The control works like a filter and the user is free to choose which layer(s) to view in order to answer their question. In addition, the user can control the interactivity of the map viz by selectively enabling or disabling selection on the layer in question.
 Toggle button – Our users can now use a button to show/hide any dashboard zone, floating or tiled. This function was previously limited to floating horizontal and vertical containers only.
URL support for images – Users can now add images via external URLs, which also provides GIF support for images on the internet and workbooks. Loading these images will be time-efficient.
Toggle button – Our users can now use a button to show/hide any dashboard zone, floating or tiled. This function was previously limited to floating horizontal and vertical containers only.
URL support for images – Users can now add images via external URLs, which also provides GIF support for images on the internet and workbooks. Loading these images will be time-efficient.
Top Ten Business Intelligence Trends
What is Business Intelligence?
Business intelligence (BI) is an analysis that uses business-related strategies and technologies to assess, process, and interpret business information. This type of information helps businesses understand the current state of their organization and make informed decisions on how to take actions that are likely to yield their intended results.
Leveraging business intelligence insights offers several benefits to employers and employees, including strengthening performance and improving efficiency. For example, insights from business intelligence metrics can help employers understand where supply chain function might be breaking down or provide a snapshot of consumer products performing above or below expectations.
Top Trends in Business Intelligence in 2024
Finding the latest trends in BI can help your organization stay competitive and maximize your ability to use your data. While trends continually shift by nature, the following areas have rapidly risen in demand and application.
1. Augmented Analytics
Augmented analytics is an approach to data analytics that employs advanced technologies such as AI and machine learning to automate data preparation, insight generation, and insight sharing.In 2023, the global augmented analytics market was valued at USD 8.9 billion, marking a significant milestone in data-driven technologies. The market is on track for impressive expansion, with estimates predicting its value will climb to USD 11.6 billion in 2024 and soar to USD 91.4 billion by 2032. This remarkable growth, reflected in a compound annual growth rate (CAGR) of 29.4% between 2024 and 2032, underscores the rising importance of advanced analytics in transforming business intelligence and decision-making processes across industries.
Here are the advantages of augmented analytics:
Advantages: • Increased Efficiency: Automates data preparation, saving up to 60% of man-hours spent on manual data processing. • Broader Accessibility: Empowers non-technical users to gain insights, reducing dependency on data specialists by 40%. • Real-World Impact: Organizations using augmented analytics report a 25% increase in productivity due to faster decision-making.
2. Natural Language Processing (NLP)
Natural Language Processing (NLP) is a confluence of computational linguistics and artificial intelligence that enables machines to understand, interpret, generate, and respond to human language meaningfully and contextually. An example of a program that utilizes natural language processing is ChatGPT. The Natural Language Processing (NLP) market is projected to reach a value of USD 36.4 billion in 2024. With a robust compound annual growth rate (CAGR) of 27.5% from 2024 to 2030, the market is expected to expand significantly, reaching a volume of USD 156.8 billion by 2030. This rapid growth highlights the increasing adoption of NLP technologies across various industries, driving advancements in AI-driven communication and analytics tools. The advantages of Natural Language Processing (NLP) within the business intelligence landscape: Advantages: • Enhanced User Engagement: Reduces the learning curve for data tools, increasing user adoption by up to 30%. • Customer Insights: Companies using NLP for sentiment analysis report a 15% increase in customer satisfaction.
3. Data Storytelling
The growing dependence on data in the corporate landscape brings forth the need for data interpretation that extends beyond traditional methods. The narrative structure is one of the primary differentiators between data storytelling and data visualization. While data visualization can provide a visual representation of what the data is saying, data storytelling explains why the data matters, providing a more comprehensive understanding of the insights. According to Gartner, by 2025, data stories will become the most common method for consuming analytics, and data storytelling will dominate BI, with 75% of these stories being automatically produced through augmented analytics techniques. Advantages: • Better Understanding: Enhances comprehension of complex data, leading to a 20% reduction in misinterpretation. • Improved Decision-Making: Organizations using data storytelling have reported a 15% increase in strategic decision outcomes.4. Self-Service Analytics
Another BI trend is self-service analytics. It is a form of business intelligence wherein end-users, such as marketing professionals, are enabled to conduct data analyses and generate reports without the direct assistance of IT or data science teams. The self-service BI market is projected to reach USD 30 billion by 2036, expanding at a compound annual growth rate (CAGR) of 8% between 2024 and 2036. In 2023, the market size was valued at over USD 18 billion. This substantial growth is driven by the increasing demand for data democratization, as organizations seek to dismantle traditional data silos and enable non-technical users to access, analyze, and extract insights from data independently. Advantages: • Time Savings: Reduces report generation time by up to 50%, allowing for faster data-driven decisions. • Empowered Employees: Decreases IT workload by 30%, enabling more focus on strategic projects.
5. Decision Intelligence
DI goes beyond traditional analytics by creating a semantic framework that incorporates business rules and context, enabling predictive analytics to generate actionable, future-focused insights. This empowers organizations to make more informed and strategic decisions, often automating routine choices and accelerating complex ones. The DI market is on a robust growth trajectory, projected to surge from $13.3 billion in 2024 to a remarkable $50.1 billion by 2030. As businesses increasingly prioritize data-driven strategies, DI stands out as a pivotal tool for enhancing decision-making agility and precision, ensuring organizations stay ahead in a competitive landscape. Advantages: • Automated Decision-Making: Increases decision speed by up to 40%, significantly reducing time-to-insight. • Enhanced Strategic Planning: Companies using DI report a 25% improvement in strategic planning accuracy.6. Predictive Analytics
Predictive analytics is an advanced form of analytics that uses historical data, statistical algorithms, and machine-learning techniques to predict future events and trends. The predictive analytics market is projected to grow by USD 38.6 billion, at a CAGR of 28.9%, between 2023 and 2028. This rapid expansion is fueled by increasing demand for data-driven decision-making, advancements in AI and machine learning technologies, and the rising adoption of predictive analytics across various sectors, including finance, healthcare, and retail. Advantages: • Proactive Decision-Making: Reduces operational costs by up to 15% through accurate demand forecasting. • Risk Mitigation: Enhances risk assessment accuracy, leading to a 20% reduction in potential losses.
7. Artificial Intelligence (AI) in BI
Another emerging BI trend is the greater infusion of AI in business intelligence. AI's ability to automate data analysis, generate insights, and predict outcomes is redefining the way organizations interact with data. The Artificial Intelligence market is projected to reach a size of USD 184.0 billion in 2024, with an expected annual growth rate (CAGR) of 28.4% from 2024 to 2030. This growth is anticipated to result in a market volume of USD 826.7 billion by 2030. AI in BI typically involves the application of machine learning algorithms and advanced analytics techniques to automate data processing and interpretation tasks. From data collection and cleaning to analysis and insight generation, AI can significantly reduce the manual workload, speeding up the entire BI process. Advantages: • Operational Efficiency: Automates 70% of data analysis tasks, freeing up resources for strategic activities. • Cost Reduction: Reduces the cost of data processing by up to 20%8. Advanced Data Visualization
Advanced data visualization goes beyond basic charts and graphs, incorporating a variety of innovative visual elements such as heat maps, geographical maps, scatter plots, treemaps, and more into the dashboard design. These elements enable the presentation of multi-dimensional data in a single view, facilitating a more comprehensive understanding of the data. The global data visualization market showcased a strong value of USD 4.5 billion in 2017, highlighting the growing demand for effectively presenting complex data. By 2023, the market is expected to surge to USD 7.7 billion, reflecting a robust CAGR of 9.47%. Advantages: • Improved Insights: Increases data interpretation accuracy by 30%. • Enhanced Collaboration: Boosts cross-departmental collaboration by 25% through shared visual insights.
9. Mobile BI
Mobile business intelligence (BI) involves the use of mobile devices to access BI applications and data, enabling decision-makers to stay informed and make decisions, irrespective of their location. The global mobile business intelligence market, valued at USD 13.8 billion in 2023, is expected to grow at a CAGR of 15.3%, reaching USD 51.5 billion by 2032. Advantages: • Increased Accessibility: Provides real-time data access, enhancing decision-making speed by 35%. • Boosted Productivity: Enables on-the-go analysis, increasing productivity by 20%.10. Ethical Data Governance
The last BI trend on the list is ethical data governance, which addresses policies, procedures, and structures that ensure data quality and security, and ethical considerations related to data collection, processing, and use. The global data governance market is projected to reach USD 4.1 billion in 2024 and is expected to grow at a CAGR of 18.5% over the next decade, reaching USD 22.5 billion by 2034. The central principle behind Ethical Data Governance is respecting individual privacy and rights in all data activities. It involves implementing practices that ensure informed consent, data anonymization, and stringent access controls, among others, to protect individual privacy and prevent data misuse. Advantages: • Compliance Efficiency: Reduces compliance-related costs by up to 25%. • Increased Trust: Builds customer trust, leading to a 10% increase in brand loyalty.
Tableau in Action: Leveraging Latest BI Trends
Tableau integrates the latest BI trends into practical applications, enhancing decision-making and data insights. Let’s examine how some of the top BI trends are applied within Tableau. Here are a few examples:
- Augmented Analytics: With Tableau Einstein Discovery, companies can automate insights and speed up decision-making, especially in retail and finance.
- Natural Language Processing: Tableau’s NLP system allows users to explore data using simple language, enabling faster data processing without coding.
- Data Storytelling: Story Points help craft compelling narratives, increasing stakeholder engagement in areas like marketing and sales.
- Self-Service Analytics: Tableau enables business users to independently explore data, reducing IT workload and accelerating decisions in finance and supply chain.
- Predictive Analytics: Integrating with Einstein Discovery, Tableau’s predictive capabilities help industries like healthcare forecast trends and optimize operations.
- Mobile BI: Tableau’s mobile app allows for real-time access to data, improving productivity for on-the-go teams like sales.

A Step-by-Step Guide to Predictive Analytics in Alteryx
5 Steps in Alteryx Predictive Analytics Process
The five major stages of the predictive analytics process cycle include selecting a target variable, examining the data, collecting the data, creating the model, and scoring the model.A detailed description of the steps involved in the predictive analytics process in Alteryx:
- Step 1: Select a Target Variable
- Step 2: Analyse Your Data
- Step 3: Run Calculations/ Collect New Data
- Step 4: Model Building
- Step 5: Score the Model
Step 1: Select a Target Variable
Select the target variable which is the column that should be predicted. It could be a binary or non-binary categorisation or a numerical value and it can be continuous or time-based. Each of these target variables helps in finding business solutions. But just because time is a variable in the problem does not mean that a time-based model will be the best way to solve it. Simultaneously if a field has a numeric value, it does not mean that a binary model cannot be utilised in finding insights.
Step 2: Analyse Your Data
The largest contributor to excellent predictive models is the sample size. Anything less than 5000 records is counted as under-sampled and using it is not considered the best practice.
Alteryx and Tableau Prep are both excellent tools for understanding data by creating histograms, scatterplots, and correlation matrices. Before step 3, in the data transformation procedure, it is better to know what types of variables are in the data. There are various sorts of predictor variables and several types of target variables, and each must be structured differently.
- Categorical Data: String fields with no order are categorical data. It contains data in the form of text.
- Ordinal Data: String fields with an order are ordinal data. It can be substituted into numeric order in a predictive workflow.
- Numeric Data: It represents information with a measurable value.
- Cyclical Information: Data which gets repeated as such in a cyclic process is cyclic information.
Step 3: Run Calculations/ Collect New Data
Obtaining the greatest data or inferring fields from present data, such as adding seasonality, can be a powerful predictor variable. Always be inventive in the choice of variables. It is crucial to note that if there is to infer a piece of data, it is sometimes unwise to include both that data and the original data column in the same model because the predictive model would automatically give higher weight to this column. It is also critical to recognise that while it is beneficial to include factors with correlation, variables that drown out all other variables must occasionally be removed.
Step 4: Model Building
a. Make Use of the Decision Tree
Using a Decision Tree, it is possible to rapidly discover which of the factors are the most crucial for predicting the target variable. This model will not be utilised in the final forecast since it will over-fit, but it will show whether some of the variables are overly connected to the target variable.
b. Experiment with Different Models
Data Science is complicated, and it is difficult to know which model will yield the best results, therefore a variety of models, such as Random Forest, Boosted Models, and Neural Networks can be employed for better results.
Step 5: Score the Model
Alteryx offers a scoring tool that may be used to score models. During this step, data should be withheld for the model to test and score. Even though different models can provide different scores, through testing and reconfiguring, accurate predictions can be made.
What makes Alteryx an exceptional tool for predictive analytics?
These remarkable capabilities make Alteryx an excellent tool to carry out predictive analytics tasks easily:
- • No or Low coding required
- • Predictive analytics by drag and drop
- • Predictive tool kit for specifically performing predictive analytics
- • Integration to R and Python
- • Variety of built-in and custom ML models are available
- • Model customizations are possible
- • Automation and/or scheduling of predictive analytics workflows
Predictive Analytics Tools
Predictive analytics solutions use the power of data to help businesses in identifying trends in customer behaviour, making predictions, and developing optimised marketing plans.
The tools that aid in predictive analytics are enlisted below:
- Data Investigation Tools
- Predictive Tools
- Tools for the Modern Statistical Learning Method
- Tools for Predictive Model Comparison and Hypothesis Testing
- Tool for Predicting Values for All General Predictive Modeling Tools
1. Data Investigation Tools
Data investigation tools contain tools that help to get a better understanding of data. To better understand the data used in a predictive analytics project including both visualization tools and tools that provide tables of descriptive statistics.
The list of data investigation tools is given below:
- Field Summary Tool
- Heat Plot Tool
- Histogram Tool
- Plot of Means Tool
- Scatterplot Tool
- Violin Plot Tool
2. Predictive Tools
This category contains general predictive modelling tools for classification and regression models, and also tools for predictive modelling related to model comparison and hypothesis testing.
Predictive tools are enlisted below:
- Count Regression Tool
- Gamma Regression Tool
- Linear Regression Tool
- Logistic Regression Tool
- Naïve Bayes Classifier Tool
- Neutral Network Tool
- Stepwise Tool
- Support Vector Machine Tool
3. Tools for the Modern Statistical Learning Method
- Boosted Model Tool
- Decision Tree Tool
- Forest Model Tool
- Spline Tool
4. Tools for Predictive Model Comparison and Hypothesis Testing
- Cross-Validation Tool
- Lift Chart Tool
- Model Coefficients Tool
- Model Comparison Tool
- Nested Test Tool
- Test of Means Tool
- Variance Inflation Factors Tool
5. Tool for Predicting Values for All General Predictive Modeling Tools
- Score Tool
6. Time Series Tools
- ARIMA tool
- ETS tool
- TS Compare Tool
- TS Covariate Forecast Tool
- TS Filler Tool
- TS Forecast Tool
- TS Forecast Factory Tool
- TS Model Factory Tool
- TS Plot Tool

Benefits of Advanced Analytics: From its Impact on Company Culture to Business Financials
Advanced Analytics aids in the resolution of complicated business challenges, as well as the improvement of operational efficiency, investment decisions, and customer experiences. It goes one step ahead of business intelligence by employing sophisticated modelling approaches to forecast future occurrences and find trends/patterns that would otherwise go undetected. Let’s get into the benefits of Advanced Analytics in detail:

Benefits of Advanced Analytics:
Transformation of Company Culture
Organisations must transition to a data-driven culture that questions assumptions, addresses crucial topics, and rewards everyone who can provide and analyse value-added data. Companies reap a bunch of benefits by adopting a data-driven culture. The prevalence of such a culture gives employees the talents and skills to analyse data and develop valuable insights, resulting in more accurate decision-making. When a data-driven culture is established, employees can actively seek out more relevant data to fine-tune goals and objectives.
Predicting the Future
Using Advanced Analytics, organisations can assess market circumstances faster and respond to changes faster than their competitors, giving them a considerable edge. Big Data analytics are frequently leveraged by financial services organisations looking to mine, for instance, massive amounts of stock market data to identify and capitalise off of previously unknown trends. Public health organisations are also increasingly leveraging vast population health data to develop better policies, treatment and healthcare practices.
Faster Decision-making
Data analytics helps businesses make better decisions and reduce financial losses. Predictive analytics can forecast what will happen due to business changes, while prescriptive analytics can recommend how the company should respond. Executives may move more rapidly when they have high-accuracy projections, knowing that their business decisions will produce the intended effects and that favourable outcomes can be replicated.
Day-to-day decisions made by retail, manufacturing, media, and healthcare (to name a few) are influenced by the accuracy of insights provided by Advanced Analytics capabilities. It aids in the creation of specifically targeted ads, leads to effective inventory management, spotting quality control issues and anticipating fluctuations in labour needs.
Gathering Deeper Insights
Advanced Analytics enables stakeholders to make data-driven decisions that directly affect their strategy by providing a deeper level of actionable knowledge from data, such as customer preferences, market trends, and essential business processes. Actionable data insights obtained after properly analysing data optimise performance and help make informed decisions.
New products or services are launched, and new markets are uncovered to gain new revenue resources. Customer loyalty and satisfaction increase through deep insights earned through data analysis.
Improved Risk Management
Analytics, in general, assists a company in identifying hazards and taking preventive steps.
Employing sophisticated analytics to make more accurate forecasts, Advanced Analytics allows firms to avoid costly and dangerous actions based on faulty projections. Advanced Analytics gives enterprises a holistic view of their business, past, present, and future, allowing them to better identify and manage risk. The improved accuracy of Advanced Analytics predictions can help firms lower the danger of costly blunders.
Different sectors like banking, telecommunications, and government agencies seek help of Advanced Analytics in identifying, assessing and prioritising risks. Timely identification and monitoring of risks using technology make risk management much more accessible.
Anticipating Problems and Opportunities
Companies can use Advanced Analytics to solve problems that traditional BI can't. It can recommend activities that will improve business outcomes based on probability. Advanced Analytics reduces decision-making uncertainties and allows enterprises to take more effective data-driven decisions. Enterprises take much more of insightful decisions without any programming support from data scientists. It also eliminates customer problems before it arises by converting silos of data into insightful information clusters.
Advanced Analytics employs statistical models to uncover potential difficulties with the company's trajectory or find new opportunities, allowing stakeholders to change course rapidly and achieve better results. Thereby enterprises will discover the accrual of a unique competitive advantage and power to uncover previously unseen trends that project them into an influential positions.
Personalising the Customer Experience
Personalised experience has gained momentum, and companies are ready to offer it more and more to their customers: accessing and mapping relevant data pools to identify customers’ needs and expectations and create a unique experience tailored for them. Also, they deploy Advanced Analytics to improve productivity, optimise business operations, ensure customer experience and more. Effective data utilisation continuously improves workforce efficiency, and by tracking customer engagement, companies can offer a seamless experience to the customer.
Customers' data are gathered through various channels, including physical retail, e-commerce, and social media. Businesses can get insights into client behaviour by employing Advanced Analytics to construct complete customer personas from this data, allowing them to give a more personalised experience.
Improving Financial Performance
The financial performance of the companies, irrespective of the sector, improves by making the best out of Advanced Analytics. The sales forecasting accuracy increases, organisational trends are uncovered, and challenges are addressed competitively, highlighting the business growth. With the marketplace becoming exceedingly competitive, making more confident decisions are inevitable using analytics tools.
Thanks to Advanced Analytics, the biggest businesses worldwide are seizing on the opportunity to make the best of Advanced Analytics. Those enterprises that would like to steal the show can manoeuvre the operations to killer effects by adopting analytics. So, it’s time to get ahead of the curve by the intelligent use of big data for advanced solutions, cutting-edge advertising strategies, and targeted marketing campaigns.

Snowflake Summit: Glimpses of Groundbreaking Data Cloud Developments
Snowflake summit 'The World of Data Collaboration' was held in Las Vegas, Nevada, June 13-16, 2022. It featured the first look at innovations coming to the Data Cloud. Over 200 lectures, practical labs, certification possibilities, and more than 200 Basecamp partners were included in the four-day data Snowflake Summit. Thousands of Snowflake's partners, clients, and industry colleagues were there to network, cooperate, and learn crucial information about Snowflake and new Data Cloud trends.
Here are the four most exciting of Snowflake's latest offerings:
1.Innovative data capabilities that save time and resources
The release of Snowpark for Python, which is currently in public preview, was one of the statements that received the most attention at the summit. Both streaming ingestions using the new Snowpipe Streaming and streaming pipelines with the launch of Materialised Tables generated a lot of interest. These new features demonstrate Snowflake's product philosophy, which strongly emphasises simplicity for partners and customers while delivering value. The declarative model is excellent since it only requires describing the change; Snowflake will handle the rest. They anticipate less data lag, more real-time features, and quicker decision-making.
A new workload, Unistore, that enables users to work seamlessly with transactional and analytical data together in a single platform stirred curiosity in the audience. Unistore can save time and effort in moving data from operational systems and help with low-latency machine learning (ML) inference scenarios. It provides snappy user interfaces, allowing teams to create real-time analytical queries on their transactional data and build transactional business applications directly on Snowflake and offers a unified approach to security and governance.
2.Creating, monetising, and using apps on the Data Cloud
The most intriguing news is the potential of the Snowflake Native Application Framework, which is now in private preview. Anyone may now create applications using the well-known Snowflake core functionality, share and earn money from them through Snowflake Marketplace, and deploy them directly inside a customer's Snowflake account. Customers may keep their data centralised and greatly simplify application acquisition and maintenance. In contrast, application suppliers will have quick visibility to thousands of Snowflake customers globally across the three major clouds. It was a piece of ground-breaking information for all parties.
Bidirectional and multi-source native apps developed by Informatica allow users to combine data from various cloud and enterprise platforms, including IBM, Microsoft, Salesforce, and SAP. So, Snowflake partners and customers can concentrate more on what to build and less on how to build it; Snowflake wants to make the building process more straightforward. Snowflake may not be able to foresee the entire extent of value creation and innovation that would result from this.
3.More options and cloud compatibility
As a customer-focused business, Snowflake constantly strive to strike a balance between giving our consumers options, streamlining processes, and lowering complexity. Providing a consistent user experience and simple governance for data housed in any of the three significant clouds is a crucial objective (AWS, Azure, and Google Cloud). With the help of the Snowflake platform, businesses may create their applications once and deploy them across several major cloud vendors' regions. Companies can migrate data—and now applications—easily between regions or clouds thanks to Snowflake's cross-cloud capabilities. You can use transactional consistency for failover and failback. For both customers and partners, Snowflake is offering a way to make the construction of cross-regional and cross-cloud experiences simpler.
Snowflake's ability to develop an app once and have it function flawlessly across various clouds and locations is a game changer. By enabling the Data Cloud to process data from S3-compatible storage systems, such as on-premises storage providers, Snowflake has also improved choice (currently in development). It also supports interoperability and open file formats as agents of choice. To that aim, Snowflake unveiled the presently under story Apache Iceberg Tables, which will let users select Iceberg as the persistence table type and Parquet as the file format, table by table.
4.Rich data experiences without sacrificing readability for data governance or security
Clients of Snowflake value the data governance and security provided by Snowflake as well as the release of numerous new features and enhancements are appreciated. For instance, with the assistance of Snowflake's new workload Cybersecurity, cybersecurity teams can easily break down data silos, resulting in improved visibility into security incidents, risks, and threats. In short, clients want to create reliable data products and openly share data without relinquishing control of or re-siloing their data. Snowflake accelerates the economic value cycle for partners, clients, and, quite honestly, by doing away with the trade-off.
Snowflake has planned to offer more services connected with data sharing, collaboration with clean data rooms, and Native Applications Framework.
Beinex's partnership with Snowflake
Beinex's partnership with Snowflake enables it to offer clients advanced features like automated tuning and elastic compute with unlimited decoupled computing capability, along with the analytics modernisation services, to help organisations realise exponential Return on Investment. We keep innovating for all our clients and to support businesses around the world to create more possibilities and quality services.