How AI Decision-Making is Improving Enterprise Outcomes
Blog
Share 
بلانيثون بينيكس: نركض من أجل صحتنا! نركض من أجل كوكبنا
 18 April 2022
  Rakesh Neelakandan
السياق
هناك تصور شائع بأن وظيفة سطح المكتب في تكنولوجيا المعلومات هي مرادف لاعتلال الصحة. نظرًا لأن الوباء اجتاح العالم ودمر كل شيء في طريقه من الحياة إلى سبل العيش، استمرت صناعة تكنولوجيا المعلومات في الازدهار بسبب النمو الهائل في الساحة الرقمية.
لكنها جاءت مصحوبة بمجموعتها الخاصة من المشاكل والتحديات. لقد كان لساعات العمل الطويلة ونمط الحياة غير المستقر أثره. تماشى معدل الإصابة بأمراض نمط الحياة للعاملين في مجال المعرفة مع خريطة النمو لأعلى في مجال صناعة تكنولوجيا المعلومات.
فرق بينيكس
كان بينيكس استثناء لهذه القاعدة؛ بفضل تحدي اللياقة الذي بدأته كجزء من برنامج تواصل الخريف (أوتم كونيكت) مسابقة لموظفيها مع عدد كبير من التحديات التي واجهوها بحماس من طهي طعام صحي إلى تحقيق أهداف اللياقة البدنية.
بينيكس بلانيثون
تزامنًا مع هذه الروح، ولتعزيزها بشكل أكبر، أجرت بينيكس "بلانيثون بينيكس".
التاريخ: 07 أبريل 2022
الوقت: 7.00 صباحًا - 8.00 صباحًا IST
المكان: ملعب JNI، كوتشي، الهند
لقد كان يومًا ممتعًا بالنسبة لنا، حتى عندما اضطررنا إلى الحضور في مقر JNI بحلول الساعة 6.30 صباحًا. كان الصباح ممتعًا وبحلول الساعة السابعة صباحًا، اجتمعنا جميعًا في موقع رفع العلم.
جاستين اللامعة وابنتها سوريا آن جاستين خرجتا من سباق الماراثون. ألقت شاييني جاستين خطابًا ملهمًا قبل رفع العلم. حثت التجمع على جعل مبادرات اللياقة البدنية أمرًا معتادًا. لقد تحدثت إلينا أن الأمر يستغرق نسبة صغيرة فقط من وقتنا للإضافة إلى اللياقة والصحة ويمنع الضرورات الطبية من الظهور فجأة.
بعد جلسة الماراثون، تم منحها تذكار كرمز وتقديراً منا.
دعونا نقوم بواجبنا. حان الوقت الآن لاستلهام الأفكار وجعل اللياقة عادة! نركض من أجل صحتنا ونعم، نركض من أجل كوكبنا.
تضامنًا مع يوم الصحة العالمي 2022، نظمت بينيكس ماراثونًا صغيرًا بعنوان بلانيثون بينيكس تحت شعار "نركض من أجل صحتنا! نركض من أجل كوكبنا".
يتماشى البلانيثون مع رؤية الأمم المتحدة. فجانب الصحة الكوكبية مهم أيضًا ولا يمكن فصله عن صحة الفرد. كوكب خالٍ من التلوث والأمراض المرتبطة به، هو كوكب مستدام؛ هذا هو هدف الجولة.
تم تمييز البلانيثون من قبل خبيرة اللياقة البدنية المشهورة من ولاية كيرالا في جنوب الهند، شاييني جاستين وابنتها سوريا آن جاستين، التي تحمل لقب ملكة كيرالا للرياضة البدنية.
Related Articles
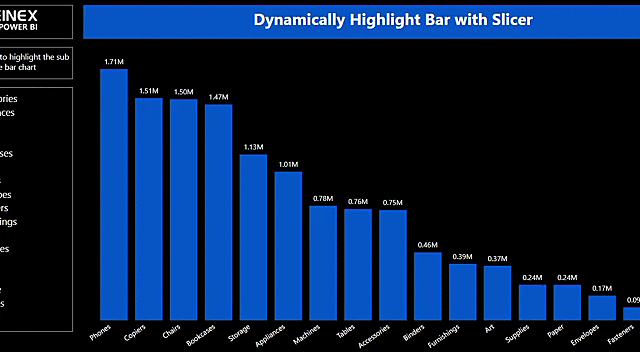
Dynamic highlight bar chart with slicer
But this does not apply to a slicer visual, which only has cross-filtering and no interaction feature. This made me wonder if we can achieve cross-highlight with a slicer visual through some work-around that allows me to compare one category with other easily through cross-highlight.
After some research, I may have found a way to do this. Below are the steps in detail to achieve this.
Normal filtering of data with slicer:
The below example shows normal slicing of data where only the selected value will be reflected in the bar chart. This does not allow me to compare other values easily or focus in on the selected value through highlighting.
 Dynamic highlighting with Slicer:
The below example shows the dynamic highlighting where I can choose the categories in the slicer to highlight for comparison with the other categories. I can easily focus on the selected categories and compare the measure values with other categories.
Dynamic highlighting with Slicer:
The below example shows the dynamic highlighting where I can choose the categories in the slicer to highlight for comparison with the other categories. I can easily focus on the selected categories and compare the measure values with other categories.
 Solution:
First, I have created a disconnected table with the categories. This can be easily done with the following dax formula.
Solution:
First, I have created a disconnected table with the categories. This can be easily done with the following dax formula.
 Added the measure in the field value section.
 Added category slicer from the Selected Category table
 Finally arranged them and saw the magic happen.
 Conclusion:
This goes to show the hidden features of Power BI one can explore with a little bit of tinkering with a dash of DAX. This blog is a first in a series of many nifty blogs. Hope you like it and looking forward to your feedback.
Conclusion:
This goes to show the hidden features of Power BI one can explore with a little bit of tinkering with a dash of DAX. This blog is a first in a series of many nifty blogs. Hope you like it and looking forward to your feedback.
Dynamic highlighting with Slicer:
The below example shows the dynamic highlighting where I can choose the categories in the slicer to highlight for comparison with the other categories. I can easily focus on the selected categories and compare the measure values with other categories.
Solution:
First, I have created a disconnected table with the categories. This can be easily done with the following dax formula.
Selected Category = VALUES(Orders[Category])Had made sure there is no relationship in the model view between the source table and new category table. Created a measure which will be added to the conditional formatting in data colour section in the format pane.
Selected Colour bar =
var selected_category = VALUES ('Selected Category'[Category])
var category_to_highlight = SELECTEDVALUE (Orders [Category])
var filtered = ISFILTERED ('Selected Category'[Category])
var result =
    SWITCH(TRUE(),NOT(filtered),"#0055cc", category_to_highlight in selected_category && filtered,"#0055cc","#9cd0ed")
return result
Explanation:
Selected Colour bar =
var selected_category = VALUES ('Selected Category'[Category]) // taking values from category table
var category_to_highlight = SELECTEDVALUE (Orders [Category]) // Using selected value function
var filtered = ISFILTERED ('Selected Category'[Category]) // checks if the column is filtered and will return true or false
var result =
SWITCH(TRUE(),NOT(filtered),"#0055cc", category_to_highlight in selected_category && filtered,"#0055cc","#9cd0ed")
/* The first condition checks if the there is no filtration will return all values, Then will be checking if the selected set of values is contained in the category column. The selected value will be returning a specific dark colour while the unselected value will be giving a lighter colour. */
return resultCreated a bar chart with total sales given in the value section and the category column from the source data will be given as axis. Gave the highlight effect by adding a measure in the field value section of the data colour conditional formatting.
Added the measure in the field value section.
Added category slicer from the Selected Category table
Finally arranged them and saw the magic happen.
Conclusion:
This goes to show the hidden features of Power BI one can explore with a little bit of tinkering with a dash of DAX. This blog is a first in a series of many nifty blogs. Hope you like it and looking forward to your feedback.
Artificial Intelligence, Machine Learning and RPA tools
Enterprises worldwide have perceived the potential benefits of AI for their operations. AI gives humans the freedom to make insightful decisions while allowing a computer to perform other preset tasks that necessitates the development of such technologies in the first place. These tools assist you in developing, but they also aid in optimising networks and workflows.
A list of Artificial Intelligence tools is given below:- Scikit Learn
- Tensorflow
- Theano
- Caffe
- MxNet
- Keras
- PyTorch
- CNTK
SCIKIT Learn
Known to be the most wanted tool in the library of Machine Learning for the python programming language, Scikit learn offers a wide range of tools for statistical modelling, Predictive analytics and very many other machine learning tasks. It underpins many administered and unsupervised learning calculations. It is a perfect tool for fledgling, and it incorporates direct and calculated relapses, choice trees, bunching, k-implies, etc.
Tensorflow
TensorFlow is an end-to-end open-source platform with a flexible ecosystem of tools for creating Machine Learning applications. It allows Google's voice-recognition tool to spot queries in photos and understand audibly stated phrases.
Theano
Theano was created to simplify and speed up the creation of sophisticated learning models so that they might be used in creative projects. It's written in Python and can run on both GPUs and CPUs. It generates elevated information counts that are often higher than when it runs solely on the CPU. Theano's speed makes it highly cost-effective to perform any complex calculations.
Caffe
The Berkeley Vision and Learning Center (BVLC) and network donors collaborated to construct Caffe, a deep learning structure that prioritises articulation, speed, and assessed quality. Google's Deep Dream uses Caffe Framework. CAFFE is a Python-interfaced BSD-authorized C++ library.
MxNET
MxNET uses a 'forgetful back prop' to barter computation time for memory, which is highly useful for recurrent nets on very long sequences. As it is an easy-to-use support for multi-GPU and multi-machine training, scalability is a priority during the design process. There are a lot of intriguing features, such as the ability to write custom layers in high-level languages. Unlike almost all other significant frameworks, it is not explicitly regulated by a vast corporation, which is suitable for an open-source, community-developed framework.
Keras
Keras is what you need if you like Python and how it works. It is a high-end library that tackles neural networks highly effectively for recurrent nets on very long sequences, which it achieves by utilising Theano and TensorFlow in the backend. It recognises the architecture that relates to specific issues. It aids in the detection of problems by using photos with weights. It optimises the results of a network by configuring it. Keras provides an abstract structure that can be transformed into any other framework for compatibility or performance.
Pytorch
The code for Pytorch, a Facebook-created artificial system, is easily accessible on Github. There are over 22000 stars on it. The framework has been in high demand in recent years, and it is still being developed. PyTorch uses reverse-mode auto-differentiation to modify network behaviour arbitrarily with zero lag or overhead, speeding up research iterations. Its deep learning framework is optimised for achieving state-of-the-art results in research.
CNTK
The Microsoft Cognitive Toolkit (CNTK) is an open-source, unified toolkit that describes neural networks as computational steps via a directed graph. Users utilise CNTK to release and merge popular types of models, such as DNNs, CNNs, RNNs, and LSTMs. It employs stochastic gradient descent (SGD), which learns through parallelisation and automatic differentiation across multiple servers and GPUs. Because of its open-source licenses, anyone can try out CNTK
Machine Learning Tools
Machine learning tools are algorithmic applications of artificial intelligence that allow systems to learn and develop without human input; data mining and predictive modelling are similar concepts. They will enable the software to improve its accuracy in anticipating outcomes without programming it directly. Some top Machine Learning Tools are enlisted below:
- Microsoft Azure Machine Learning
- IBM Watson
- Google TensorFlow
- Amazon Machine Learning
- OpenNMS
- Google Colab
- Apache Mahout
- Shogun
Microsoft Azure Machine Learning
Microsoft Azure Machine Learning is a cloud platform for building, training, and deploying AI models. Microsoft is constantly updating and improving its machine learning tools, and it just announced changes to Azure Machine Learning, including the retirement of the Azure Machine Learning Workbench.
IBM Watson
Watson Machine Learning is a cloud service from IBM that leverages data to deploy machine learning and deep learning models. Users can use this machine learning application to execute two basic machine learning operations: training and scoring. Remember that IBM Watson is best suited for developing machine learning applications via API connections.
Google TensorFlow
TensorFlow is an open-source software library for dataflow programming that Google uses for research and production. TensorFlow is, at its core, a machine learning framework. This machine learning tool is new to the market and is rapidly evolving. The ease with which TensorFlow allows developers to visualise neural networks is perhaps the most appealing feature.
Amazon Machine Learning
Amazon Machine Learning is used for creating and predicting Machine Learning models. Amazon Machine Learning comes with an automatic data transformation tool, which makes the machine learning tool even more user-friendly. Amazon also offers other machine learning tools, such as Amazon SageMaker, a fully-managed platform that makes using machine learning models simple for developers and data scientists.
OpenNMS
Open Neural Networks Package is a neural network implementation software library. OpenNMS, written in the C++ programming language, allows you to download its whole library from GitHub or SourceForge.
Google Colab
Google Colab is a cloud service supported by Python. It will assist in developing machine learning applications using PyTorch, Keras, TensorFlow, and OpenCV libraries. It facilitates machine learning and is accessible through Google Drive.
Apache Mahout
Apache Mahout is an Apache Software Foundation project that employs the MapReduce paradigm and is built on top of Apache Hadoop. It's also utilised to construct scalable, distributed machine learning algorithms for clustering, collaborative filtering, and classification. Mahout includes Java libraries for popular math algorithms and operations and foundational Java collections, concentrating on statistics and linear algebra.
Shogun
Shogun is an open-source ML platform, an open-source machine learning software library built in C++. It employs a diverse set of unified and efficient machine learning techniques. Shogun provides a well-organised implementation of all standard machine learning methods and is a critical player in ML education and development.
Robotic Process Automation Tools
Robotic Process Automation (RPA) tools are commonly used for task automation configuration. These tools are essential for automating repetitive back-office activities. With RPA Tools, we acquire a virtual employee who can execute repetitive tasks efficiently and, at less cost, than humans.
The following is a curated list of the top RPA tools:- Keysight's Eggplant
- Inflectra Rapise
- Blue Prism
- UiPath
- Automation Anywhere
- Pega
- Contextor
- Nice Systems
Keysight's Eggplant
Eggplant RPA is a solution designed for process experts to automate the execution of repetitive tasks. It is compatible with apps such as SAP, Oracle, etc. and provides increased productivity and reduces errors.
Inflectra Rapise
Rapise by Inflectraina, a test automation solution, is in its seventh iteration and specialises in complicated applications like MS Dynamics, Salesforce, and SAP. Rapise now can automate Web, Desktop, and Mobile apps and supports hybrid business settings.
Blue Prism
Blue Prism RPA supports all core capabilities and is used with any application on any platform. You will need programming abilities to utilise this application, but it is user-friendly for developers. Blue Prism is ideal for medium and large businesses.
UiPath
UiPath is a user-friendly system that delivers security by handling credentials, encrypting data, and controlling access based on role. It is an open platform, adaptable for any business size and capable of handling complex procedures.
Automation Anywhere
Automation Anywhere provides core functions and security through authentication, encryption, and credentials. It is an easy-to-use solution ideal for medium and big businesses that offers both on-premise and cloud-based services.
Pega
Pega is a business process management platform that is hosted in the cloud. This is ideal for medium and large organisations and solely delivers cloud-based solutions or services. Pega is compatible with Windows, Linux, and Mac and can be installed on desktop servers.
Contextor
Contextor is an excellent fit for any size front office and works with all workstation applications. It supports Citrix and RDP hybrid virtualisation environments and provides on-premise and cloud services. Contextor can interface with both active and minimised programmes.
Nice Systems
The friendly RPA tool named NEVA-Nice Employee Virtual Attendant is an intelligent tool that assists in automating mundane tasks, compliance adherence, and Upsell. It provides cloud-based and on-premise solutions and attended and unattended server automation.
The trio, AI, ML and RPA, are separate entities, closely interconnected. As it can solve most real-world issues in a blink, they have become an inseparable helping hand in all the major businesses.

Beinex: A Great Place to Work for the Second Consecutive Time!
At Beinex, we cultivate an exceptional atmosphere for work, learning, and professional growth. Our ethos revolves around a positive culture infused with passion, creating a self-sustaining cycle of success. This unique blend makes working at Beinex both meaningful and enjoyable. The atmosphere exudes a cool vibe, where supporting and respecting each other's individuality is ingrained in our cultural fabric.
Great Place to Work Survey Scores
Our recent Trust Index© results are in, revealing an impressive score of 83! This score reflects the percentage of employees who shared positive responses (rated 4 or 5 on a 5-point scale) to the 59 statements in the survey. It serves as a testament to the trust and positivity within our workplace, showcasing the strength of our team and organizational culture.
Notably, our Trust Index© Feedback on the Credibility of Management stands tall at 85, highlighting the high level of trust and confidence our employees have in the leadership team.
The active participation and honest feedback during the survey were instrumental in achieving these outstanding scores. It's inspiring to witness the alignment of our values and the positive impact it has on the overall trust within our organization.
Here's a brief overview of the key dimensions that contributed to our success:
Respect for People:
Fairness at the Workplace:
Pride:
Camaraderie Between People:
We would also like to express our gratitude to the Great Place to Work® Institute for their rigorous assessment, helping us understand and enhance our workplace culture.
Our Journey Onwards!
Moving forward, we will continue working together to maintain and build upon this foundation of trust. Your dedication, commitment, and contributions have been instrumental in cultivating a positive workplace environment, and we are grateful for each one of you.
Let's continue our journey of success and maintain Beinex as not just a workplace but a great place to work!
About the Great Place to Work Institute
The Great Place to Work® Institute stands as a prominent global management research and consulting firm committed to empowering organisations to achieve their business objectives through the establishment of superior workplaces. Collaborating with over 10,000 organisations worldwide annually, they specialize in assisting companies in creating and sustaining High-Trust, High-PerformanceTM cultures.
During the assessment process, the institute gauged the perceptions of Beinex's employees using the Great Place to Work® Trust Index© Employee Survey. Additionally, they delved into the distinctive culture of our organisation through the Culture Brief© and Culture Audit©, offering invaluable insights that contribute to the continuous enhancement of our workplace environment.

All You Need to Know About Tableau Filters: Types of Filters in Tableau
Tableau filters allow their users to perform simple filtering using available metrics, as well as perform advanced filtering using complex calculations. While developing dashboards, Tableau offers the flexibility to view different types of filters such as drop-down filters, wildcard filters, list filters and many more. To enhance dashboard interactivity, Tableau has provided “Filter Actions” which allow users to filter an entire dashboard as per the value selected by the user in a particular visualization.
To create a filter that suits the user's requirements, Tableau engages several filtering techniques which also enhance data processing efficiency Each filter is designed for a specific function, and the order in which they are run can significantly impact performance.
6 Types of Filters in Tableau
Tableau employs six different types of filters, which are listed in the sequence of execution:
- Extract Filters
- Data Source Filters
- Context Filters
- Dimension Filters
- Measure Filters
- Table Calculation Filters
1. Extract Filters
Extract filters are utilised during the initial stage of data filtering. When datasets are uploaded to Tableau, we can utilise the extract filter to minimize the number of Tableau queries for the data source. By applying filters to the extract, we can further decrease the size of the data.
2. Data Source Filters
Data Source filters sort out any crucial or sensitive information while putting data into Tableau. It is compatible with both the Live and Extract connections.
We can add the data source filter to any column by selecting the ADD option. After selecting the ADD option, the ADD Filter dialogue box will appear, displaying all the fields. We can then select the field to which we wish to apply the filter and it is possible to change or delete data source filters as needed.
3. Context Filters
A context filter is generally used when we require this filter to be applied before any other filter. It has the potential to enhance the performance of massive data sources. They are made by dragging the dimension to the filter section box and selecting the Add to context option. This will make the dimension pill change its colour to “Grey”, indicating it is a context filter. Similarly, by clicking "Remove from Context", the filter becomes a simple dimension filter. A common use case for this filter would be when a user would like to find the top N products in any category.
4. Dimension Filters
Dimension fields include discrete categorical data, and we can remove or add the values we want to investigate. The process is simple as outlined below:
Step 1: Drag the dimensions from the dimension list to the filter section box.Step 2: From the Filter Dialog box, select the values that we want to analyze.
The Filter dialogue box contains four tabs:
- General: To select the members present in the dimension to either include or exclude
- Wildcard: To filter the result based on a particular pattern
- Condition: To filter the result based on a particular condition
- Top: To filter the Top N products belonging to a particular category.
5. Measure Filters
Measure filters are applied to the measure fields, which have quantitative data. It can be used as follows:- Drag the measured field from the Measure box to the Filter area
- Filter dialogue box with several functions will appear.
- Select the operation that needs to be performed and click Next.
In the subsequent dialog box, there are 4 types of filters:
- Range: To select the range of values to include in the result.
- At least: Select the minimum value of a measure to filter the data.
- At most: To select the maximum value of a measure to filter the data.
- Special: To select null or non-null values.
6. Table Calculation Filter
Table Calculation Filters, being the last type of filters to be executed in the sequence of execution, do not filter out the underlying data. It is mostly used to filter out contents in the current view. Table Calculations are functions that are utilised for building Calculated Fields like LOOKUP, WINDOW SUM, WINDOW AVG, and so on.Summing Up
Tableau Filters are the most commonly used feature by many organizations. It allows the clients to filter out confidential data and allows them to provide controlled view access to different internal users so that only data relevant to the user is accessed. Filtering out data means data processing becomes more efficient, which in turn makes the report generation process faster which in turn helps the organization arrive at quick and insightful business decisions.Use Cases Addendum
Let’s find out how Tableau filters work to solve various tasks :Use Case 1:
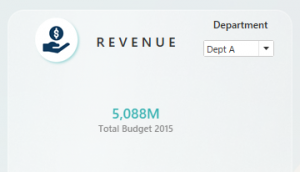

A simple drop-down filter can be used to filter the view of our requirements as shown in the visualization above.
In this example, Dept A has been selected such that the Total Budget is shown only for Dept A. Once we select Dept B, the Total Budget shows the respective value for Dept B
Use Case 2:

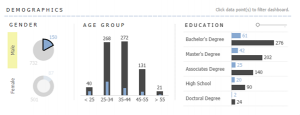
In the visualizations above, we can see the customer demographics related to gender, age group and educational status. With the help of Tableau’s Filter Actions, one can click on a particular segment and filter the rest of the visualizations as per the requirement.
For example, if we require to find how many customers in the age group of 35-44 are males, all we have to do is to click on the doughnut chart for “Male”, and the visualizations will show only the data for males. Now, we can find that the number of male customers in the age group of 35-44 is 272.
Use Case 3:
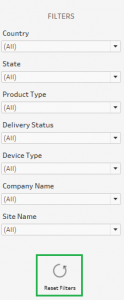
The Filter Action feature in Tableau can be leveraged to develop several creative solutions for customers. One such solution is the “Reset Filter” as shown in the above visualization.
With a combination of filters and filter actions, one can develop a reset filter that, on clicking, would reset all the currently applied filters on the dashboard and bring it back to its original unfiltered view. This comes in handy if the dashboard consists of multiple visualizations and contains heavy data.
Strategic Insights with Tableau Pulse: Real-Time Insights for Every Team
Setting Up Metrics Is a Breeze
Configuring metrics in Tableau Pulse takes just minutes. Whether it’s setting up your own custom metrics or utilizing pre-defined ones, the process is straightforward and user-friendly. And once set up, the visuals, descriptions, and insights are generated automatically, enabling team members to stay updated on performance with ease.
Pro Tip: You can also customize existing metrics to meet specific goals. For example, a custom metric was developed to track interactions generated by teams in the field, with a target of reaching a high engagement level within a set timeframe. This tailored approach has streamlined the process of monitoring performance and recognizing accomplishments.
Integrating Data into the Flow of Work
Tableau Pulse effortlessly integrates data into the tools you use daily, like Slack or email, allowing you to stay informed without disrupting your workflow. Each morning, you can start your day by reviewing the Pulse Digest in Slack, which provides a snapshot of key metrics, trends, and insights.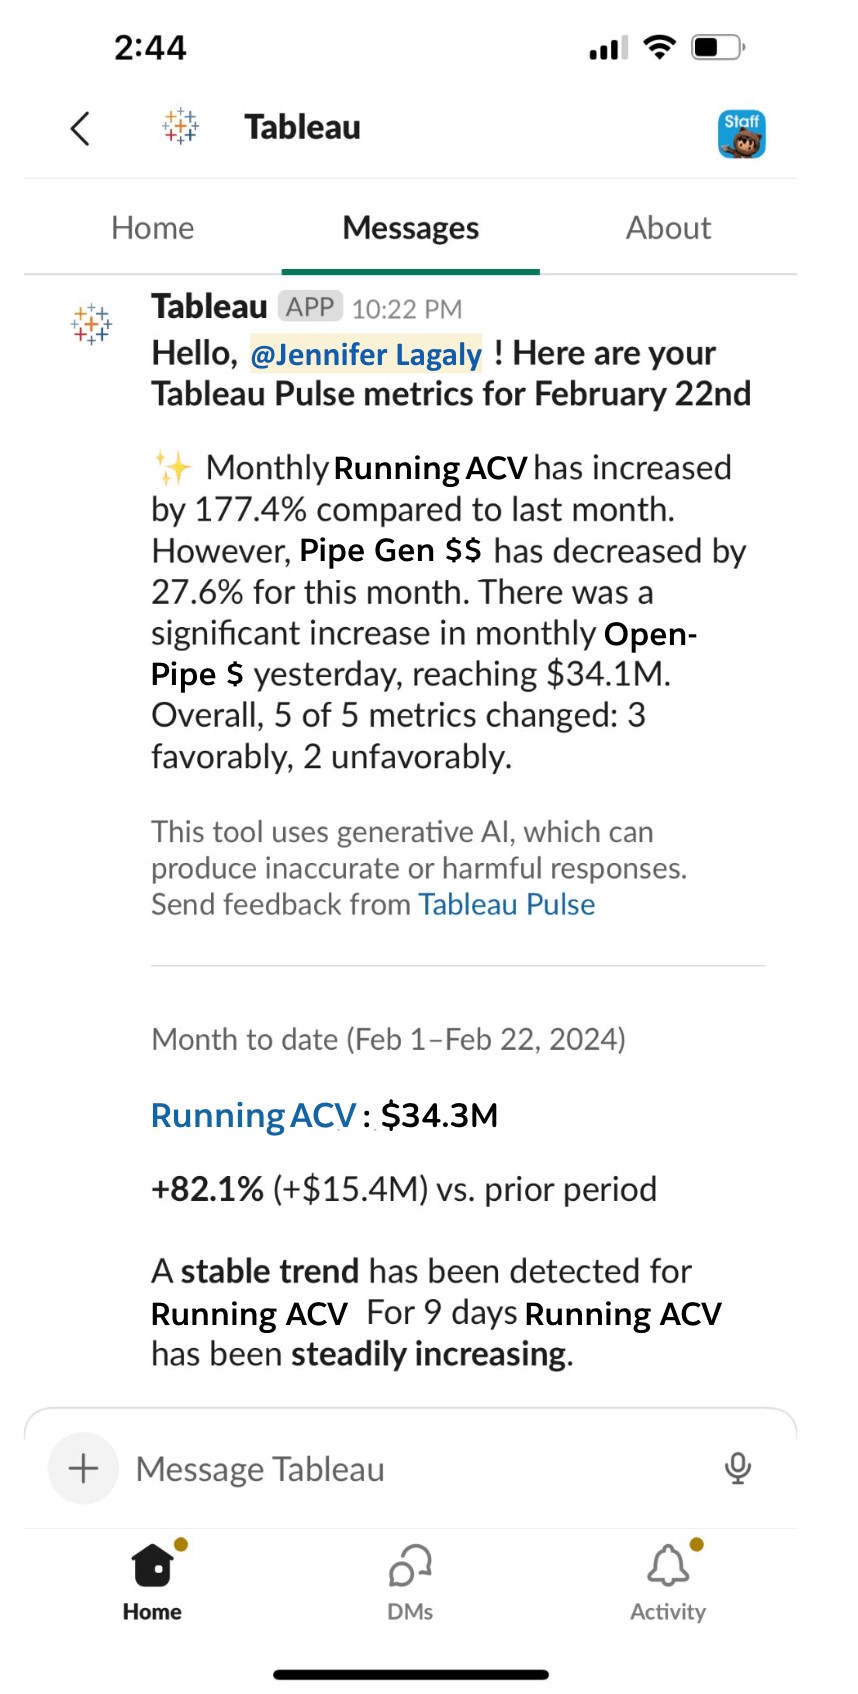 Source:https://www.tableau.com/blog/how-tableau-chief-revenue-officer-uses-tableau-pulse
Decipher Trends with Intelligent Metrics
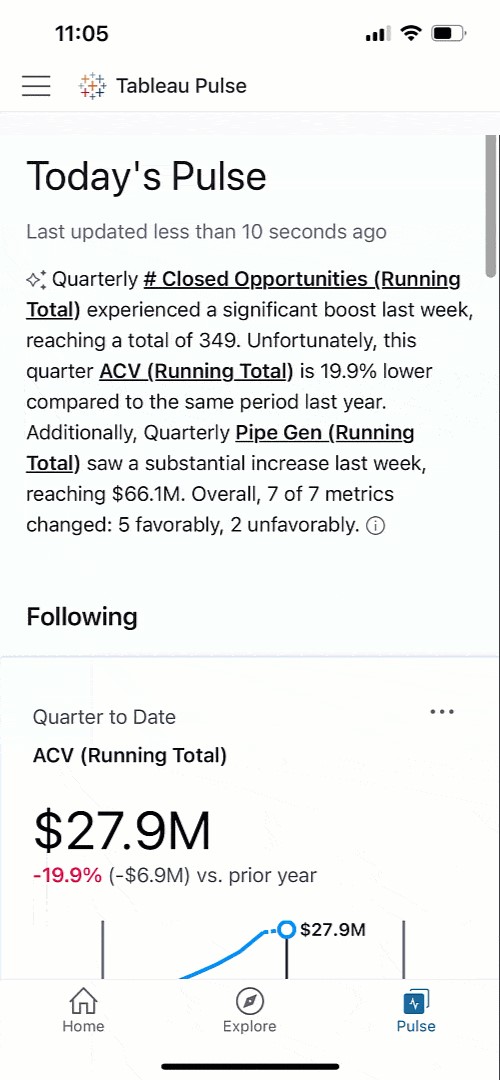
Monitoring metrics is not solely focused on tracking numbers; it also involves identifying opportunities and addressing challenges. With AI-generated summaries of key metrics like Annual Contract Value (ACV) and Pipeline Generation, Tableau Pulse helps you understand the context behind the data. The live updates ensure that any changes are reflected immediately, providing real-time insights that are always up-to-date.
Get a Clear View of Business Performance
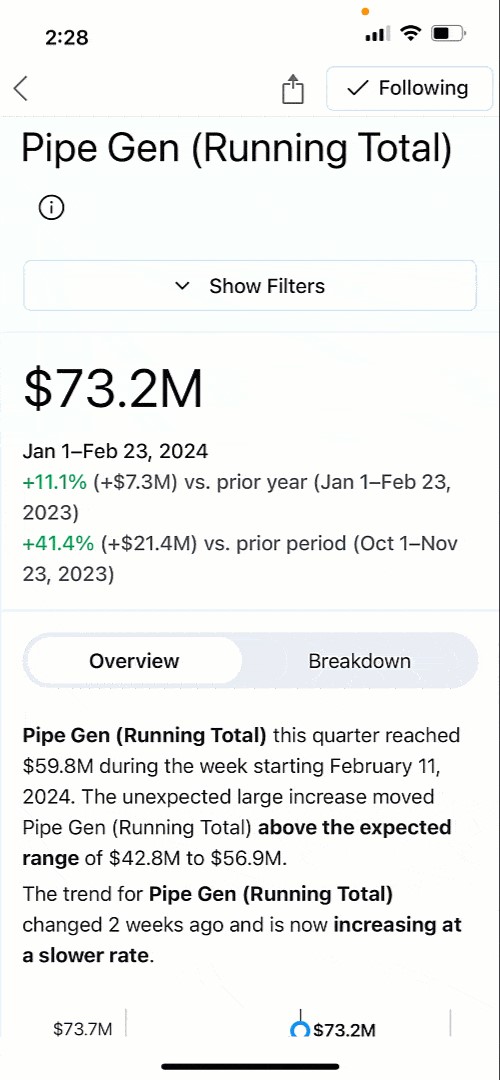
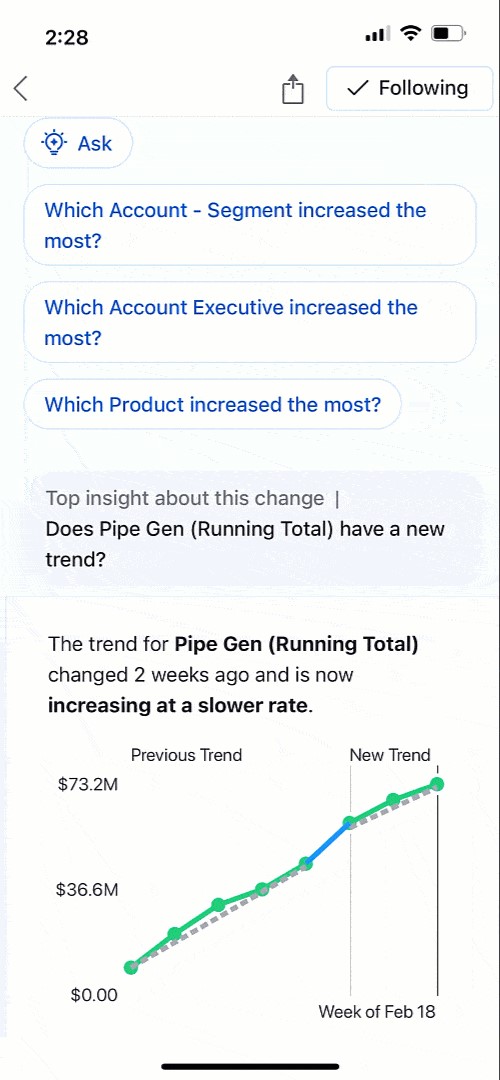
Tableau Pulse’s intuitive visualizations and natural language summaries make it easy to compare current and past performance, helping you identify areas that may need closer attention. For instance, if Pipeline Generation is up 10.9% year over year but showing signs of slowing, Pulse allows you to dig deeper, understand the cause, and take timely action to keep growth on track.
Tableau Pulse is available on mobile, and these insights are accessible wherever you are, making it easy to stay connected to your data on the go.
Analyze Business Segments with Precision
Tableau Pulse enables detailed analysis of various business segments, offering a clear view of how different teams and departments contribute to overall success. With just a click, you can explore revenue trends, track team performance, and understand the impact of different strategies across the organization.This level of analysis, which once required hours of manual work, is now at your fingertips. You can easily filter by segment, product, or deal size to gain nuanced insights that drive better decision-making.
Ask Smart, Data-Driven Questions
Powered by AI, Tableau Pulse does more than just report numbers. It actively helps you explore trends by suggesting relevant questions and providing insights in clear, understandable language. Whether it’s identifying which sales regions are thriving or where potential issues may arise, Pulse empowers you to make data-driven decisions with confidence.
Foster a Data-Driven Culture
Tableau Pulse is designed to be accessible to everyone, regardless of their level of data expertise. By integrating insights into tools like Slack, Pulse ensures that critical information is always at hand, promoting a culture of informed decision-making across the organization. This democratization of data means that every team member can contribute meaningfully to achieving our shared goals.
Tableau Pulse has truly transformed how we approach strategic decisions, placing personalized, contextually relevant insights directly in our workflow. It empowers everyone to be data-driven, aligning efforts towards achieving your company objectives and navigating the dynamic challenges of business with agility and insight.