How AI Decision-Making is Improving Enterprise Outcomes
Blog
Share 
بينكس للاستشارات تفوز بجوائز شريك العام في ALTERYX 2020 ، الشرق الأوسط
 1 December 2021
  Team Beinex
 -
-
Related Articles

Employee Churn Prediction Model: Experience Certainty in HR Matters
Many businesses make a concerted effort to create work cultures that increase job happiness, encourage people to find meaning and satisfaction in their work, reward and recognize employees for their actions, and foster both personal and professional growth.
While many tactics are adopted for the company’s benefit and to considerably increase retention, leaders cannot rely only on them. They must face the uncomfortable reality that they will eventually lose significant talent if they do not keep an open mind and a realistic outlook on the future. Influential leaders act daily to safeguard themselves, their teams, and their companies from the risk of attrition because wishful retention thinking is not a viable business strategy.
Is it possible to foresee attrition so that it only impacts the business a little less, given that it is impossible to stop employees from leaving? Well, with the help of technology, it is possible. The churn model, among others, can help in this situation. Are you wondering how? Through an employee churn prediction model, we can make it happen. After understanding which employees are on the verge of leaving using the churn model, it is possible to reach out to them and understand their grievances.
Employee Churn Prediction Model
It's a predictive model that calculates the likelihood (or vulnerability) of each employee leaving. It tells us how likely we will lose employees or a specific employee in the future at any given time. It classifies employees into two groups (classes): those who quit and those who don't. It will typically tell us the probability of the employee belonging to which of the groups in addition to placing them in one of the two groups. Thus, a churn model can be used to estimate the chances of resignation.
Explaining the Model
Modern churn models frequently draw their foundation from machine learning, more specifically from binary classification methods. There are several of these algorithms; therefore, it's important to test which one works best in each circumstance. Here we have made use of four machine learning models:
Random Forest
Supervised machine learning algorithms like random forest are frequently employed in classification and regression issues. On various samples, it constructs decision trees and uses their average for classification and majority vote for regression.
The Random Forest Algorithm's ability to handle data sets with both continuous variables, as in regression, and categorical variables, as in classification, is one of its most crucial qualities. In terms of classification issues, it delivers superior outcomes.
KNN
One of the simplest machine learning algorithms, based on the supervised learning method, is K-Nearest Neighbour. The K-NN algorithm assumes that the new case and the existing cases are comparable, and it places the latest instance in the category that is most like the existing categories.
A new data point is classified using the K-NN algorithm based on the similarities after storing all the existing data. This means new data can be quickly and accurately sorted into a suitable category using the K-NN method. Although the K-NN approach is most frequently employed for classification problems, it can also be used for regression.
Decision Tree
The supervised learning algorithms family includes the decision tree algorithm. The decision tree technique, in contrast to other supervised learning methods, can handle classification and regression issues.
By learning straightforward decision rules derived from previous data, a Decision Tree is used to build a training model that may be used to predict the class or value of the target variable (training data).
Support Vector Machine
One of the most well-liked supervised learning algorithms, Support Vector Machine, or SVM, is used to solve Classification and Regression problems. However, it is employed mainly in Machine Learning Classification issues.
The SVM algorithm's objective is to establish the best line or decision boundary that can divide n-dimensional space into classes, allowing us to quickly classify new data points in the future. A hyperplane is a name given to this optimal decision boundary.
SVM selects the extreme vectors and points that aid in creating the hyperplane. Support vectors representing these extreme instances form the basis for the SVM method.
A Step-By-Step View of the Process
Step 1: Loading data to databricks
In the initial stage, CSV data collected are loaded to the churn model. Any type of data sets can be employed here depending on the situation.
Step 2: Transformation: converting to the requisite format
While uploading, objective data sets are transformed into integers.Step 3: Feature selection
There are four feature selection algorithms from which we take the best one to filter out undesired features. The selection of filtering features differs for each type of data based on the algorithm.Step 4: Splitting the data
After the feature selection, the next step is to split the data for training and testing—then divide the data into a 7:3 ratio. In the training set, we train our model with data to understand the attrition patterns and later test it with data in the testing set.Step 5: Standardisation
In this step, data is converted into a standard format that allows for large-scale analytics.Step 6: Model selection
During model selection, datasets are provided to the machine algorithms like Random Forest, KNN, Decision tree and Support vector machine. Each algorithm produces its own sets of accuracy values; from that, the most accurate predictions are selected. Using the same procedure, we can categorize the employees into groups, for example, those who are planning to resign and those who are not.
Step 7: Result generation
The result is built on how each machine learning model performs with the dataset. The accuracy value depends on the performance of each model—the higher the accuracy, the higher the probability of accurately predicting the outcomes for each employee.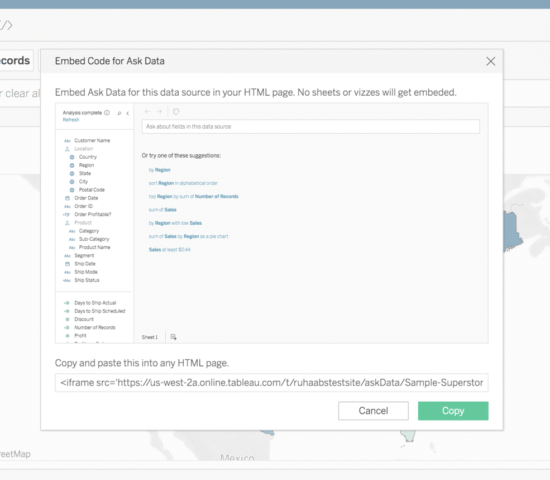
TABLEAU IS UPGRADED TO 2021.3: LET CELEBRATIONS CONTINUE FROM THE LAST QUARTER
When the sliver of thought -- that we have seen all that Tableau can do -- crosses our mind, just pay witness to a meteor shower of new features lighting the horizon up! Tableau is officially upgraded to 2021.3.
Tableau 2021.2 was a remarkable update in itself: it included ‘ask and explain data’ for viewers, allowing connected desktops, Collections, and many more valuable options and features.
So, what does the latest upgrade feature? In one go, the following list encapsulates the whole gamut of supplements:


- Improvements to Data Prep Experience
- Linked tasks
- Generate rows
- Improvements to Tableau Catalog
- Data quality warnings in subscription emails
- Inherited descriptions in web authoring
- Slack Integration
- Additional Features
- Customise the set of workbooks on the homepage
- Rename published data sources directly in Tableau Online or Server
- Authors of a flow can get alerted automatically provided any of the jobs fail and can set up an appropriate warning on the data for consumers well in advance.
- Any flow can be scheduled by customers, or they can extract refresh to run when new data arrives, saving them time and resources.
(Image 1: Linked Tasks on Tableau Prep)
Besides, Tableau Prep Conductor can generate a set of rows that are otherwise missing based on dates, date times, or integers. This is of huge importance as it allows users to fill gaps in data quite easily to ultimately ensure that processes downstream have all the requisite datasets to work on and create highly accurate and precise visualisations. Please see Image 2 for a quick understanding of the feature:
(Image 2: Generate rows on Tableau Prep)
Improvements to Tableau Catalog Next in the line comes improvements to Tableau Catalog. Two features need special mentioning:- Data quality warnings in subscription emails, and
- Inherited descriptions in web authoring
- Shared content
- Data-driven alerts
- @mention
(Image no.3)
Add to this the ability to rename published data sources directly in Tableau Online or Server on the data source page; the upgrade is a real treat to data rockstars. (See image no. 4) Practitioners point out that The REST API can also be used when changing a large number of workbooks to minimise efforts.
(Image no.4)
No need to generate a newly published data source to change the name. No need to manually change all workbooks on the Desktop to use that newly published data source, which was highly frustrating! So, welcome to Tableau 2021.3. Let us uncomplicate and perpetually so! Co-Author : Rakesh Neelakandan
Beinex Advances to Tier A Status of Dubai AI Seal: Leading with Trust and Impact in AI Excellence
Beinex has achieved a Tier A status under the prestigious Dubai AI Seal, awarded by the Dubai Centre for Artificial Intelligence (DCAI) and Dubai Future Foundation (DFF). This upgrade marks a significant advancement in Beinex's AI journey, reflecting our commitment to building trusted, responsible AI solutions that align with Dubai's vision for ethical and future-ready innovation.

Prepping the data on Tableau: Five aspects that matter
Data preparation is purging imperfectly formed data, reorganising unclean data, and merging various data sets for analysis. Rows and columns in the data structure must be changed, and data types and values must be cleaned up. The amount of time it takes to find insights directly depends on how quickly and well you prepare your data. The entire process can be sped up by being aware of the extent of the data you're studying and observing the modifications you make to the data.
With the help of Tableau Prep Builder, data can be combined, shaped, and cleaned more quickly and easily for analysis within Tableau. You can swiftly obtain high-quality data using the linear and visual approach when preparing your data.
When ushering in data into a data prep tool, it is always better to know what you're working with and whether you're looking at the complete data set or just a subset. Before you begin cleaning, you might also need to undertake some data research. Five crucial steps are to be taken care of for prepping the data.
Let's have a look:



 One technique to get beyond this obstacle is visualising the data pane in Tableau Desktop as to how it should appear. Do you have columns with the same value in several places? Should each product be in a single field with the sales transactions stated below, or should each product have its column with the sales transactions listed underneath? The latter is more likely, and a pivot is necessary for this situation.
You will be joining the data if you need to combine two tables. By using a join, you can increase the number of fields in your data source that you can investigate. Although a join can be added at any point during the data preparation process, the sooner you use it, the sooner you will comprehend the data set and identify areas that require immediate attention.
One technique to get beyond this obstacle is visualising the data pane in Tableau Desktop as to how it should appear. Do you have columns with the same value in several places? Should each product be in a single field with the sales transactions stated below, or should each product have its column with the sales transactions listed underneath? The latter is more likely, and a pivot is necessary for this situation.
You will be joining the data if you need to combine two tables. By using a join, you can increase the number of fields in your data source that you can investigate. Although a join can be added at any point during the data preparation process, the sooner you use it, the sooner you will comprehend the data set and identify areas that require immediate attention.
 Like appending two data sets together, a union enables you to do so. For instance, you might have an Excel file where each sheet displays transactions from different years. You may maintain the same structure with extra rows by using a union rather than joining the tables.
After your data has been organised, processed, and filtered, it's time to interpret what it is trying to tell you. Tableau Prep connects with your entire business intelligence platform like many other data preparation products. To allow others to begin their analysis, publish the extract to Tableau Server or Tableau Cloud. Bring it into Tableau Desktop to start posing and investigating more in-depth queries. The hardest part of the data analysis process is now complete. It's time to share the breakthroughs that resulted from your hard work.
Like appending two data sets together, a union enables you to do so. For instance, you might have an Excel file where each sheet displays transactions from different years. You may maintain the same structure with extra rows by using a union rather than joining the tables.
After your data has been organised, processed, and filtered, it's time to interpret what it is trying to tell you. Tableau Prep connects with your entire business intelligence platform like many other data preparation products. To allow others to begin their analysis, publish the extract to Tableau Server or Tableau Cloud. Bring it into Tableau Desktop to start posing and investigating more in-depth queries. The hardest part of the data analysis process is now complete. It's time to share the breakthroughs that resulted from your hard work.
1. Adjust the data sample size
To speed up your data preparation process and improve performance, you should generally only connect to a small portion of a vast data set. You might occasionally prefer to view the entire data set, and Tableau Prep enables you to do so. If a sample doesn't help you complete your data preparation task, you can try the following:
- a. Boost the size of your data sample: Adjust the sample's row count by returning to the input stage. You can add more rows or include all the data but remember that doing so might make the performance slower. Another word of caution is that utilising a specified number of rows will only return the fastest method the underlying database can find to replace the given rows.
- b. Take random sampling: Tableau Prep automatically chooses the optimal number of rows to return based on the total number of fields in the collection and the data types of those columns. The database level random sampling occurs and returns the specified number of rows. The database returns a sample after inspecting each entry. Not all data sources provide this option, which could also affect performance.
- c. Add a step filter at the input stage: You may ensure that the information pulled into your data set is pertinent to your research by including a filter at the input stage. This improves performance while providing you with a more representative sample.
2.Evaluate the data
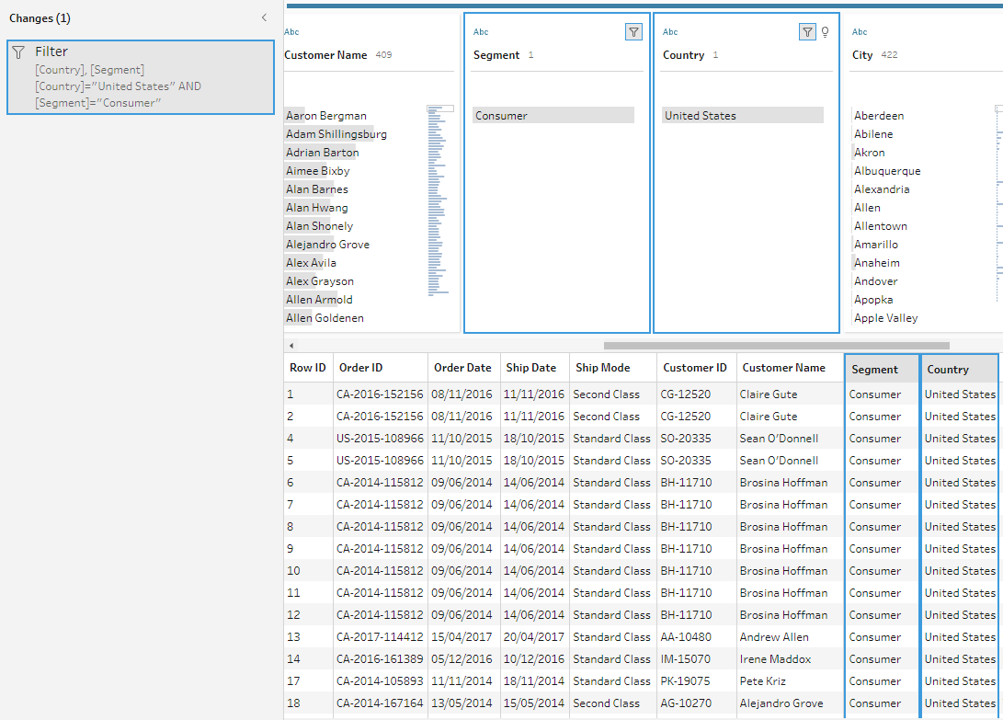
You'll probably want to start by counting the number of distinct values in each field. A simple check at the column header at the top reveals how many states are represented in the data set. You'll also want to understand how various values connect to identify data outliers or problems. You can utilise highlighting in Tableau Prep to find correlations between different fields. The data grid view is condensed to only display the records with the selected value in the chosen field when you click on a value in the profile pane. Tableau Prep highlights the corresponding values in blue, and the values span areas.
3.Filter the data
Limit the fields you import into Tableau Prep to those you'll need for your analysis to maximise the overall effectiveness of your data preparation process. By filtering your data, you can verify that you're performing the proper analysis while saving time. For instance, if you need to look at sales data from the previous two years, you may use the range or relative date filters to limit the date field to that period. You might want to eliminate any incorrect or irrelevant data. A value in the data pane can be excluded with a single click. You can do this at any time during your flow.
4.Assess and tidy up the data
Tableau's data types will have an impact on your analysis. Therefore, it's critical to correctly identify each field before beginning. Even though Tableau allows you to update aliases, alter data types, split lots, and create calculations, it is far simpler to carry out these tasks beforehand, particularly when preparing the data set for someone else. Tableau Prep includes built-in capabilities to aggregate and replace recurring characters or pronunciation, saving you from having to edit each one individually so that you don't have to; these solutions use algorithms to make cleaning easier. Or, if you foresee a missing value, you may manually add it so that it will be included when the flow processes the complete data set. You can apply a computation if you know that a field must be cleaned or filtered, but it takes more than the user interface offers.
5.Understand the data results
Deciding about the final data set's appearance while you begin to prepare your data can be difficult. For Tableau to effectively analyse your data, you might need to merge numerous data sources or pivot your data from columns to rows.
One technique to get beyond this obstacle is visualising the data pane in Tableau Desktop as to how it should appear. Do you have columns with the same value in several places? Should each product be in a single field with the sales transactions stated below, or should each product have its column with the sales transactions listed underneath? The latter is more likely, and a pivot is necessary for this situation.
You will be joining the data if you need to combine two tables. By using a join, you can increase the number of fields in your data source that you can investigate. Although a join can be added at any point during the data preparation process, the sooner you use it, the sooner you will comprehend the data set and identify areas that require immediate attention.
Like appending two data sets together, a union enables you to do so. For instance, you might have an Excel file where each sheet displays transactions from different years. You may maintain the same structure with extra rows by using a union rather than joining the tables.
After your data has been organised, processed, and filtered, it's time to interpret what it is trying to tell you. Tableau Prep connects with your entire business intelligence platform like many other data preparation products. To allow others to begin their analysis, publish the extract to Tableau Server or Tableau Cloud. Bring it into Tableau Desktop to start posing and investigating more in-depth queries. The hardest part of the data analysis process is now complete. It's time to share the breakthroughs that resulted from your hard work.Advanced Analytics: Facilitating One Giant Leap to The Future
1. Advanced Analytics in HR
HR teams always struggle with mammoth amounts of data which can be transformed into meaningful insights with the help of Advanced Analytics. The applications of Advanced Analytics can spearhead the domains of recruitment, learning and development of the employees and help manage their performance.
It can aid HR to identify the shortcomings in the existing resources and help decide to improve the skills of existing employees or hire competent new talent. The added advantage of HR analytics is that it is efficient in analysing employee performance by categorising them according to their individual calibre.
2. Advanced Analytics in Banking
Advanced Predictive Analytics has the potential to gear up the banking sector by assisting banks to adopt better strategies assessing and predicting customer behaviour. It can safeguard customer accounts from cyber-attacks and can detect fraudulent activities. Real-time alert messages are the most exclusive of the features which can shield against cyber-attacks to a big extent.
3. Advanced Analytics in Retail
The uncertain economy creates challenging scenarios for retailers. But Advanced Analytics functions act as a handy tool to make use of customer insights from the silos of data and provide a personalised and tailored marketing experience. It can be both cost saving and can unleash business growth to a great extent.
4. Advanced Analytics in Manufacturing
Manufacturing Analytics harvests revolutionary output from the manufacturing process, supply chain production, and customer delivery. The global manufacturing market is predicted to grow up to $28.5 billion by 2026 and the growth can be multiplied using the insights generated by analytics. Tools for asset management, product development, inventory management, and predictive maintenance can generate insightful options to rake in revenue amidst the limitations of the times.
5. Advanced Analytics in Finance
Financial sector produces a huge quantity of structured and unstructured data. The finance consultants or analysts should exploit this data with the help of Advanced Analytics to tackle financial troubles and to identify customer related requirements and issues. Advanced Analytics also helps to implement business plans and eliminate fraudulent activities. Financial institutions like loaning bodies, banks, trading firms, and insurance companies can improve their performance and revenue by deploying Advanced Analytics.
6. The Future of Advanced Analytics
Advanced Analytics is evolving and has become the indispensable requirement to run businesses. Due to the worldwide reception and adoption by the business community, analytics and information services sectors are predicted to have the fastest growth rate from 16% to 18% over the next five years starting 2022. As the market is getting competitive, planning and implementing strategic investments with data analytics is crucial to create new services and added revenue.
How Beinex can act as a torchbearer
Beinex has impacted and accelerated the growth of its customers and clients. With its impeccable offerings, it has partaken to build, market and expand businesses worldwide. The services provided by Beinex are enlisted below bracketed into respective domains:
• Predictive Analytics
This outstanding service offers you predictive insights to make resolutions which in turn can power your business.
• Artificial Intelligence
To cut short expenses and to attain target within a short period of time, make use of our AI tools or applications. It is beneficial to aggregate and automate data processing.
• Machine Learning
A vast quantity of data can be analysed using algorithms which can accelerate the decision-making process. With Machine Learning, specific and relevant data can be extracted and utilised to leverage businesses.
• RPA
Robotic Process Automation or software robots can accelerate digital transformation by emulating human actions. Automation of workflows, greater degree of accuracy, better productivity, high efficiency, and lesser costs are a few major takeaways from RPA which can accelerate business growth.
Conclusion
Advanced Analytics is here to stay, as organisations have started to rely on analytics more than ever before to predict business outcomes. It is sure to govern the business world as it has gained trust as a superpower which is accessible to all but chosen by only a few.