How AI Decision-Making is Improving Enterprise Outcomes
Blog
Share 
BEINEX CONSULTING WINS ALTERYX 2020 PARTNER OF YEAR AWARDS, MIDDLE EAST
 12 April 2021
  Team Beinex
 Beinex Consulting has been awarded as the Alteryx 2020 Partner of the Year, Middle East at the Alteryx Partner Summit and Awards virtual event along with 15 other winners from North America, LATAM, and EMEA.
 During the Alteryx Summit, ‘Your Road to Revenue’, Alteryx celebrated the achievements and commitment of their partners to the Alteryx business and its customers. Beinex Consulting was awarded on the level of engagement in the Alteryx partner program and its efforts around driving innovation, growing revenue, and empowering Alteryx customers to solve our world’s most pressing business and societal issues in the Middle East Region.
Selected among top Middle East Alteryx partners, Beinex demonstrated excellence in delivering end-to-end analytics transformation services that revolutionised multiple industries in the Middle East.
Beinex Consulting Founder and Managing Director, Indumon Das indicates further growth for the digital transformation organisation soon: “Beinex continues to make strategic investments to enhance our association with Alteryx and clients in major Middle East markets. This award is a recognition to our continuous growth strategy and focus to be the best Middle East partner”
“Through their ongoing pledge to the Alteryx Partner Program, our partners have demonstrated their commitment to helping Alteryx customers break down barriers and deliver game-changing insights.” – Josh Lewis, VP, Global Channels, Alteryx
About Beinex Consulting
Beinex is a digital transformation organization with a broad range of analytics modernization and training services. As a pioneer in analytics and cloud transformation, Beinex’s mission is to transform the way individuals and the organizations work with the data through innovation and experience. Beinex offers a broad range of robust and scalable business intelligence and analytics services to drive effective decision-making and create business value.
During the Alteryx Summit, ‘Your Road to Revenue’, Alteryx celebrated the achievements and commitment of their partners to the Alteryx business and its customers. Beinex Consulting was awarded on the level of engagement in the Alteryx partner program and its efforts around driving innovation, growing revenue, and empowering Alteryx customers to solve our world’s most pressing business and societal issues in the Middle East Region.
Selected among top Middle East Alteryx partners, Beinex demonstrated excellence in delivering end-to-end analytics transformation services that revolutionised multiple industries in the Middle East.
Beinex Consulting Founder and Managing Director, Indumon Das indicates further growth for the digital transformation organisation soon: “Beinex continues to make strategic investments to enhance our association with Alteryx and clients in major Middle East markets. This award is a recognition to our continuous growth strategy and focus to be the best Middle East partner”
“Through their ongoing pledge to the Alteryx Partner Program, our partners have demonstrated their commitment to helping Alteryx customers break down barriers and deliver game-changing insights.” – Josh Lewis, VP, Global Channels, Alteryx
About Beinex Consulting
Beinex is a digital transformation organization with a broad range of analytics modernization and training services. As a pioneer in analytics and cloud transformation, Beinex’s mission is to transform the way individuals and the organizations work with the data through innovation and experience. Beinex offers a broad range of robust and scalable business intelligence and analytics services to drive effective decision-making and create business value.

During the Alteryx Summit, ‘Your Road to Revenue’, Alteryx celebrated the achievements and commitment of their partners to the Alteryx business and its customers. Beinex Consulting was awarded on the level of engagement in the Alteryx partner program and its efforts around driving innovation, growing revenue, and empowering Alteryx customers to solve our world’s most pressing business and societal issues in the Middle East Region.
Selected among top Middle East Alteryx partners, Beinex demonstrated excellence in delivering end-to-end analytics transformation services that revolutionised multiple industries in the Middle East.
Beinex Consulting Founder and Managing Director, Indumon Das indicates further growth for the digital transformation organisation soon: “Beinex continues to make strategic investments to enhance our association with Alteryx and clients in major Middle East markets. This award is a recognition to our continuous growth strategy and focus to be the best Middle East partner”
“Through their ongoing pledge to the Alteryx Partner Program, our partners have demonstrated their commitment to helping Alteryx customers break down barriers and deliver game-changing insights.” – Josh Lewis, VP, Global Channels, Alteryx
About Beinex Consulting
Beinex is a digital transformation organization with a broad range of analytics modernization and training services. As a pioneer in analytics and cloud transformation, Beinex’s mission is to transform the way individuals and the organizations work with the data through innovation and experience. Beinex offers a broad range of robust and scalable business intelligence and analytics services to drive effective decision-making and create business value.
We are thrilled to recognize Beinex Consulting for being named Alteryx Middle East Partner of the Year!https://t.co/xwmp7HbsMp#TogetherWeSolve pic.twitter.com/4zic9mdlgD
— Alteryx (@alteryx) October 1, 2020
-
Related Articles

Alteryx Data Preparation: A Key to Successful Data Analytics
Why is Data Preparation Important?
Imagine building a house on a foundation of sand. No matter how impressive the blueprints or construction materials, the structure will be unstable. The same principle applies to data analysis. Inaccurate or incomplete data leads to flawed insights and potentially disastrous business decisions.
Here's how meticulous data preparation benefits organizations:
The Data Preparation Journey: A Step-by-Step Guide
While the specific steps may vary depending on the project, a typical data preparation process involves:
- Acquiring Data: This involves identifying the necessary data, gathering it from various sources (databases, spreadsheets, etc.), and establishing secure, consistent access.
- Exploring Data: Understanding the data's structure and quality is crucial. Analysts use data profiling techniques and visual analytics to analyze data distribution, identify missing values, and uncover potential anomalies.
- Cleansing Data: This is where the magic happens – correcting errors, removing duplicates and outliers, and filling in missing data points to ensure data integrity.
- Transforming Data: Data may need formatting, restructuring, or aggregation to be suitable for the intended analysis. This could involve converting date formats, pivoting tables, or calculating new variables.
Data Preparation for the Age of Big Data and Machine Learning
The rise of Big Data and machine learning has further amplified the significance of data preparation. Machine learning algorithms rely heavily on vast amounts of clean, structured data to learn and make accurate predictions.
The Challenge: Extracting value from Big Data often involves integrating data from diverse sources, each with its own structure and quality issues. Traditional data preparation methods become time-consuming and inefficient when dealing with such massive datasets.
The Solution: Modern data preparation tools like Alteryx offer a solution.
The Power of Alteryx Data Preparation
The Alteryx Analytics Automation Platform streamlines the entire data preparation process, empowering a wide range of users – data analysts, data scientists, and even citizen data scientists – to transform raw data into actionable insights. Here's how Alteryx tackles the data preparation challenge:
Key Alteryx Features for Data Preparation:
Ready to Experience the Beinex -Alteryx Advantage?
Beinex’s premier partnership with Alteryx helps us enable business users to perform mundane tasks of manual data cleansing and transformation in just minutes by automating the process in a simple visual workflow that also covers advanced and predictive analytics. Thousands of organizations globally use Alteryx to deliver quick wins and high-impact business outcomes. Beinex's Alteryx consulting services amplify the transformative potential, providing tailored expertise to ensure maximum value extraction from Alteryx's powerful capabilities.

Accelerating Digital Transformation with Data and Design: Manufacturing Transformation
The impact of digital manufacturing transformation on businesses, their suppliers, customers, and other third parties is enormous. Whether you're selling precision machinery or building materials online, technology can help you in various ways. Digital technologies assist manufacturers in improving operational efficiencies and optimising multiple business areas, from product development to supply chain management.
Advanced manufacturing technologies provide numerous benefits, such as assisting companies in unlocking digital business models, adapting to changes faster, and even anticipating changes before they occur - all of which are critical to manufacturing. It's not surprising that IDC predicts that by the end of 2022, half of all manufacturers will have invested in intelligent manufacturing through improved resilience, data analytics, and artificial intelligence.
A few of the benefits are given below:
- Increased operational efficiency, reduced costs, and enhanced revenue
- Improved standard of manufactured goods
- Enhanced customer experience (e.g., streamline the ordering process)
- Improved decision-making abilities
- Ability to rapidly respond to changes in customer demands and the market.
Because of uncertainty in the global, economic, and policy landscapes, the state of manufacturing is constantly changing. The wide range of technological advances also potentially disrupts the industry. Five G (5G) network capabilities, a push for IoT, Industry 4.0, machine learning, and data-driven predictive analytics—all these aspects impact manufacturing.
The Advantages of Manufacturing Digitization
As digital technologies evolve around us, manufacturing companies are increasingly faced with a choice: increase their digitisation efforts or stick with tried-and-true methods.
Digital manufacturing transformation adds a lot of value to the manufacturing sector in the long run by reactivating many benefits, such as:
Improved data utilisation
Manufacturing digitisation is about optimising data usage in operations, and manufacturers can use data more effectively by feeding it into their B2B eCommerce, ERP, CRM, finance, warehousing, and other systems.
Process enhancements
Manufacturing operations could be revolutionised by digital transformation. Real-time insights, for example, can help monitor, resolve, and even predict situations to optimise machinery lifecycles—these aid in maintaining error-free operations and avoiding costly rework and disruptions.
Increased creativity
Because innovation breeds innovation, a digital transformation strategy in manufacturing lays the groundwork for a comprehensive optimisation approach. Deploying automated innovative factory capabilities in your ERP, for example, can help you improve business performance and the supply chain.
Better outsourcing
Manufacturers can avoid disruptions and risks associated with rushed solutions by implementing remote monitoring, troubleshooting, proactive maintenance, and data at their fingertips.
Customer-centricity
Manufacturers can provide more value to customers by launching a B2B eCommerce platform with separate portals for regions, brands, or clients. Furthermore, manufacturers can use sales data to accurately predict customer demand cycles and adjust production accordingly.
Manufacturing in the cloud
While the production of physical goods appears to be restricted to the realm of the tangible, expanding the use of cloud-based architecture has several benefits for businesses. Agile development is made possible by software that is cloud agnostic, which eliminates the requirement for massive legacy systems.
The demand for data has increased as the Internet of Things (IoT) is used more often. For enterprises to function effectively, systems must be able to store enormous volumes of data and process it fast without any downtime or risk of data loss.
Well-researched and executed, cloud-based systems provide manufacturers with special advantages. Production can go on with or without workers thanks to remote operations. Every stage of production is automated in a holistically planned system, eliminating the possibility of error.
Cloud manufacturing and manufacturing-as-a-service (MaaS)
Manufacturing-as-a-service (MaaS) companies work as independent contractors, producing goods for the companies who hire them while splitting the cost of software, equipment, maintenance, and repairs. It improves efficiency and increases capacity utilisation; a facility that is open around-the-clock is much more productive and effective. A MaaS company might benefit from day-to-day operations by taking on production for a variety of businesses.
For the companies using MaaS organisations, automated digital processes are also an excellent instrument for growth into larger product volumes and new product lines without spending more money on infrastructure and facilities.
Resilience
Resilience is essential to succeeding in challenging business situations. Although operations are resilient, adaptation is essential for long-term success. To stay ahead of the competition, manufacturers need to be able to foresee problems and find solutions.
By utilising adaptable automation, executing remotely, and tying the supply chain together with a cloud-based infrastructure, digital technologies support manufacturers.
Green Thinking
As consumers' demands for eco-friendly activities grow, technology advances to supply solutions. Machines that are controlled by AI are more efficient and use less energy. Increasing efficiency frequently encourages less material consumption as well. The ecosystem benefits greatly from less resource use.
Lower Costs, Higher Margins
Costs for manufacturers are reduced by digital transformation. With the help of the Internet of Things (IoT), manufacturers can more quickly identify and fix problems. Manufacturers can gain from connected machinery's range of advantages, including the ability to diagnose issues before they develop and schedule maintenance for increases in output.
To overcome current obstacles, switch to cloud-based digital manufacturing, and take advantage of the many benefits that are accessible, a platform ecosystem that adapts to demands rather than existing software is required.

Master Data Visualization with Tableau Public: A Guide to Success
Tableau Public Login
1. Sign Up for an Account Head over to Tableau Public and create a free account. After signing in, you’ll have access to your profile hub, where you can manage and create new visualizations, also known as vizzes in the Tableau Community. 2. Create a Visualization Click on “Create a Viz” from your profile hub, and you’ll be taken to Tableau’s interface, where you can connect to data sources, build your visualizations, and customize them as needed. 3. Publish Your Work Once your visualization is ready, click “Publish As” to share it. This step ensures that your work is stored in the Tableau Public free data visualization software, making it accessible to a global audience.
How to Download Tableau Public: Free & User-friendly
If you’re eager to start, Tableau Public download is free. Here’s how to get started: • Visit the official Tableau Public download page. • Click on the “Download” button to get the latest version. • Install the software and sign in using your Tableau Public login credentials. • Start exploring data visualization with Tableau Public free download. With Tableau Public tutorial resources available online, you can quickly learn how to leverage its features for impactful storytelling.Master Data Visualization: Best Practices for Creating Visualizations on Tableau Public
1. Craft Clear and Informative Titles A well-thought-out title is crucial for any visualization. It should succinctly describe the content while giving viewers a clear understanding of what to expect. A good title helps set the context for your data story. 2. Choose the Right Visual Encodings The effectiveness of your visualization relies heavily on selecting appropriate chart types and encodings. Whether it’s position, length, or color, choosing the right visual elements ensures that your data is represented accurately and clearly. 3. Ensure Effective Labeling Labels make your visualization easier to interpret. Be sure to label axes clearly and add data labels where necessary, so your audience doesn’t need to guess or spend extra time understanding the data. 4. Select the Most Suitable Chart Types Not all charts are created equal—each has its strengths for different types of data. Bar charts are ideal for category comparisons, while scatter plots are great for showing relationships between variables. Picking the right chart type is crucial for delivering your message effectively. 5. Use Reader-Friendly Formatting Well-formatted visualizations are more likely to resonate with viewers. Use appropriate font sizes, colors, and layout elements to ensure that your visualization is not only aesthetically pleasing but also easy to read and comprehend. 6. Incorporate Filters and Parameters Tableau Public’s interactive features, such as filters and parameters, allow users to engage more deeply with your visualization by customizing their view. Thoughtful use of these tools can enhance the user experience. 7. Limit Annotations Annotations can add helpful context or clarification, but they should be used sparingly to avoid overcrowding your visualization. Only include annotations when they provide meaningful insights or explanations. 8. Utilize Tableau’s Built-in Formatting Tools Tableau Public provides a variety of formatting options that help polish your visualizations. Take advantage of these tools to make your work look professional and visually appealing. 9. Share Your Visualizations Publicly Once you’ve completed your work, sharing it on Tableau Public allows you to contribute to the larger data community. You can also embed your visualizations on websites or blogs, helping you build your personal portfolio.
Building a Strong Tableau Public Portfolio
To stand out in the Tableau Public community, it’s important to curate a portfolio that reflects your skills and versatility. Here are a few tips: 1. Highlight Your Best Work Showcase the visualizations that demonstrate your strongest skills and align with your career interests. These projects should reflect the kind of work you excel at and wish to pursue. 2. Maintain a Clean, Organized Layout A well-organized portfolio enhances the viewing experience. Ensure that your visualizations are easy to navigate, and avoid cluttered or confusing layouts. 3. Use High-Quality Visuals Always use high-resolution images or graphics when showcasing your work. Poor-quality visuals can give a negative impression and may not reflect your actual abilities. 4. Provide Clear Descriptions Accompany your visualizations with concise descriptions. Explain the purpose of each project, the data source, the analytical methods used, and any challenges you encountered. 5. Show a Variety of Work Include a diverse range of projects in your portfolio to highlight your versatility. This demonstrates your ability to adapt to different data sets and visualization types. 6. Keep Your Portfolio Updated Regularly update your portfolio with your latest work to show your ongoing development and progress in data visualization. 7. Seek Constructive Feedback Asking for feedback from peers or mentors can help you identify areas for improvement and refine your portfolio for better presentation. 8. Engage with the Tableau Community Tableau Public isn’t just a tool—it's a thriving community. Engage with other users by liking, commenting, and participating in forums and challenges. It’s a great way to learn, share, and grow alongside other data enthusiasts.
Conclusion
Tableau Public is a powerful platform that offers more than just free data visualization tools, it’s a gateway to learning, growth, and professional opportunities. By following these best practices, you can create compelling and impactful visualizations while engaging with a vibrant community of data professionals. Whether you’re looking to advance your career or simply improve your data skills, Tableau Public provides the perfect platform to explore, create, and share. Connect with us a for a free demo: https://beinex.com/free-tableau-software/

Cohort Retention Analysis in Tableau
To start, access the Superstore Dataset, available for download on Kaggle. Use Tableau Public to connect to this dataset and explore the rows and columns to understand the documented data related to the Superstore. This exploration sets the stage for the subsequent cohort retention analysis.
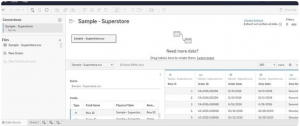 Move over to the Sheet 1 tab; this will serve as your dedicated workspace where you'll craft your visualizations. This area will be your canvas to build and design the subsequent analyses and visual representations.

To perform cohort analysis effectively, specific data points are necessary:
Unique Identifier: Utilize the Customer ID as the unique identifier for each customer.
First Purchase Date: This marks the date when a customer made their initial purchase, a pivotal point for creating cohort groups.
Revenue Data: Information regarding the financial aspect of each transaction.
Creating Calculated Fields
One crucial calculated field needed is the "Customers’ First Purchase Date (quarter)." Since the dataset doesn't contain the first purchase date field, a calculated field is essential. This field is derived from computations based on existing data in the dataset, enabling the identification of when each customer made their initial purchase. Calculated fields are instrumental in manipulating and analyzing data by performing calculations based on existing dataset information.

To create quarter and year cohorts based on the customers' first purchase date:
Defining Cohorts: In this dataset spanning four years (2014–2017), cohorts will be based on the quarter and year when customers made their initial purchase. This approach ensures a manageable cohort table for analysis.Calculation for Quarter Identification: The calculation to establish the quarter in which a customer made their first purchase involves determining the quarter and year from the purchase date.
This calculation utilizes the 'DATETRUNC' function to extract the quarter from the 'First Purchase Date' field, aligning customers based on the quarter they made their initial purchase.
Flexibility in Cohort Creation: While quarters and years are chosen for cohort segmentation in this scenario, other time parameters like days, weeks, or months could also be used for cohort creation, depending on the dataset and analytical objectives. However, for this particular dataset, quarters and years were deemed more practical for effective analysis.
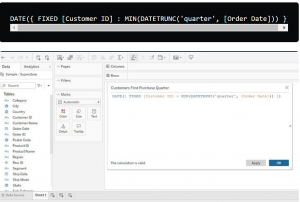
Assembling the cohort retention table involves using the calculated fields previously created to form a comprehensive table that illustrates cohort-based metrics, particularly the number of unique customers per first quarter and the retention rate.
Here's how to assemble the cohort table:


This formula divides the count of unique customers by the total number of customers from the first quarter, providing the retention rate for each subsequent period.
This table allows for a clear visualization of how customer retention varies across different cohorts over subsequent periods, providing insights into the effectiveness of retaining customers acquired in specific quarters.
This step-by-step guide is incredibly detailed for constructing the cohort table in Tableau. It breaks down the process systematically, ensuring proper visualization of the cohort analysis.
Interpreting the retention rates from this table involves examining both the rows and columns:
Rows (First and Second Columns): Here, you'll find different year and quarter groups representing cohorts, along with the count of customers who made their first purchase in each respective period.Columns (Third Column): As you move across the table, you'll encounter the percentages indicating how many customers continued making purchases at the Superstore across subsequent quarters after their initial purchase.
For instance, if 160 customers made their first purchase in 2014 Q2, you'd observe that 24.4% returned to make purchases in 2014 Q3, and 36.3% made purchases in 2014 Q4. This trend continues across the subsequent periods.
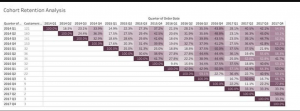 In conclusion, creating calculated fields is an essential part of conducting cohort analysis in Tableau. It involves utilizing functions effectively. If you're new to Tableau functions, exploring articles or resources on Tableau functions could fill any knowledge gaps and provide a deeper understanding of their usage in data analysis and visualization. The provided Tableau article on functions might be particularly helpful for a more comprehensive understanding.
RUNNING THE MIGHTY SMALL LANGUAGE MODEL PHI-3 ON SNOWFLAKE
What is an SLM?
A Small Language Model (SLM) is tailored to excel in simpler tasks, offering boosted accessibility and user-friendliness for organizations operating with limited resources. Besides, they can be readily fine-tuned to align with specific requirements. Small language models are particularly well-suited for organizations aiming to develop applications capable of operating local devices instead of relying on cloud infrastructure. They are especially beneficial for tasks that do not necessitate extensive reasoning or immediate responses.
Reasons to use SLMs
Given the growing popularity and applicability of SLMs across various domains, particularly in areas like sustainability and the volume of data required for training, there are multiple reasons for employing them.
What is Phi-3?
Microsoft has a suite of small language models (SLMs) known as 'Phi,' demonstrating outstanding performance across various benchmarks. Microsoft's recent release is Phi-3, a series of open AI models. The Phi-3 models represent a prototype of capability and cost-effectiveness among small language models (SLMs), exceeding models of equivalent and larger sizes across the spectrum of coding, language, reasoning, and mathematical standards. This launch broadens the array of high-calibre models accessible to customers, providing them with more practical options as they craft and construct generative AI applications.
Phi-3-mini, a 3.8B language model, is accessible through Microsoft Azure AI Studio, Hugging Face, and Ollama. It is offered in two context-length variations—4K and 128K tokens. Notably, it is the first model within its category to support a context window of up to 128K tokens with minimal impact on quality. Furthermore, it is instruction-tuned, implying that it has been trained to comprehend and adhere to diverse instructions, mirroring natural human communication patterns. This ensures that the model is readily deployable straight out of the box. Phi-3-mini is available on Azure AI to leverage the deploy-eval-finetune toolchain, and it is also accessible on Ollama for developers to execute locally on their laptops.
Features of Phi-3
Phi-3 models exhibit distinctive superiority over language models of comparable and larger dimensions on key benchmarks, showcasing the following features:
Snowflake meets Phi-3: Advantages
The key pain point about LLMs is the computing required to host and run them. Setting up a dozen GPUs to run models can be expensive and complex. There's where Snowflake steps up. Snowflake's compute pool option enables users to easily and quickly set up and manage compute clusters. Phi-3 comes into the picture because of its cost-effective GPU utilization.
Can you imagine a situation where your language model only requires less than 3GB of GPU memory for inference? Well, now it's possible, all thanks to Phi-3. It's a state-of-the-art SLM that produces excellent results over GP3.5 and Mistral 8x7B, which are much bigger models. This opens the door for more cost-effective solutions to be brought up in the AI space. Add Snowflake for hosting; you have an excellent setup to host, test, and build AI applications. Read below how Beinex managed to run Phi-3 on Day 0 in Snowflake.
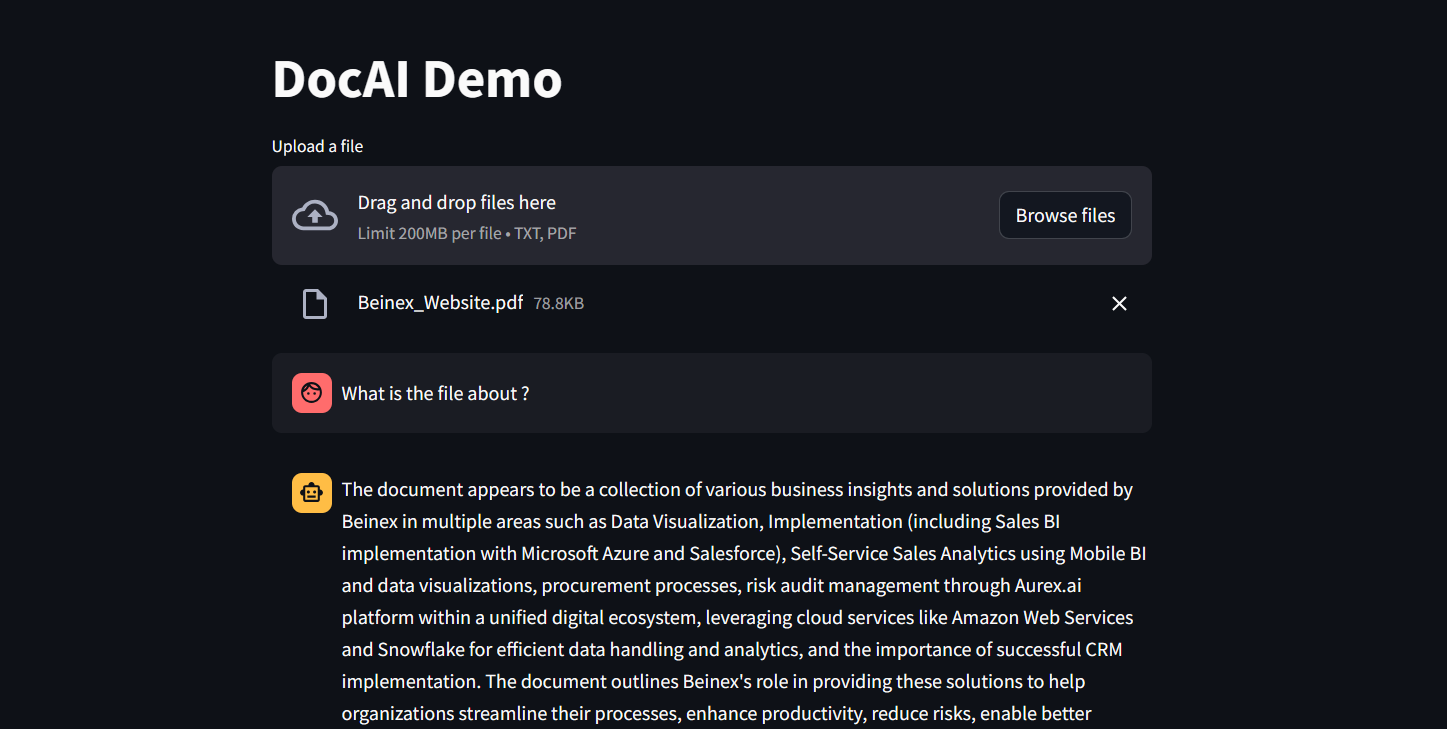 Figure 1: DocAI running on Phi-3
Implementing Phi-3 on Snowflake: What Beinex Did and How Beinex Did it?
Beinex has seamlessly integrated Phi-3 into Snowflake to help enterprises unlock their data's full potential through advanced language processing capabilities and enhance decision-making with deeper insights. The integration facilitates Snowflake users to:
Here's a detailed guide on implementing Phi-3 on Snowflake:
Step 1: Create Necessary Objects
-- Run by ACCOUNTADMIN to allow connecting to Hugging Face to download the model
-- Stage to store LLM models
CREATE STAGE <stagename> IF NOT EXISTS models
DIRECTORY = (ENABLE = TRUE)
ENCRYPTION = (TYPE='SNOWFLAKE_SSE');
-- Stage to store YAML specs
CREATE STAGE <stagename> IF NOT EXISTS specs
DIRECTORY = (ENABLE = TRUE)
ENCRYPTION = (TYPE='SNOWFLAKE_SSE');
-- Image repository
CREATE OR REPLACE IMAGE REPOSITORY images;
-- Compute pool to run containers
CREATE COMPUTE POOL GPU_NV_S
MIN_NODES = 1
MAX_NODES = 1
INSTANCE_FAMILY = GPU_NV_S;
Step 2: Docker Image Code - ollama
FROM ollama/ollama
RUN $(ollama serve > output.log 2>&1 &) && sleep 10 && ollama pull phi3 && pkill ollama && rm output.log
ENTRYPOINT ["ollama"]
CMD ["serve"]
Step 3: Tag and Push the Docker Image
docker tag ollama <SNOW_ORG-SNOW_ACCOUNT>.registry.snowflakecomputing.com/db/schema/image respository /ollama
docker push <SNOW_ORG-SNOW_ACCOUNT>.registry.snowflakecomputing.com db/schema/image repository /ollama
Step 4: Docker Image - UDF
FROM python:3.11
WORKDIR /app
ADD ./requirements.txt /app/
RUN pip install --no-cache-dir -r requirements.txt
ADD ./ /app
EXPOSE 5000
ENV FLASK_APP=app
CMD ["flask", "run", "--host=0.0.0.0"]
App.py content is given below :
from flask import Flask, request, Response, jsonify
import logging
import re
import os
from openai import OpenAI
client = OpenAI(
base_url='http://ollama:11434/v1',
api_key="EMPTY",
)
model = "phi3"
app = Flask(__name__)
app.logger.setLevel(logging.ERROR)
def extract_json_from_string(s):
logging.info(f"Extracting JSON from string: {s}")
# Use a regular expression to find a JSON-like string
matches = re.findall(r"\{[^{}]*\}", s)
if matches:
# Return the first match (assuming there's only one JSON object embedded)
return matches[0]
# Return the original string if no JSON object is found
return s
@app.route("/", methods=["POST"])
def udf():
try:
request_data: dict = request.get_json(force=True) # type: ignore
return_data = []
for index, col1 in request_data["data"]:
completion = client.chat.completions.create(
model=model,
messages=[
{
"role": "system",
"content": "You are a bot to help extract data and should give professional responses",
},
{"role": "user", "content": col1},
],
)
return_data.append(
[index, extract_json_from_string(completion.choices[0].message.content)]
)
return jsonify({"data": return_data})
except Exception as e:
app.logger.exception(e)
return jsonify(str(e)), 500
Step 6: YAML File
spec:
containers:
- name: ollama
image: <SNOW_ORG-SNOW_ACCOUNT>.registry.snowflakecomputing.com/ db/schema/image respository /Phi3
resources:
requests:
nvidia.com/gpu: 1
limits:
nvidia.com/gpu: 1
env:
NUM_GPU: 1
MAX_GPU_MEMORY: 24Gib
volumeMounts:
- name: llm-workspace
mountPath: /<stage name>
- name: udf
image: <SNOW_ORG-SNOW_ACCOUNT>.registry.snowflakecomputing.com/ db/schema/image respository /ollama_udf
endpoints:
- name: chat
port: 5000
public: false
- name: llm
port: 11434
public: false
volumes:
- name: llm-workspace
source: "@<llm stage_name>"
Step 7: Upload YAML File and Create Service
Upload the YAML file to the created stage, where the stage name in the YAML file should match the stage created in Step 2.
-- Create service
create service phi3
IN COMPUTE POOL <name of compute pool created>
FROM @dash_stage
SPECIFICATION_FILE = '<name of yaml file uploaded>';
Step 8: Create Service Function
Create a service function on the service (after it starts).
create or replace function phi3chat(prompt text)
returns text
service= phi3
endpoint=chat;
Check Service Status
Use the following command to check the status of the service:
SELECT
v.value:containerName::varchar container_name,
v.value:status::varchar status,
v.value:message::varchar message
FROM (
SELECT parse_json(system$get_service_status('<service name>'))
) t,
LATERAL FLATTEN(input => t.$1) v;
Benefits of Running Phi-3 on Snowflake
1. Cost-Effectiveness and Efficiency:
2. Compatibility with Smaller GPUs:
3. Exceptional Performance:
4. Faster Response Times:
SLM vs LLM
The choice between small and large language models hinges on organizational needs, task complexity, and resource availability.
LLMs excel in applications requiring the orchestration of intricate tasks, encompassing advanced reasoning, data analysis, and contextual comprehension.
On the other hand, SLMs present viable options for regulated industries and sectors facing scenarios necessitating top-tier results while maintaining data within their premises.
Both large and small language models possess distinct strengths and applications. While large language models thrive in managing complex workflows, small language models deliver impressive performance despite their compact size.
While some customers may exclusively require small models, others may favour larger models, with many seeking to integrate both types in various configurations. Ultimately, the optimal selection depends on the unique context and objectives of the organization. Besides transitioning from large to small models, the trend is evolving towards a diversified portfolio of models. This means that instead of relying on a single model, customers can choose from various models with different sizes, capabilities, and resource requirements. This empowers customers to decide the best model for their scenario, balancing performance and resource constraints.