How AI Decision-Making is Improving Enterprise Outcomes
Blog
Share 
Beinex Advances to Tier A Status of Dubai AI Seal: Leading with Trust and Impact in AI Excellence
Beinex has achieved a Tier A status under the prestigious Dubai AI Seal, awarded by the Dubai Centre for Artificial Intelligence (DCAI) and Dubai Future Foundation (DFF). This upgrade marks a significant advancement in Beinex's AI journey, reflecting our commitment to building trusted, responsible AI solutions that align with Dubai's vision for ethical and future-ready innovation.
What is Dubai AI Seal?
An official validation for trusted AI companies operating with the public sector of Dubai, Dubai AI Seal is aimed at establishing the city as a global leader in Artificial Intelligence. The AI Seal confirms the credibility of AI providers, ensuring they deploy AI technologies responsibly, securely, and transparently while delivering tangible economic and societal value.
Introduced as a verification system by DCAI, the AI Seal aims to safeguard organizations by eliminating AI washing and enforcing accountability throughout AI deployment.
The Dubai AI Seal follows a six-tier certification framework-Tier E, D, C, B, A, and S (highest) - designed to endorse organizations based on their AI maturity and contributions to Dubai's AI ecosystem.
Shantosh Sridhar, CEO of Beinex Consulting, said, “Advancing to Tier A of the Dubai AI Seal marks an important step in Beinex's AI journey, reinforcing our continuous commitment to building trusted, AI-powered solutions. Dubai's approach to AI mirrors ours, focusing on real impact and measurable outcomes. We see this recognition not only as an achievement but as an opportunity to actively support Dubai's ambition and help accelerate its journey toward becoming a global AI leader.”
The upgrade to Tier A positions Beinex among the leading contributors to the region's AI industry, reflecting a substantial economic impact and a demonstrated commitment to advancing responsible, high-value AI solutions in Dubai. This validation further demonstrates what AI-first leadership looks like in practice, where innovation is driven by trust, responsibility, and clear strategic intent.
Why Does It Matter?
The upgrade to Tier A reinforces our commitment to delivering AI initiatives in line with Dubai's governance, regulatory, and compliance expectations.
- The Dubai AI Seal is an indicator of confidence, transparency, and trust for all stakeholders, including government entities, private-sector partners, and the public.
- Only verified AI partners are trusted to deliver reliable, compliant, and high-quality AI solutions.
- Dubai government organizations are now required to work exclusively with certified AI providers.
Every recognition comes with responsibilities. This recognition validates the hard work and vision of our teams across continents. More than a validation, this milestone reinforces our promise to clients and partners that we deliver innovative AI solutions that bring value to the organization, keep pace with the future, and help shape it.
At Beinex, our journey has been fueled by curiosity, expertise, and collaboration, from deploying AI-driven analytics to developing enterprise-grade automation solutions. As part of our adherence to pushing the boundaries of AI, we are on a mission to create intelligent solutions that transform industries.
Related Articles

Top Ten Business Intelligence Trends
What is Business Intelligence?
Business intelligence (BI) is an analysis that uses business-related strategies and technologies to assess, process, and interpret business information. This type of information helps businesses understand the current state of their organization and make informed decisions on how to take actions that are likely to yield their intended results.
Leveraging business intelligence insights offers several benefits to employers and employees, including strengthening performance and improving efficiency. For example, insights from business intelligence metrics can help employers understand where supply chain function might be breaking down or provide a snapshot of consumer products performing above or below expectations.
Top Trends in Business Intelligence in 2024
Finding the latest trends in BI can help your organization stay competitive and maximize your ability to use your data. While trends continually shift by nature, the following areas have rapidly risen in demand and application.
1. Augmented Analytics
Augmented analytics is an approach to data analytics that employs advanced technologies such as AI and machine learning to automate data preparation, insight generation, and insight sharing.In 2023, the global augmented analytics market was valued at USD 8.9 billion, marking a significant milestone in data-driven technologies. The market is on track for impressive expansion, with estimates predicting its value will climb to USD 11.6 billion in 2024 and soar to USD 91.4 billion by 2032. This remarkable growth, reflected in a compound annual growth rate (CAGR) of 29.4% between 2024 and 2032, underscores the rising importance of advanced analytics in transforming business intelligence and decision-making processes across industries.
Here are the advantages of augmented analytics:
Advantages: • Increased Efficiency: Automates data preparation, saving up to 60% of man-hours spent on manual data processing. • Broader Accessibility: Empowers non-technical users to gain insights, reducing dependency on data specialists by 40%. • Real-World Impact: Organizations using augmented analytics report a 25% increase in productivity due to faster decision-making.
2. Natural Language Processing (NLP)
Natural Language Processing (NLP) is a confluence of computational linguistics and artificial intelligence that enables machines to understand, interpret, generate, and respond to human language meaningfully and contextually. An example of a program that utilizes natural language processing is ChatGPT. The Natural Language Processing (NLP) market is projected to reach a value of USD 36.4 billion in 2024. With a robust compound annual growth rate (CAGR) of 27.5% from 2024 to 2030, the market is expected to expand significantly, reaching a volume of USD 156.8 billion by 2030. This rapid growth highlights the increasing adoption of NLP technologies across various industries, driving advancements in AI-driven communication and analytics tools. The advantages of Natural Language Processing (NLP) within the business intelligence landscape: Advantages: • Enhanced User Engagement: Reduces the learning curve for data tools, increasing user adoption by up to 30%. • Customer Insights: Companies using NLP for sentiment analysis report a 15% increase in customer satisfaction.
3. Data Storytelling
The growing dependence on data in the corporate landscape brings forth the need for data interpretation that extends beyond traditional methods. The narrative structure is one of the primary differentiators between data storytelling and data visualization. While data visualization can provide a visual representation of what the data is saying, data storytelling explains why the data matters, providing a more comprehensive understanding of the insights. According to Gartner, by 2025, data stories will become the most common method for consuming analytics, and data storytelling will dominate BI, with 75% of these stories being automatically produced through augmented analytics techniques. Advantages: • Better Understanding: Enhances comprehension of complex data, leading to a 20% reduction in misinterpretation. • Improved Decision-Making: Organizations using data storytelling have reported a 15% increase in strategic decision outcomes.4. Self-Service Analytics
Another BI trend is self-service analytics. It is a form of business intelligence wherein end-users, such as marketing professionals, are enabled to conduct data analyses and generate reports without the direct assistance of IT or data science teams. The self-service BI market is projected to reach USD 30 billion by 2036, expanding at a compound annual growth rate (CAGR) of 8% between 2024 and 2036. In 2023, the market size was valued at over USD 18 billion. This substantial growth is driven by the increasing demand for data democratization, as organizations seek to dismantle traditional data silos and enable non-technical users to access, analyze, and extract insights from data independently. Advantages: • Time Savings: Reduces report generation time by up to 50%, allowing for faster data-driven decisions. • Empowered Employees: Decreases IT workload by 30%, enabling more focus on strategic projects.
5. Decision Intelligence
DI goes beyond traditional analytics by creating a semantic framework that incorporates business rules and context, enabling predictive analytics to generate actionable, future-focused insights. This empowers organizations to make more informed and strategic decisions, often automating routine choices and accelerating complex ones. The DI market is on a robust growth trajectory, projected to surge from $13.3 billion in 2024 to a remarkable $50.1 billion by 2030. As businesses increasingly prioritize data-driven strategies, DI stands out as a pivotal tool for enhancing decision-making agility and precision, ensuring organizations stay ahead in a competitive landscape. Advantages: • Automated Decision-Making: Increases decision speed by up to 40%, significantly reducing time-to-insight. • Enhanced Strategic Planning: Companies using DI report a 25% improvement in strategic planning accuracy.6. Predictive Analytics
Predictive analytics is an advanced form of analytics that uses historical data, statistical algorithms, and machine-learning techniques to predict future events and trends. The predictive analytics market is projected to grow by USD 38.6 billion, at a CAGR of 28.9%, between 2023 and 2028. This rapid expansion is fueled by increasing demand for data-driven decision-making, advancements in AI and machine learning technologies, and the rising adoption of predictive analytics across various sectors, including finance, healthcare, and retail. Advantages: • Proactive Decision-Making: Reduces operational costs by up to 15% through accurate demand forecasting. • Risk Mitigation: Enhances risk assessment accuracy, leading to a 20% reduction in potential losses.
7. Artificial Intelligence (AI) in BI
Another emerging BI trend is the greater infusion of AI in business intelligence. AI's ability to automate data analysis, generate insights, and predict outcomes is redefining the way organizations interact with data. The Artificial Intelligence market is projected to reach a size of USD 184.0 billion in 2024, with an expected annual growth rate (CAGR) of 28.4% from 2024 to 2030. This growth is anticipated to result in a market volume of USD 826.7 billion by 2030. AI in BI typically involves the application of machine learning algorithms and advanced analytics techniques to automate data processing and interpretation tasks. From data collection and cleaning to analysis and insight generation, AI can significantly reduce the manual workload, speeding up the entire BI process. Advantages: • Operational Efficiency: Automates 70% of data analysis tasks, freeing up resources for strategic activities. • Cost Reduction: Reduces the cost of data processing by up to 20%8. Advanced Data Visualization
Advanced data visualization goes beyond basic charts and graphs, incorporating a variety of innovative visual elements such as heat maps, geographical maps, scatter plots, treemaps, and more into the dashboard design. These elements enable the presentation of multi-dimensional data in a single view, facilitating a more comprehensive understanding of the data. The global data visualization market showcased a strong value of USD 4.5 billion in 2017, highlighting the growing demand for effectively presenting complex data. By 2023, the market is expected to surge to USD 7.7 billion, reflecting a robust CAGR of 9.47%. Advantages: • Improved Insights: Increases data interpretation accuracy by 30%. • Enhanced Collaboration: Boosts cross-departmental collaboration by 25% through shared visual insights.
9. Mobile BI
Mobile business intelligence (BI) involves the use of mobile devices to access BI applications and data, enabling decision-makers to stay informed and make decisions, irrespective of their location. The global mobile business intelligence market, valued at USD 13.8 billion in 2023, is expected to grow at a CAGR of 15.3%, reaching USD 51.5 billion by 2032. Advantages: • Increased Accessibility: Provides real-time data access, enhancing decision-making speed by 35%. • Boosted Productivity: Enables on-the-go analysis, increasing productivity by 20%.10. Ethical Data Governance
The last BI trend on the list is ethical data governance, which addresses policies, procedures, and structures that ensure data quality and security, and ethical considerations related to data collection, processing, and use. The global data governance market is projected to reach USD 4.1 billion in 2024 and is expected to grow at a CAGR of 18.5% over the next decade, reaching USD 22.5 billion by 2034. The central principle behind Ethical Data Governance is respecting individual privacy and rights in all data activities. It involves implementing practices that ensure informed consent, data anonymization, and stringent access controls, among others, to protect individual privacy and prevent data misuse. Advantages: • Compliance Efficiency: Reduces compliance-related costs by up to 25%. • Increased Trust: Builds customer trust, leading to a 10% increase in brand loyalty.
Tableau in Action: Leveraging Latest BI Trends
Tableau integrates the latest BI trends into practical applications, enhancing decision-making and data insights. Let’s examine how some of the top BI trends are applied within Tableau. Here are a few examples:
- Augmented Analytics: With Tableau Einstein Discovery, companies can automate insights and speed up decision-making, especially in retail and finance.
- Natural Language Processing: Tableau’s NLP system allows users to explore data using simple language, enabling faster data processing without coding.
- Data Storytelling: Story Points help craft compelling narratives, increasing stakeholder engagement in areas like marketing and sales.
- Self-Service Analytics: Tableau enables business users to independently explore data, reducing IT workload and accelerating decisions in finance and supply chain.
- Predictive Analytics: Integrating with Einstein Discovery, Tableau’s predictive capabilities help industries like healthcare forecast trends and optimize operations.
- Mobile BI: Tableau’s mobile app allows for real-time access to data, improving productivity for on-the-go teams like sales.
ALTERYX RELEASES 2018.3
Visualytics at every step
The Interactive Chart tool replaces the existing Charting tool, which has been deprecated. Now, the interactive charting tool instantly creates and customizes popular chart types and output in both static and interactive formats.
The Insight Tool brings your insights to life through interactive dashboards you can share across your organization via the Alteryx Gallery to gain deeper insights into your data. You can create and arrange multiple charts and text elements on the dashboard, create filters for viewing specific data, and create drilldowns to let you change the detail level of data displayed.
Deliver answers faster
Caching feature in Alteryx Designer allows for a workflow process to be stopped and then restarted from the caching point without starting over which can drastically reduce processing time.
Alteryx Server becomes more enterprise-friendly with job prioritization and worker node assignment that enables admins and users to prioritize the most critical jobs to the top of the queue.
Alteryx Connect gets smarter by recommending related assets to help you discover other available analytic assets to use in your analysis.
Next level analytics
The new Python tool with Jupyter Notebook integration is an embedded IDE that allows you to run Python code directly in Alteryx Designer.
Adding the big data capabilities – Apache Spark Code tool support – Spark Direct for Databricks on Azure and HDInsight – which allows you to quickly leverage the power of Spark right within a workflow.
We encourage you to experience the new capabilities in Alteryx Analytic 2018.3 during our live webinar on September 18th

AWS vs AZURE vs GCP: THE LEADING CSPs FROM A COMPARATIVE LENS
Benefits of Cloud Computing
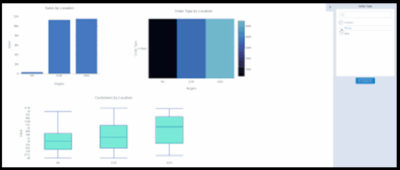
Worldwide Vendor Market Share
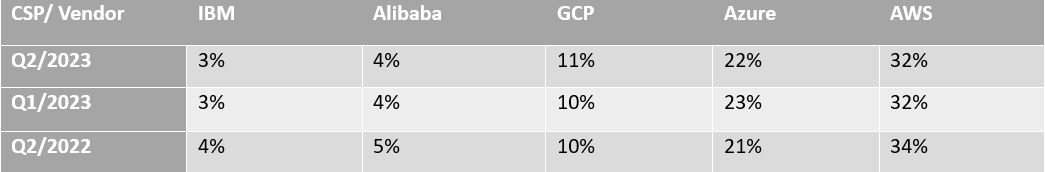 Sourced from: Cloud Market Share Q2 2023: AWS, Microsoft, Google Battle | CRN
AMAZON WEB SERVICES (AWS)
Amazon Web Services is the most extensive and widely adopted cloud platform worldwide, offering over 200 fully featured services across global data centres. AWS is used by millions of customers, including fast-growing startups, major enterprises, and prominent government agencies, to reduce costs, enhance agility, and accelerate innovation.
The USPs of AWS
Popular Customers of AWS
Netflix:Netflix relies on AWS for most of its computing and storage requirements, including analytics, databases, recommendation engines, video transcoding and numerous functions utilizing over 100,000 server instances on the AWS platform.BMW Group: BMW Group leverages AWS to acquire the agility and flexibility necessary for democratizing data usage and expediting innovation.
Philips: Philips is an early adopter of AWS that utilizes AWS services to manage the Philips HealthSuite Platform, ensuring scalability, cost-effectiveness, and regulatory-compliant solutions.
Salesforce: Salesforce shares a global strategic relationship with AWS, utilizing AWS compute, storage and AI solutions to create and deploy innovative business applications.
Pinterest: The exabyte data platform of Pinterest is hosted exclusively on AWS, managing log search and analytics that surpass 1.7TB. This implementation has led to a 30% reduction in operational costs.
Coca-Cola: After its migration to AWS, Coca-Cola has reduced operational costs by 40% and IT ticket volume by 80%.
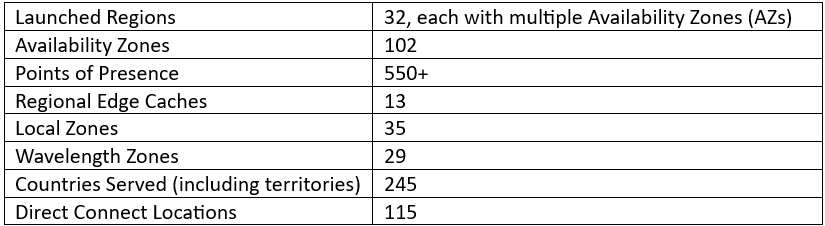
Regions & Availability
AWS boasts the most expansive global cloud infrastructure. Gartner has acknowledged the AWS Region and Availability Zone framework as the endorsed strategy for operating enterprise applications demanding high availability.
The AWS Cloud covers 102 Availability Zones across 32 geographic regions worldwide, with disclosed intentions to introduce an additional 15 Availability Zones and 5 AWS Regions in Germany, Canada, Thailand, Malaysia and New Zealand.
MICROSOFT AZURE
The Azure cloud platform encompasses over 200 products and services crafted to empower you to bring innovative solutions to fruition, addressing current challenges while shaping the future. It offers the flexibility to build, run, and manage applications across various clouds, on-premises, and at the edge, utilizing the tools and frameworks as per your preferences.
The USPs of Microsoft Azure
Popular Customers of Microsoft Azure
New York City Department of Environmental Protection (DEP): DEP uses a Microsoft infrastructure specifically designed with modern security considerations. With the solution in the cloud, Microsoft manages disaster recovery, reducing the necessity for maintaining certain skill sets in-house. CCC Group: CCC Group utilizes Azure Data Lake and Data Warehouse to collect, store, and segment data. Panasonic Connect Co: Panasonic Connect Co maximizes the benefits of PaaS services such as Azure IoT Hub, Synapse Analytics, and Azure Kubernetes Services. Hamburg Commercial Bank: Hamburg Commercial Bank opted for Microsoft Azure Virtual Desktop to achieve improved performance, reliability, and enhanced interoperability with other Microsoft technologies previously invested in. Barnsley Hospital NHS Foundation Trust: Barnsley Hospital NHS Foundation Trust adopted a new, integrated platform using Power Platform and Microsoft Teams for video consultations. During the COVID-19 pandemic lockdowns, the Trust rapidly deployed Microsoft Teams to facilitate remote work and staff collaboration.Regions & Availability:
Microsoft operates highly secure data centre facilities globally, forming a distributed infrastructure that sustains thousands of online services. This expansive, globally distributed infrastructure prioritizes sustainability, bringing applications closer to users, ensuring data residency, and providing customers with comprehensive compliance and resiliency options.
As of March 2023, Microsoft Azure boasts 160 active data centres spread across 60 regions worldwide. These Azure regions, defined by geographical areas, house one or more physical Azure data centres. Operating within a latency-defined perimeter, these data centres are strategically positioned to deliver optimal performance and security to users.
Azure leads with over 60 announced regions, surpassing all other cloud providers. It is accessible in 140 countries, showcasing a global presence that sets it apart in cloud computing.
GOOGLE CLOUD PLATFORM (GCP)
Google Cloud, also called Google Cloud Platform, offers computing resources dedicated to developing, deploying, and operating web applications. While its cloud infrastructure supports applications like Google Workplace, GCP primarily serves as a platform for constructing and managing custom applications. These applications can subsequently be published on the web, leveraging the extensive capabilities of its hyperscale data centre facilities.
The USPs of the Google Cloud Platform
Popular Customers of the Google Cloud Platform
Etsy: Utilizing the collaborative tools offered in Google Workspace, Etsy meets the evolving needs of sellers and buyers innovatively, fostering continued growth and enhancing the sustainability of its operations. X (formerly Twitter): Twitter's complete shifting of its ad analytics data platform to Google Cloud granted developers increased agility, allowing them to configure existing data pipelines more easily and build new features acceleratedly. Airbus Defence and Space: Airbus Defence and Space's Intelligence business line employs Google Cloud to construct a scalable online platform, enabling customers to access petabytes of satellite imagery in real-time.Regions & Availability
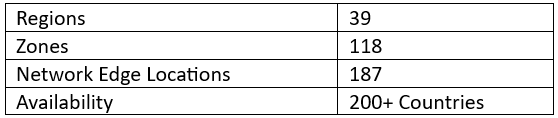
Google Cloud provides global coverage through regions distributed worldwide, ensuring low cost, minimal latency, and optimal application availability for customers.
Follow the link to have a look into a tabular comparison of the solutions provided by the CSPs: AWS, Azure and GCP. https://cloud.google.com/docs/get-started/aws-azure-gcp-service-comparison

Best AWS Services & Practices Every Data Engineer Should Master in 2025: Everything You Need in Your AWS Toolkit
1. Start with Storage Using Amazon S3
Amazon S3 is a secure and reliable storage solution when you are dealing with massive datasets. It's highly scalable, extremely durable, and serves as a foundation for most data workflows. You can depend on it from initial data landing zones to backup archives.
2. Spin Up Power with Amazon EC2
When you need raw computing power for heavy-duty tasks, such as batch processing or running data pipelines, EC2 gives you the flexibility to choose instance types suitable for your workloads. You're in control of the compute environment, which is key for tuning performance.
3. Simplify ETL with AWS Glue
Managing extract-transform-load operations can be messy. AWS Glue resolves this with automated data discovery, code generation, and job orchestration. AWS Glue can support you if you're managing multi-source ingestion and need to clean and prepare your data for use.
4. Query at Speed with Amazon Redshift
Redshift offers the easiest and quickest way to run complex queries against large volumes of structured data. It's perfect for powering dashboards, reports, and business intelligence tools without the drag of traditional databases.
5. Tackle Big Data with Amazon EMR
If your workloads involve distributed computing using Apache Spark or Hadoop, EMR helps you deploy and manage those clusters in a fraction of the time. It is ideal for advanced data transformations and machine learning (ML) workloads, as it integrates easily with other AWS services.
6. Event-Driven Logic with AWS Lambda
Forget provisioning servers to process a few files. Lambda allows you to write lightweight, trigger-based code that responds to data events. It is an efficient serverless solution for processing files as they arrive or triggering downstream processes.
7. Streamline Real-Time Data with Amazon Kinesis
Modern data doesn't always arrive in neat batches; it streams in constantly. Kinesis helps you manage this chaos by capturing, processing, and analyzing real-time data. You can utilize it for use cases such as log monitoring, clickstream analysis, and sensor data processing.
8. Store Fast & Flexible Data with DynamoDB
DynamoDB is a fully managed, serverless database ideal for workloads where speed and uptime are paramount. It provides a NoSQL solution that works best in situations where low latency is essential, such as recommendation engines or personalized content delivery.
9. Keep Your Metadata in Check: Glue Data Catalog
The Glue Data Catalog can be considered as a metadata hub that consolidates information regarding datasets, schemas, and transformations for you. It improves discoverability and governance—two things no engineer should overlook.
10. Coordinate Workflows with AWS Step Functions
As you know, data workflows can span multiple tools, services, and dependencies. AWS Step Functions help you string those steps together into one cohesive flow, complete with retries and error handling. It's a visual way to orchestrate and manage complex processes with clarity and ease.
Best Practices for Using AWS Tools as a Data Engineer
AWS tools are powerful, but knowing what to use isn’t enough; how you use them is what drives real impact. That’s where the best practices for using AWS services come in:
• Scalability: Use services that grow with your data. Enable auto-scaling in EC2, EMR, and Lambda to handle variable workloads.
• Automation: Set up Glue jobs, Lambda triggers, and Step Functions to run tasks without manual effort.
• Security: Encrypt your data (both at rest and in transit) and adhere to least-privilege access with IAM roles.
• Cost Monitoring: Use spot instances, archive old data in S3 Glacier, and monitor costs with AWS Budgets.
• Smart Workflows: Break pipelines into smaller, reusable steps. Use Step Functions for clear orchestration.
• Track & Monitor Everything: Use CloudWatch and CloudTrail to keep an eye on performance, errors, and user actions.
• Organize Metadata: Keep your Glue Data Catalog updated and use clear naming so your data is easy to find and understand.
• Test Before You Trust: Validate your data and test your pipelines with sample loads before pushing to production.
• Document as You Go: You can easily maintain notes on your workflows, data sources, and transformations for smoother teamwork.
Wrapping Up: Why These Services Matter
Tools that enable speed, flexibility, and automation are not just desirable; they're essential. AWS offers a comprehensive toolkit that covers all stages of the data lifecycle. By staying up to date with these services, you not only improve your performance at work but also position yourself to take the lead in a data-driven, cloud-first future.
For data engineers seeking to excel in their roles, it is beneficial to become proficient in at least 10 AWS services. By serving as the foundation for scalable and effective data pipelines, these services help businesses transform unstructured data into actionable insights. Data engineers can significantly contribute to fostering innovation and informed decision-making within their companies by leveraging the potential of Amazon Web Services.

Accelerating Digital Transformation with Data and Design: HR Transformation
Digital transformation connects disparate data points and platforms across an organisation's larger ecosystem – both online and offline. It provides a clear picture of how to improve, expand, and add value to the organisation.
Most businesses conduct their operations on the cloud. As businesses migrate data to the cloud, much of what is done is digitally replicating existing services. True digital transformation, on the other hand, implies much more. A digital transformation can be transformative across an organisation by establishing a technology framework to channel all the services and data into actionable insights that can improve almost every aspect of the organisation.
Digital transformation can be used to re-evaluate and optimise your systems and processes, ensuring they are interrelated and flexible enough to provide robust business intelligence and position your company for future success.
How can digital transformation change different aspects of an organisation?
Digital transformation can be intimidating in the first stage despite all the aura associated with it. But there is no need for a second thought once the initiative is taken. A well beginning is half done, right? Well, let's discuss how digital technology transforms the crucial areas of an organisation.
HR and Digital Transformation
Automating HR processes and making them data-driven is termed HR digital transformation. An automated performance management system is implemented, and the managers and employees access the platform to view and update it and gather data for salary appraisals, screening processes and many other activities.
Well, what does HR digital transformation look like? It is not about HR but the whole metamorphosis an organisation undergoes after implementing digital transformation. Let's delve deep into HR Digital transformation and understand how digital technology can invariably bring changes to the HR department.
Digital Onboarding
The prevalence of hybrid work mode and hybrid work atmosphere has made digital onboarding the need of the hour. The employee onboarding process is done in person and is time-consuming, labour-intensive, and sometimes inconsistent. So many checklists must be ticked to complete the process like:
- Is all required reading and learning completed?
- Have they checked in with the HR assistant?
- Have they completed all the required onboarding formalities?
- An excellent digital onboarding process is structured and strategic, ensuring new employees feel welcomed, assisted, and trained to do their best work.
Employee Self-Service Portals
Employees have many queries regarding company policies, benefits, and basic HR information.
Every question can instead be answered by an easily accessible employee self-service information portal as part of your HR digital transformation.
Aside from routine information requests, self-service portals (also known as HCM Systems) can provide employees and managers with access to critical information, such as:
- NPS ratings
- Company news and workplace policies
- Performance management information such as self-evaluations, objectives, training, and ongoing trends
- Job opportunities
- Wellness polls
- Minutes of meetings and updates to the knowledge base
- Employees can take advantage of available training opportunities to improve their skills.
People Analytics
The application of data-driven decision-making to HR processes to enhance employee performance, commitment, and achievement is known as people analytics. Organisations use people analytics to improve talent management, employee retention, succession planning, and recruiting.
The information gathered helps employees to succeed and feel more fulfilled at work. The data collected from team-building exercises and other data collection and analysis methods can be used to develop an effective L&D strategy, allowing for upskilling and reskilling while also increasing productivity and employee satisfaction.
AI-Powered Applicant Tracking Systems
It's no surprise that many more giant corporations have adopted AI-powered applicant tracking systems (ATS). No one can afford to miss out on a compatible candidate in this competitive period because they're manually sorting through so many unqualified candidates.
Artificial Intelligence-powered applicant tracking systems use pre-programmed filters based on keywords, capabilities, years of work experience, education, and so on to eliminate unsuitable applicants before they are approached in person or interviewed.
ATS also shares job listings to multiple platforms, conduct pre-interview screening, schedule interviews, facilitate candidate evaluations from numerous interviewers, and provide the data required to assess the success of your hiring processes. It also makes sure to make unbiased decisions regarding the employee selection process.
HR Chatbots
HR chatbot is a convenient substitute for visiting the HR department to seek answers to simple questions or doubts. The most carefully planned digital employee onboarding process and employee self-service portal fail to resolve every question or concern your workforce may have. On the other hand, HR chatbots allow HR to create auto-response messages that instantly address some of the most frequently asked issues and concerns. Chatbots collect employee data sequentially as needed.
In a nutshell, digital technology has the grit to fully transform every aspect of an organisation. Initially, it can be intimidating as any new step, but it is worthy enough for the massive changes it can bring forth. It is for sure that the digital transformation movement will gain momentum.
The workforce will be affected by the next wave of digital transformation in a way that traditional automation cannot, and the nature of labour in many roles will shift completely. This will be the outcome of a trifecta of factors, including the arrival of a generation who grew up with technology, the widespread use of traditional technologies that eliminate the majority of repetitive activities, and the quick development of cognitive technologies. Even though HR departments are increasingly taking charge of their digital transformation, it is still required to collaborate closely with the technology department to make sure that the systems and tools you choose are in line with the enterprise's broader strategy.
According to IDC, by 2023, digital transformation will account for 53% of all information and communication technology investments. Let us not dare to miss this bus!