How AI Decision-Making is Improving Enterprise Outcomes
Blog
Share 
Beinex Achieves Snowflake Select Tier Partner Status
 12 May 2022
  Sumi S
Benefits: Enhanced Data Cloud Capabilities
The partnership will let Beinex turbocharge services on the AI-ML, analytics fronts by utilising storage and compute scalability unlocked by the unique collaboration. It awards Beinex and its clients the capability to flourish in terms of cost leadership, domain leadership and added utilisation of potential in sync with market conditions.
Data marketplace enhancement
The partnership also means that acquiring and testing third-party data is now easier which also entails the Snowflake users to imbibe the expanded third-party data into their environment, attach it to their first-party data and evaluate the data efficacy vis-à-vis customer experience along with the impact it can create.
There is little doubt that the capability is very much in demand as Beinex clients are into delivering powerful customer/ user experience as a part of their service efforts
Features:
- Privacy-safe
- Secure sharing platform
- No need to set up extra secure portals to support sharing of Personally Identifiable Information
The power of partnership
Beinex partnership with Snowflake enables it to offer clients advanced features like automated tuning and elastic compute with unlimited decoupled computing capability, along with the analytics modernization services, to help organisations realise exponential Return on Investment. This upgrade in status will take business to the next level for both Beinex and its esteemed client line-up.
Partnerships are what make Beinex stronger. The company has strong partnerships with some of the leading technology firms, research labs, and universities around the globe.
Businesses can leverage the power of our partner ecosystem to maximize the value of their end-to-end analytics journey.
Beinex is ecstatic to receive this recognition as a Snowflake select services tier partner and is grateful to Snowflake for acknowledging its client services.
Beinex adds one more feather to its cap by achieving Snowflake Select Tier Services Partner status. A coveted position, it enables Beinex to continue to deliver services to its clients leveraging the Snowflake platform much more effectively and efficiently by tapping further into its storage and computing prowess. The upgrade will also empower Beinex to serve its clientele by letting it deliver hyper-personalised customer experiences boosting and bolstering first-party data with precise and predictable third-party data.
Related Articles

RUNNING THE MIGHTY SMALL LANGUAGE MODEL PHI-3 ON SNOWFLAKE
What is an SLM?
A Small Language Model (SLM) is tailored to excel in simpler tasks, offering boosted accessibility and user-friendliness for organizations operating with limited resources. Besides, they can be readily fine-tuned to align with specific requirements. Small language models are particularly well-suited for organizations aiming to develop applications capable of operating local devices instead of relying on cloud infrastructure. They are especially beneficial for tasks that do not necessitate extensive reasoning or immediate responses.
Reasons to use SLMs
Given the growing popularity and applicability of SLMs across various domains, particularly in areas like sustainability and the volume of data required for training, there are multiple reasons for employing them.
What is Phi-3?
Microsoft has a suite of small language models (SLMs) known as 'Phi,' demonstrating outstanding performance across various benchmarks. Microsoft's recent release is Phi-3, a series of open AI models. The Phi-3 models represent a prototype of capability and cost-effectiveness among small language models (SLMs), exceeding models of equivalent and larger sizes across the spectrum of coding, language, reasoning, and mathematical standards. This launch broadens the array of high-calibre models accessible to customers, providing them with more practical options as they craft and construct generative AI applications.
Phi-3-mini, a 3.8B language model, is accessible through Microsoft Azure AI Studio, Hugging Face, and Ollama. It is offered in two context-length variations—4K and 128K tokens. Notably, it is the first model within its category to support a context window of up to 128K tokens with minimal impact on quality. Furthermore, it is instruction-tuned, implying that it has been trained to comprehend and adhere to diverse instructions, mirroring natural human communication patterns. This ensures that the model is readily deployable straight out of the box. Phi-3-mini is available on Azure AI to leverage the deploy-eval-finetune toolchain, and it is also accessible on Ollama for developers to execute locally on their laptops.
Features of Phi-3
Phi-3 models exhibit distinctive superiority over language models of comparable and larger dimensions on key benchmarks, showcasing the following features:
Snowflake meets Phi-3: Advantages
The key pain point about LLMs is the computing required to host and run them. Setting up a dozen GPUs to run models can be expensive and complex. There's where Snowflake steps up. Snowflake's compute pool option enables users to easily and quickly set up and manage compute clusters. Phi-3 comes into the picture because of its cost-effective GPU utilization.
Can you imagine a situation where your language model only requires less than 3GB of GPU memory for inference? Well, now it's possible, all thanks to Phi-3. It's a state-of-the-art SLM that produces excellent results over GP3.5 and Mistral 8x7B, which are much bigger models. This opens the door for more cost-effective solutions to be brought up in the AI space. Add Snowflake for hosting; you have an excellent setup to host, test, and build AI applications. Read below how Beinex managed to run Phi-3 on Day 0 in Snowflake.
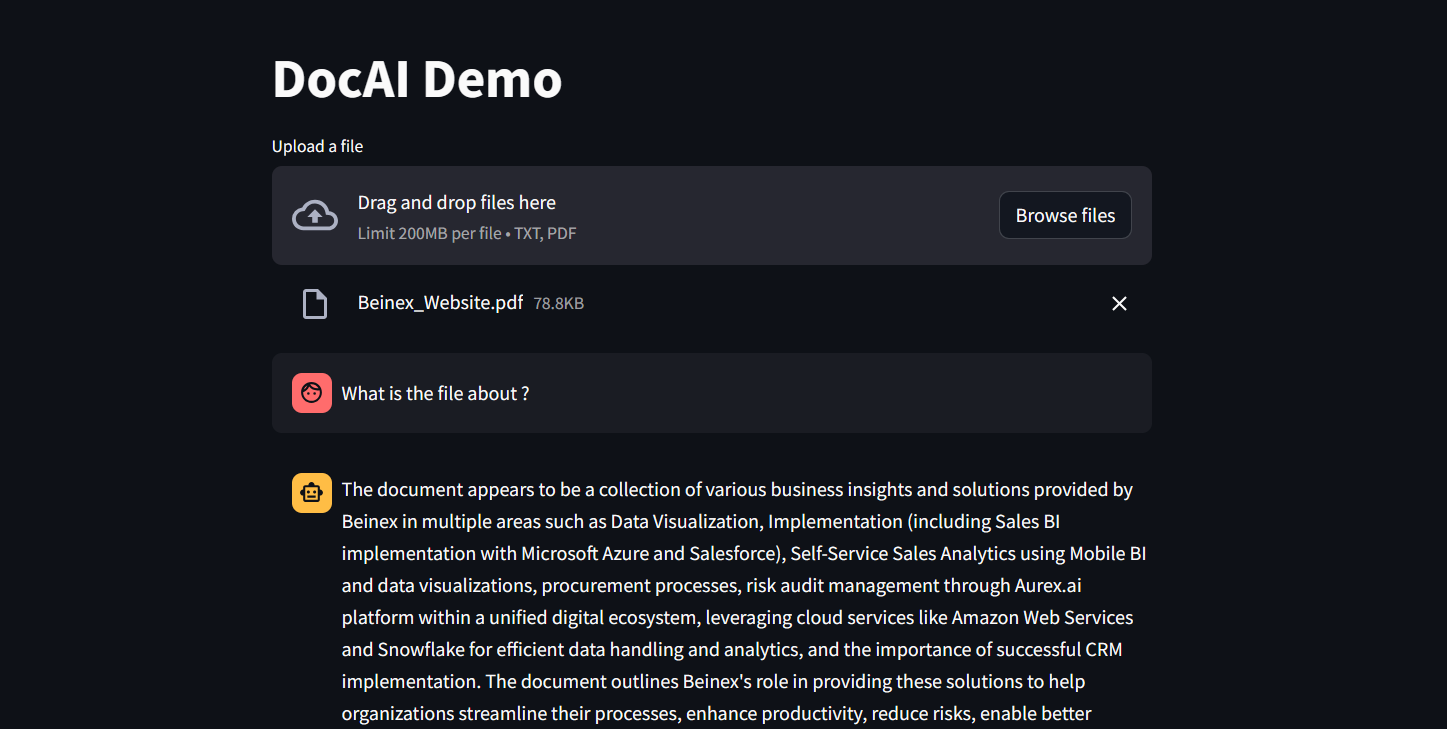 Figure 1: DocAI running on Phi-3
Implementing Phi-3 on Snowflake: What Beinex Did and How Beinex Did it?
Beinex has seamlessly integrated Phi-3 into Snowflake to help enterprises unlock their data's full potential through advanced language processing capabilities and enhance decision-making with deeper insights. The integration facilitates Snowflake users to:
Here's a detailed guide on implementing Phi-3 on Snowflake:
Step 1: Create Necessary Objects
-- Run by ACCOUNTADMIN to allow connecting to Hugging Face to download the model
-- Stage to store LLM models
CREATE STAGE <stagename> IF NOT EXISTS models
DIRECTORY = (ENABLE = TRUE)
ENCRYPTION = (TYPE='SNOWFLAKE_SSE');
-- Stage to store YAML specs
CREATE STAGE <stagename> IF NOT EXISTS specs
DIRECTORY = (ENABLE = TRUE)
ENCRYPTION = (TYPE='SNOWFLAKE_SSE');
-- Image repository
CREATE OR REPLACE IMAGE REPOSITORY images;
-- Compute pool to run containers
CREATE COMPUTE POOL GPU_NV_S
MIN_NODES = 1
MAX_NODES = 1
INSTANCE_FAMILY = GPU_NV_S;
Step 2: Docker Image Code - ollama
FROM ollama/ollama
RUN $(ollama serve > output.log 2>&1 &) && sleep 10 && ollama pull phi3 && pkill ollama && rm output.log
ENTRYPOINT ["ollama"]
CMD ["serve"]
Step 3: Tag and Push the Docker Image
docker tag ollama <SNOW_ORG-SNOW_ACCOUNT>.registry.snowflakecomputing.com/db/schema/image respository /ollama
docker push <SNOW_ORG-SNOW_ACCOUNT>.registry.snowflakecomputing.com db/schema/image repository /ollama
Step 4: Docker Image - UDF
FROM python:3.11
WORKDIR /app
ADD ./requirements.txt /app/
RUN pip install --no-cache-dir -r requirements.txt
ADD ./ /app
EXPOSE 5000
ENV FLASK_APP=app
CMD ["flask", "run", "--host=0.0.0.0"]
App.py content is given below :
from flask import Flask, request, Response, jsonify
import logging
import re
import os
from openai import OpenAI
client = OpenAI(
base_url='http://ollama:11434/v1',
api_key="EMPTY",
)
model = "phi3"
app = Flask(__name__)
app.logger.setLevel(logging.ERROR)
def extract_json_from_string(s):
logging.info(f"Extracting JSON from string: {s}")
# Use a regular expression to find a JSON-like string
matches = re.findall(r"\{[^{}]*\}", s)
if matches:
# Return the first match (assuming there's only one JSON object embedded)
return matches[0]
# Return the original string if no JSON object is found
return s
@app.route("/", methods=["POST"])
def udf():
try:
request_data: dict = request.get_json(force=True) # type: ignore
return_data = []
for index, col1 in request_data["data"]:
completion = client.chat.completions.create(
model=model,
messages=[
{
"role": "system",
"content": "You are a bot to help extract data and should give professional responses",
},
{"role": "user", "content": col1},
],
)
return_data.append(
[index, extract_json_from_string(completion.choices[0].message.content)]
)
return jsonify({"data": return_data})
except Exception as e:
app.logger.exception(e)
return jsonify(str(e)), 500
Step 6: YAML File
spec:
containers:
- name: ollama
image: <SNOW_ORG-SNOW_ACCOUNT>.registry.snowflakecomputing.com/ db/schema/image respository /Phi3
resources:
requests:
nvidia.com/gpu: 1
limits:
nvidia.com/gpu: 1
env:
NUM_GPU: 1
MAX_GPU_MEMORY: 24Gib
volumeMounts:
- name: llm-workspace
mountPath: /<stage name>
- name: udf
image: <SNOW_ORG-SNOW_ACCOUNT>.registry.snowflakecomputing.com/ db/schema/image respository /ollama_udf
endpoints:
- name: chat
port: 5000
public: false
- name: llm
port: 11434
public: false
volumes:
- name: llm-workspace
source: "@<llm stage_name>"
Step 7: Upload YAML File and Create Service
Upload the YAML file to the created stage, where the stage name in the YAML file should match the stage created in Step 2.
-- Create service
create service phi3
IN COMPUTE POOL <name of compute pool created>
FROM @dash_stage
SPECIFICATION_FILE = '<name of yaml file uploaded>';
Step 8: Create Service Function
Create a service function on the service (after it starts).
create or replace function phi3chat(prompt text)
returns text
service= phi3
endpoint=chat;
Check Service Status
Use the following command to check the status of the service:
SELECT
v.value:containerName::varchar container_name,
v.value:status::varchar status,
v.value:message::varchar message
FROM (
SELECT parse_json(system$get_service_status('<service name>'))
) t,
LATERAL FLATTEN(input => t.$1) v;
Benefits of Running Phi-3 on Snowflake
1. Cost-Effectiveness and Efficiency:
2. Compatibility with Smaller GPUs:
3. Exceptional Performance:
4. Faster Response Times:
SLM vs LLM
The choice between small and large language models hinges on organizational needs, task complexity, and resource availability.
LLMs excel in applications requiring the orchestration of intricate tasks, encompassing advanced reasoning, data analysis, and contextual comprehension.
On the other hand, SLMs present viable options for regulated industries and sectors facing scenarios necessitating top-tier results while maintaining data within their premises.
Both large and small language models possess distinct strengths and applications. While large language models thrive in managing complex workflows, small language models deliver impressive performance despite their compact size.
While some customers may exclusively require small models, others may favour larger models, with many seeking to integrate both types in various configurations. Ultimately, the optimal selection depends on the unique context and objectives of the organization. Besides transitioning from large to small models, the trend is evolving towards a diversified portfolio of models. This means that instead of relying on a single model, customers can choose from various models with different sizes, capabilities, and resource requirements. This empowers customers to decide the best model for their scenario, balancing performance and resource constraints.

Tableau for Financial Analytics: Transforming Data into Insights
Financial Analytics and Its Importance
Financial analytics offers actionable insights into an organization's monetary health and performance by utilizing data analysis tools and techniques for analyzing financial data. It involves assessing financial data from diverse sources, like income statements, market data, etc., to identify trends, make strategic, data-driven decisions, and optimize financial operations. Fundamental finance analytics is critical to businesses as they deliver data-driven insights that equip enterprises to make smarter decisions, optimize operations, and boost profitability. The following aspects imply the significance of financial analytics for businesses. • Analyzing financial performance • Creating accurate budgets and plans by forecasting based on market trends and historical data • Identifying and mitigating financial risks • Assessing potential investments to make informed decisions • Analyzing a company's cost structure for optimization • Harnessing big data to develop strategies for addressing challenges and making informed decisions • Facilitating continuous visibility into financial operation and performance • Detecting data gaps and analyzing historical data to improve business performance • Preventing fraud and eliminating manual, redundant tasks to enhance efficiency
Tableau for Financial Analytics
Businesses must utilize financial analytics tools and software to improve financial management, comply with regulations, identify cost-efficient prospects, optimize operations, and make informed decisions. These tools automate the analysis and interpretation of financial data, delivering valuable insights into budgeting, forecasting, and performance. Tableau makes financial analytics seamless with powerful, intuitive dashboards that facilitate data-driven decisions. With Tableau, users can easily visualize, analyze, and share data faster and detect patterns and trends that offer actionable insights. Tableau equips enterprises with an in-depth understanding of their spending, enabling effective optimization of resources. Be it tracking capital expenditures or assessing expense spending, Tableau transforms financial data into actionable insights that drive improved business outcomes. As financial analytics continues to evolve, the future of Tableau in financial analysis looks promising. Amidst the rising intricacies of financial fraud, there is a need for a robust, intuitive platform like Tableau, which is essential to detect fraud faster and reduce the impact of losses. As a popular data visualization and interaction tool in the finance domain, Tableau simplifies raw data, making it interactive and visually intelligible. Tableau uses financial analytics to improve efficiency in the following ways: • Acquiring insights from the financial data collected from diverse sources • Predicting accurately by utilizing analytics to get a detailed picture of financial perspectives • Lowering risk and saving time by tracking accounts to locate inactive or low-activity accounts
Financial Analytics Made Seamless: Tableau's Robust Capabilities
Tableau empowers financial analysts with deeper insights into financial data, enabling data-driven decisions. Let's take a look at the distinctive uses of Tableau in finance: • Automating Data Updates: Unlike traditional data reporting software like Excel, Tableau automates the process of updating data, formulas, and data reports in line with the changes, enabling faster and more efficient financial reporting and allowing users to save significant time. • Data Visualization: With Tableau's powerful data visualization capabilities, business giants can easily handle the intricacies of big data through graphical representations, real-time dashboards, and analytical data breakdowns. • Data Insights: Tableau's smarter data analytics and insight tools automatically analyze financial data and offer insights into it, allowing effortless analysis of bigger financial datasets for making important financial decisions. • Financial Reporting: Tableau offers distinctive financial reporting capabilities, transforming traditional reports like P&L statements, balance sheets, and cash flow statements into dynamic and automated experiences. Besides, Tableau delivers insightful recommendations based on the analyzed financial data, empowering users to make informed decisions. • Data Trends and Patterns: With features like data drill-down and data blending, Tableau helps acquire applicable data and identify variations, patterns, or trends within the enterprise.Tableau in Finance: Key Implementations
As a robust tool for smarter financial analytics, Tableau equips enterprises with the capability to visualize intricate data, enhance operations, and improve the decision-making process. Here are some of the key implementations in Tableau that enhance financial analysis, resulting in insightful scenario analysis and accurate forecasting. • Developing Interactive Tableau Financial Analysis Dashboards: Tableau dashboards offer a comprehensive view of the financial status of your organization, blending interactive features like action buttons, color schemes, drop-and-down filters, and intuitive layouts. Building engaging dashboards in Tableau converts the static financial data into a visual story, often incorporating various visualizations like dual-axis charts for comparison and bullet graphs for performance metrics. The interactive elements of Tableau dashboards allow for seamless manipulation of data views, enabling users to analyze deeper without switching from the primary dashboard. Example: Tableau financial analysis dashboards allow tracking key financial metrics like expenses, loan performance, and customer deposits while providing real-time updates. • Forecasting and Trend Analysis: For businesses to make strategic financial decisions, it is important to foresee future performance. The future of financial forecasting is enhanced by Tableau, which enables the creation of predictive models based on historical data patterns and the integration of statistical forecasting methods to project future trends. It helps businesses understand possible business trajectories. Example: Tableau creates visualizations comparing past performance against future projections based on historical sales data, seasonal trends, and customer purchase behaviors. • Scenario Analysis: Tableau facilitates the creation of multiple financial scenarios to assess how various factors affect financial outcomes. Analysts can use Tableau's flexibility to create different scenarios by modifying input variables to visualize the impacts on financial metrics. It helps stakeholders to have a sound idea of potential risks and opportunities. Example: Using Tableau to simulate economic conditions helps businesses assess profitability and the impact on non-performing loans (NPLs) and craft mitigation strategies. • Fraud Detection: Using Tableau for financial analytics helps organizations detect anomalies and suspicious patterns that may imply fraudulent activities. Tableau's powerful visualization capabilities help detect anomalies in financial transactions, and predictive modeling helps understand potential risks, reduce financial losses, and ensure compliance with security regulations. Example: Tableau visualizes transaction patterns and anomalies like unusually high spending across different locations. • Compliance and Risk Management: Tableau helps track financial compliance metrics and identify areas where a business may be at risk of non-compliance with regulations. For instance, it can help visualize tax liabilities, monitor debt covenants, or track audit results. Tableau also provides automated reports that track transactions and regulatory compliance. Example: A compliance dashboard might track specific ratios indicating whether a company adheres to legal financial limits. • Expense & Cost Analysis: Organizations can harness Tableau to track and analyze operational costs across departments, locations, or projects. By visualizing cost breakdowns and spending trends, finance teams can identify inefficiencies, optimize budgets, and implement cost-saving strategies. Example: Tableau visualizes spending trends, helping analyze expenses and detect cost-saving possibilities. The finance landscape is evolving rapidly, pushing modern businesses to adopt advanced BI solutions like Tableau rather than traditional spreadsheets. It is no longer the era of manual data preparation and analysis. Therefore, most organizations now rely on Tableau to create financial dashboards to track and report KPIs. Being a powerful data visualization platform with advanced analytics and interactive capabilities, Tableau helps build dynamic dashboards and redefine financial analytics. Adopting Tableau for financial services helps organizations harness its innovative features to upgrade their financial data management and reporting processes.

Beinex Recognized as a Leading Consulting Firm in the Middle East by Consultancy-me
Accolades We Are Proud Of
Beinex earned top rankings across multiple domains: • Platinum in Business Intelligence • Gold in Data Science • Gold in Cloud Services
Industry-Specific Excellence
Our industry-focused consulting capabilities have also been recognized, and our ranking level is as follows: • Government Industry: Gold • Oil & Gas Industry: Gold • Public Sector Industry: Gold • Technology Industry: Gold • Banking Industry: Silver
A Milestone of Achievement
These accolades reaffirm our position as a trusted consulting partner for businesses and government entities across the Middle East. Our success is driven by a team of passionate professionals, innovative technologies, and strategic partnerships. Looking Ahead As we celebrate this achievement, we remain committed to delivering transformative solutions that empower businesses worldwide. Thank you to our clients, partners, and team members for making this success possible. If you are interested in our services, feel free to connect: https://beinex.com/contact-us/
Read More About Our Achievements
Beinex Among Top BI Consulting Firms in the Middle East Beinex Ranked as Top Data Science Consulting Firms in the Middle East Beinex Makes to the League of Top Consulting Firms for Cloud Services in the Middle East 2024
Advanced Analytics: Facilitating One Giant Leap to The Future
1. Advanced Analytics in HR
HR teams always struggle with mammoth amounts of data which can be transformed into meaningful insights with the help of Advanced Analytics. The applications of Advanced Analytics can spearhead the domains of recruitment, learning and development of the employees and help manage their performance.
It can aid HR to identify the shortcomings in the existing resources and help decide to improve the skills of existing employees or hire competent new talent. The added advantage of HR analytics is that it is efficient in analysing employee performance by categorising them according to their individual calibre.
2. Advanced Analytics in Banking
Advanced Predictive Analytics has the potential to gear up the banking sector by assisting banks to adopt better strategies assessing and predicting customer behaviour. It can safeguard customer accounts from cyber-attacks and can detect fraudulent activities. Real-time alert messages are the most exclusive of the features which can shield against cyber-attacks to a big extent.
3. Advanced Analytics in Retail
The uncertain economy creates challenging scenarios for retailers. But Advanced Analytics functions act as a handy tool to make use of customer insights from the silos of data and provide a personalised and tailored marketing experience. It can be both cost saving and can unleash business growth to a great extent.
4. Advanced Analytics in Manufacturing
Manufacturing Analytics harvests revolutionary output from the manufacturing process, supply chain production, and customer delivery. The global manufacturing market is predicted to grow up to $28.5 billion by 2026 and the growth can be multiplied using the insights generated by analytics. Tools for asset management, product development, inventory management, and predictive maintenance can generate insightful options to rake in revenue amidst the limitations of the times.
5. Advanced Analytics in Finance
Financial sector produces a huge quantity of structured and unstructured data. The finance consultants or analysts should exploit this data with the help of Advanced Analytics to tackle financial troubles and to identify customer related requirements and issues. Advanced Analytics also helps to implement business plans and eliminate fraudulent activities. Financial institutions like loaning bodies, banks, trading firms, and insurance companies can improve their performance and revenue by deploying Advanced Analytics.
6. The Future of Advanced Analytics
Advanced Analytics is evolving and has become the indispensable requirement to run businesses. Due to the worldwide reception and adoption by the business community, analytics and information services sectors are predicted to have the fastest growth rate from 16% to 18% over the next five years starting 2022. As the market is getting competitive, planning and implementing strategic investments with data analytics is crucial to create new services and added revenue.
How Beinex can act as a torchbearer
Beinex has impacted and accelerated the growth of its customers and clients. With its impeccable offerings, it has partaken to build, market and expand businesses worldwide. The services provided by Beinex are enlisted below bracketed into respective domains:
• Predictive Analytics
This outstanding service offers you predictive insights to make resolutions which in turn can power your business.
• Artificial Intelligence
To cut short expenses and to attain target within a short period of time, make use of our AI tools or applications. It is beneficial to aggregate and automate data processing.
• Machine Learning
A vast quantity of data can be analysed using algorithms which can accelerate the decision-making process. With Machine Learning, specific and relevant data can be extracted and utilised to leverage businesses.
• RPA
Robotic Process Automation or software robots can accelerate digital transformation by emulating human actions. Automation of workflows, greater degree of accuracy, better productivity, high efficiency, and lesser costs are a few major takeaways from RPA which can accelerate business growth.
Conclusion
Advanced Analytics is here to stay, as organisations have started to rely on analytics more than ever before to predict business outcomes. It is sure to govern the business world as it has gained trust as a superpower which is accessible to all but chosen by only a few.

How to Manage Alteryx Data Connections
One of the highlights of Alteryx is Data Connections. It can be relied upon to generate and handle your data connections from a central location. The user can access it using their username and password.
The main advantages of Alteryx that set it apart :
- • data connectivity is high
- • direct access to the data sources/ bases
With the help of the Manage Data Connections window, it is possible to:
- • view connections you have already created
- • view connections shared with you
- • add new connections.
3 Steps to Create and Manage Your Data Connections with Alteryx
- Adding
- Testing
- Sharing
1. To Add a Data Connection
If the user wants to add a data connection, select Add New Data Connection on the Data Connections page. Then from the Connection drop-down select the connection type.
2. Testing Data Connections
The second step is to test the data connections. A controller and two or more worker machines make up a multi-node setup of the Server. With this arrangement, the test functionality examines the connection on the controller machine rather than the individual worker computers. One should verify the identical database drivers and driver versions are installed on every system to make sure the connection will function on any of them. Connection Test FailuresThe connection tests can fail due to multiple reasons. The user can save data connections even though they have failed the connection test.
These are the most typical causes of connection tests failing:
- • The server and database can be inaccessible to you in some circumstances. For instance, only the connection end user can access the server or database in certain cases.
- • Your ability to connect to the server or database may also be blocked by network security.
- • Sometimes the server is unable to connect to the host of the database server. At that time ping the database server host while logged into the server where Server is installed to check for network connectivity. The credentials for the database are incorrect or do not have the necessary access permissions. Get in touch with the database manager.
- • The database is unavailable. To ensure that the database is operational and performing as expected, get in touch with the database administrator.
- • The Server configuration you are using has several nodes.
3. To Share a Data Connection
After creating a Data Connection, go back to the Data Connections page to share it with users or custom groups for use in Designer.Note: Keep in mind that you must connect with a Curator or the gallery administrator to make sure that they have access to the necessary data connections if you want to allow the workflow to be used by particular users or groups.
Follow the steps mentioned below to share a Data Connection:
- • Choose the shareable data connection by clicking the pencil icon on the Data Connections screen.
- • Select Users or Custom Groups on the Modify Data Connections screen.
- • Enter a user's or a group's name here.
- • Choose the user or the group.
Note: Verify that the user's machine is installed with the same or a more recent version of the Microsoft SQL Server Native Client before initiating a Microsoft SQL Server connection. Go over to Troubleshooting.
a. Cancelling Access to a Data Connection
Choose the "x" icon next to a user's name to remove their access to a connection.
b. Modify a Data Connection
- 1. Choose the pencil icon on the Data Connections page.
- 2. Alter the Name or Connection String fields on the Modify Data Connections screen.
- 3. You can share the connection with people and groups using the Users or Custom Groups pages.
- 4. Choose Save.
1. Choose the trash can icon next to the connection name to remove the connection.
Tools in Alteryx Designer
Let’s have a look at the input tools available in Alteryx Designer:1. Input Data Tool
 By connecting the Input Data tool to a file or database, you can utilise it to add data to your workflow. This tool has a wide range of configuration possibilities.
2. Directory Tool

The Directory tool can be used to return a list of all the files present in the given directory. The tool returns file names along with additional details about each file, including file size, creation, and modification dates, and more.
3. Dynamic Input Tool

Using the Dynamic Input tool, it is possible to change file names, amend database queries, or alter input pathways that were created using data from your workflow are all possible If you're reading from a database, Alteryx will do it at runtime and will dynamically select which entries are read.
4. Connect In-DB Tool

When compared to conventional analysis techniques, the Connect In-Database tool can significantly enhance performance by allowing blending and analysis on large data sets without removing the data from the database.