How AI Decision-Making is Improving Enterprise Outcomes
Blog
Share 
إصدارات ألتريكس 2018.3
 23 September 2019
  Team Beinex
 إصدارات ألتريكس 2018.3
تلتزم ألتريكس بإيجاد أفضل الحلول وتوليد الأفكار. اتخذت ألتريكس في العام الماضي الخطوة الأولى نحو السلوك التفاعلي من خلال تقديم ميزة تعريف البيانات، حيث يوفر هذا الإصدار تصورات تفاعلية عبر منصة ألتريكس.
التحليلات المرئية في كل خطوة
حلّت أداة المخطط التفاعلي محل أداة الرسوم البيانية العادية التي تم انتقاضها. في الوقت الحالي، تقوم أداة الرسوم البيانية التفاعلية في الحال بإنشاء وتخصيص مخططات لإنتاج تصميمات ثابتة وتفاعلية.
أداة الرؤى
تعمل أداة الرؤى على إضفاء الحيوية على أفكارك من خلال لوحات المعلومات التفاعلية التي يمكنك مشاركتها مع مؤسستك عبر منصة ألتريكس لتحقيق رؤىً أعمق حول بياناتك. يمكنك إنشاء العديد من المخططات والنصوص وترتيبها على لوحة المعلومات، وأيضًا فرز وتصفية المعلومات لعرض بيانات محددة، كما يمكنك التعمق لتعديل مدى تفاصيل للبيانات المعروضة.
تسليم الإجابات بشكل أسرع
تسمح ميزة التخزين المؤقت في ألتريكس ديزاينرAlteryx) (Designer بإيقاف سير العمليات ثم إعادة تشغيلها من نفس نقطة التوقف دون الحاجة إلى عودة إلى نقطة البداية مما يؤدي إلى تقليل وقت المعالجة بشكل كبير.
التخزين المؤقت
أصبح خادم ألتريكس أكثر ملاءمة للمؤسسات من خلال تحديد أولويات الوظائف وتعيين العقد العاملة التي تمكن المشرفين والمستخدمين من إعطاء الأولوية للمهام الأكثر أهمية في قائمة الانتظار.
يكون ألتريكس كونكت (Alteryx Connect) أكثر ذكاءً من خلال التوصية بالأصول ذات الصلة، ليساعدك بذلك على اكتشاف الأصول التحليلية الأخرى المتاحة لاستخدامها في تحليلاتك.
تحليلات المستوى الأعلى
أداة بايثون (Python)
أداة بايثون الجديدة مع المفكرة التفاعلية – Jupyter NoteBook عبارة عن بيئة تطوير متكاملة (IDE) تسمح لك بتشغيل كود بايثون مباشرة في ألتريكس ديزاينر.
إضافة إمكانات البيانات الضخمة – دعم أداة أباتشي سبارك – سبارك دايركت للداتا بريكس على أزور و إتش دي إنسايت – مما يتيح لك الاستفادة من فعالية سبارك مباشرة في عملياتك.
نحن نشجعك على تجربة الإمكانات الجديدة في ألتريكس أناليتيك 2018.3 خلال الندوة المباشرة في 18 سبتمبر
-
Related Articles

Techniques in Advanced Analytics: Ten to Tango!
Organisations take advantage of advanced analytics using the techniques given below:
Data Mining
Data mining is extracting useful information from large, raw chunks of data to find trends, plan new business strategies, increase revenue, decrease costs, reduce risks and enhance customer relationships. It establishes relationships and finds patterns and correlations to detect dangers and frauds and to make a profit out of businesses.
The data mining process constitutes many steps like the following:
- Identifying the data needed for the company's purposes*
- Preparing and assembling data to find remedies,
- Evaluating data models
- Deploying the results to make the right decisions
Sentiment Analysis (Opinion Mining)
Sentimental Analysis technique is used by businesses to detect emotion or feelings in textual data. It categorises the tone of writing as positive, negative or neutral. Organisations are benefitted in many ways by aiding in crisis prevention and understanding and analysing customers' opinions about their particular products or services. The companies monitor online conversations to learn about the customers' tastes, needs, and expectations.
Sentiment analysis' fully automated tools assist businesses in extracting information from unstructured and unorganised material found on the internet, such as blog posts, email, webchats, social media channels, and comments.
Cluster Analysis
It's a popular data-mining technique that matches unstructured data fragments based on commonalities discovered between them. Cluster analysis is instrumental for companies to identify different consumer groups and sales transactions or detect fraud. It is used in Machine Learning, image analysis, pattern recognition, information retrieval, data compression, bioinformatics and computer graphics.
Cluster analysis is a powerful data-mining tool for any company that wants to recognise discrete groupings of consumers, sales transactions, or other types of behaviours and things. Insurance firms use cluster analysis to identify fraudulent claims, and banks use it for credit scoring.
Retention Analysis
Studying user analytics to determine how and why consumers churn is known as retention analysis (or survival analysis). Retention analysis is crucial for learning how to keep a lucrative client base by increasing retention and new user acquisition.
You'll learn the following things if you do a retention analysis regularly:
- Why are customers leaving?
- When clients are more prone to abandon a purchase.
- The impact of churn on your bottom line.
- How to make your retention strategies more effective.
Customer retention is a crucial practice in every business; companies can quickly decrease churn rates and increase customer satisfaction by tracking and taking advantage of customer behaviour.
Complex Event Analysis
Complex data analytics is the application of complex algorithmic approaches to effectively process huge unstructured data volumes. Computers perform data analysis; this was done mainly by individual machines acting on well-defined data structures in the past. This method uses technology to forecast high-level occurrences that are likely to occur due to a series of low-level factors.
This technique is often employed in the following scenarios:
- Stock market trading: To recognise the stock price, compare it to a pattern, and prompt the proper buying/ selling response.
- Predictive maintenance: Used by manufacturing facilities to collect data regularly to see any trends and signal the need to shut down equipment for predictive maintenance.
- Real-time marketing: This allows marketers to spot trends in consumer behaviour, giving personalised offers to customers in real-time.
- Operation of autonomous cars: It determines when to perform specific actions like spotting a stop sign in the distance, calculating the space, and selecting a deceleration rate to assure complete stopping at the movement.
Predictive Analysis
Predictive analysis is a technique used to analyse data and forecast the possibility of an event occurring in the future, allowing businesses to plan. It uses historical data combined with statistical modelling, data mining techniques and Machine Learning to predict risks and opportunities. Predictive analysis uses a scientific approach to forecast the future with a high degree of accuracy.
Predictive analytics improves corporate performance in a variety of ways:
- Optimisation of marketing campaigns: Useful in forecasting consumer reactions to changes in product offerings and in assisting a company in determining the best ways to attract and retain customers.
- Streamlined operations: It helps to manage resources as needed, such as storing inventory to keep storage expenses low or recruiting additional temporary personnel during peak times to save money on HR. This aids in streamlining the company's operations, resulting in increased efficiency and lower expenses.
- Enhanced cybersecurity: Assist to discover anomalies and patterns in real-time, allowing fraud or other persistent threats to be identified and addressed.
- Reduced risk: It helps to examine and predict whether your buyer will pay you on time. Predictive analysis can be performed using a prediction algorithm to calculate the buyer's credit score based on creditworthiness.
Machine Learning
Machine Learning is a crucial part of the AI subset of advanced analytics. This advanced analytic tool uses computational approaches to find patterns in data. It then uses them to build statistical models that can produce solid results without human participation. It falls into the following categories:
Supervised learning: The more common type of Machine Learning is supervised learning, which uses labelled data sets to allow you to search for specific patterns in the data. It requires vast datasets for the process; the more the amount of data, the more chances of getting accurate results.
Unsupervised learning: It employs various methods to find patterns and correlations in a subset of data. On the other hand, these algorithms are unable to recognise specific data sets, but they sort the information based on similarities and anomalies. However, it is applied in cybersecurity to find patterns from data.
Semi-supervised learning: It combines the benefits of supervised and unsupervised learning approaches. This technique uses unlabelled and labelled data to help the systems understand the challenge. The labelled data set is then utilised to aid in the model's training, with the results being used to mark the remaining unlabelled data. When all of the data has been labelled, the model is trained on it.
Reinforced learning: A relatively new advancement in Machine Learning, a reinforcement learning algorithm learns and develops to achieve a specific goal through trial and error. It tries out numerous choices before using rewards or penalties to help it make the best decision to achieve the goal.
Data Visualisation
Data representation in a visual or graphical style is known as data visualisation. It allows decision-makers to see analytics visually, making it easier to grasp complex topics or spot new patterns. Data visualisation aids in telling tales by transforming data into a more understandable format and showing trends and observations. A good visualisation tells a story by reducing noise from data and emphasising the essential facts. The common types of data visualisation include charts, tables, graphs, maps, infographics and dashboards.
It helps the businesses in the following ways:
- To determine which areas require attention or improvement.
- To determine which elements have an impact on customer behaviour.
- Assist in deciding which products to place where.
- Help to estimate sales volume.
Cohort analysis
Cohort analysis is employed to analyse the data and group it based on shared user behaviours during a specific period. It is a beneficial technique for boosting customer retention and happiness. By analysing behavioural patterns, it is possible to gain valuable information about what type of campaign is most likely to be successful, which customer group is most likely to buy your goods, and their expectations from a product. Cohort analysis can bring several advantages to a company:
Increased Customer Lifetime Value (CLV): Cohort analysis' capacity to assist a firm in improving client retention improves the CLV, which is the total money a business generates from a customer throughout their relationship.
Stronger relationships with loyal customers: Cohort analysis helps you discover your most loyal customers, allowing you to target them more precisely and encourage them to stay with you for as long as possible.
Better testing of new designs: In most cases, tests cannot predict how well a new design of a product will perform in the market. With the aid of cohort analysis, generate a cohort based on interactions with the latest design and compare it to the conversion rate of those that haven't.
Regression Analysis:
It is a powerful statistical method used to estimate the link between dependent (outcome) and independent (features) variables. The goal of regression analysis is to figure out how one or more factors may influence the dependent variable to spot trends and patterns. It is crucial for projecting future trends and generating forecasts.
To perform a regression analysis, you must first establish a dependent variable that you believe is influenced by one or more independent factors. After that, you'll need to create a comprehensive dataset to work with. Using surveys to get data from your target consumers is a great way to get started. All of the independent variables you are interested in should be addressed in your survey.
Different sectors like banking, insurance, retail, pharmacy, e-commerce and others used regression techniques to yield valuable, actionable business insights.
Advanced Analytics gives companies a greater understanding of data patterns and behaviour, allowing them to forecast future actions. It provides a substantial strategic advantage by revealing new business prospects and potential innovations, a deep awareness of customer and employee behaviours, fresh ways of looking at existing problems, and operational improvement opportunities, increasing revenue or lowering costs.Advanced Analytics analyses information from various data sources using predictive modelling, Machine Learning, and business process automation.
PARAMETER ACTION + SHEET ACTION
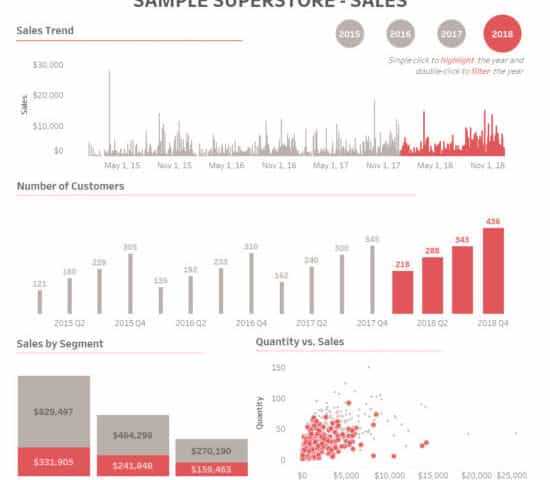
Parameter Action + Sheet Action: Extended Tableau Interactivity
Tableau has included lots of sought-after features into its latest release, Tableau 2019.2. If you’ve been eagerly looking forward to the release of the latest Tableau version to try out the whole new Parameter Actions, well – the wait is over!
In our previous blog post about Tableau 2019.2, we had already covered some of the major features of the release. In this blog, we will be diving deep into ‘parameter action’ and the combination of Parameter Action + Sheet Action with a simple example using Sample-Superstore dataset.
What are Parameter Actions?
Parameters are constant values created by a user to perform certain functions in Tableau and can be used in calculations, reference lines and some other analytic scenarios. A parameter can be a set of strings, numbers, etc. With parameter, the user can able to select only one value at a time.
With parameter actions, users have the option to control the parameter values dynamically when clicking or hovering on certain elements on a viz. We can use parameter actions in a worksheet or a dashboard which extends the interactive ability of Tableau. This enables the users to visually change the parameter value with few interactions, which is cool. Parameter action can unleash the possibilities for designers to come up with new levels of interactivity to the dashboards.
Steps to achieve Parameter Action + Sheet Action:
1. First, create the sheets of required KPIs. We have created 4 sheets;
- Sales Trend
- Number of Customers
- Sales by Segment
- Quantity Vs. Sales


2. Create a Year calc from ‘Order Date’ field.

3. Create a parameter using ‘Year’ calculated field. (This parameter is used in Parameter Action)

4. Create a calculated field ‘Parameter Calc’ which is used to color/highlight the selected year.

5. Drag the ‘Parameter Calc’ to Color and Size in marks shelf.

6. If you apply ‘Parameter Calc’ to the created sheet, it will look something like this. The selected year in ‘Year Parameter’ will be highlighted with the color and size.

7. Now, we need a toggle to switch between years. So, we have to create a sheet like below,
(Like before, drag the ‘Parameter Calc’ to color and size in marks shelf)

8. Arrange the sheets in a dashboard. Give a header and format the texts, fonts, colors if required.

9. How to create ‘Parameter Action’
- Select Dashboard > Actions.
- In the Actions dialog box, click Add Action and then select Change Parameter.

- Select ‘Year Toggle’ as Source sheet and choose ‘Select’ in Run action on:
- Select ‘Year Parameter’ as Target Parameter.

- Now, if you select a year, the parts in the sheet corresponding to the selected year will get highlighted in color and other parts are grayed out.
10. How to create ‘Sheet Action’
- Select Dashboard > Actions.
- In the Actions dialog box, click Add Action and then select Filter.
- Select ‘Year Toggle’ as Source sheet and all the sheets in the dashboard as Target Sheets
- Choose ‘Select’ in Run action on and choose ‘Show all values’ in Clearing the selection will

Now, we have set both Parameter Action and Sheet Action for ‘Year Toggle’ sheet.
If we single click on the year, it will highlight (Parameter Action) the year throughout the dashboard and if we double click on the year, it will filter out (Sheet Action) that particular year throughout the dashboard.

Beinex is a digital transformation organization en-rooted with ideas, innovation and unparalleled customer service. Our mission is to transform the way individuals and the organizations work with the data through innovation and experience.
If you are interested in learning more about the latest Tableau parameter actions and use cases, please contact us at training@beinex.com/ info@beinex.com
and we would be happy to schedule a Tableau demo or training for you and your company.



Generative AI and AWS: Enhance Customer Engagement and Business Growth with AWS AI Services
AWS AI services
AWS pre-trained artificial intelligence (AI) services easily integrate with your applications to address common use cases such as personalized recommendations, modernizing your contact center, improving safety and security, and increasing customer engagement. Because we use the same deep learning technology that powers Amazon.com and our machine learning services, you get quality and accuracy from continuously learning APIs. Explore purpose-built AWS AI services:
- Amazon Bedrock
- Amazon Q
- Amazon Transcribe
- Amazon Polly
- Amazon Textract
- Amazon Rekognition
- Amazon Lex
- Amazon Translate
- Amazon Personalize
- Amazon Augmented AI
- Amazon Comprehend
- Amazon Fraud Detector
- Amazon Kendra
Amazon Bedrock
Amazon Bedrock simplifies the development of generative AI applications by offering a fully managed environment with robust security and privacy features. It provides access to top-performing models from leading providers like AI21 Labs, Anthropic, Cohere, Meta, Stability AI, and Amazon, ensuring a wide range of AI capabilities. Businesses can customize these models using their proprietary data through fine-tuning and retrieval-augmented generation (RAG), enabling tailored solutions. Seamless integration with familiar AWS services through serverless deployment minimizes operational overhead. Additionally, Amazon Bedrock supports HIPAA compliance and adheres to GDPR regulations, ensuring data privacy and regulatory compliance.
Amazon Q
Amazon Q is a generative AI assistant that enhances work efficiency in organizations. It offers specialized features for software developers, business analysts, contact center staff, and supply chain analysts, helping them gain insights and complete tasks faster. With Amazon Q, companies can streamline processes, make quicker decisions, and improve productivity.
Amazon Transcribe
Amazon Transcribe is a fully managed automatic speech recognition (ASR) service that converts spoken language into written text. Utilizing a state-of-the-art, multi-billion-parameter speech model, it provides highly accurate transcriptions for both streaming and recorded speech. Thousands of customers rely on Amazon Transcribe to automate tasks, gain valuable insights, enhance accessibility, and improve the discoverability of their audio and video content.
Amazon Polly
Amazon Polly is a fully managed service that converts text into lifelike speech. It offers a variety of voices in multiple languages, allowing applications to cater to global linguistic, accessibility, and educational needs. With advanced neural networks and generative voice engines operating in the background, Amazon Polly synthesizes high-quality speech suitable for a wide range of use cases.
Amazon Textract
Amazon Textract is a machine learning service that automatically extracts text, handwriting, layout elements, and data from scanned documents. Unlike traditional OCR (optical character recognition) software, Amazon Textract employs machine learning to process various document types, including PDFs, images, and forms. Its capability to extract data in minutes rather than hours or days allows businesses to automate document workflows and enhance efficiency.
Amazon Rekognition
Amazon Rekognition enables businesses and developers to address computer vision requirements without needing machine learning expertise. Its scalable and cost-effective capabilities include facial analysis, object detection, and text recognition for various applications.
Amazon Lex
Using technology similar to Alexa, Amazon Lex allows developers to create conversational AI interfaces through natural language processing. It facilitates both voice and text interactions, making applications more intuitive and improving customer experiences.
Amazon Translate
Amazon Translate enables the localization of content for a diverse global audience, allowing for the translation and analysis of large volumes of text to facilitate cross-lingual communication among users.
Amazon Personalize
Amazon Personalize enhances customer experience through AI-driven personalization. With the Amazon Personalize recommendation engine, you can provide hyper-personalized user experiences in real-time at scale, thereby boosting user engagement, customer loyalty, and business outcomes.
Amazon Augmented AI
Amazon Augmented AI (Amazon A2I) enables you to conduct human reviews of machine learning (ML) systems to ensure accuracy. You can implement human reviews and audits of ML predictions tailored to your specific requirements, which may include multiple reviewers. Accelerate your time to market with prebuilt workflows, and continuously retrain your models to improve performance. Additionally, you can integrate human judgment and AI into any ML application, whether it operates on AWS or another platform.
Amazon Comprehend
Gain valuable insights from various types of text, including documents, customer support tickets, product reviews, emails, social media feeds, and more. Streamline your document processing workflows by extracting text, key phrases, topics, sentiment, and other relevant information from documents like insurance claims. Differentiate your business by training a model to classify documents and identify specific terms, all without requiring machine learning (ML) experience. Ensure the protection and control of your sensitive data by identifying and redacting Personally Identifiable Information (PII) from your documents.
Amazon Fraud Detector
Build, deploy, and manage fraud detection models without previous machine learning (ML) experience. Gain insights from your historical data, plus 20+ years of Amazon experience, to construct an accurate, customized fraud detection model. Start detecting fraud immediately, easily enhance models with customized business rules, and deploy results to generate critical predictions.
Amazon Kendra
The Amazon Kendra GenAI Index is a new feature in Kendra designed for retrieval-augmented generation (RAG) and intelligent search. It aims to help enterprises build digital assistants and create intelligent search experiences more efficiently and effectively. This index provides high retrieval accuracy by utilizing advanced semantic models and the latest information retrieval technologies. The Kendra GenAI Index can be integrated with Bedrock Knowledge Bases and other Bedrock tools to develop RAG-powered digital assistants. It can also be used with Q Business for a fully managed digital assistant solution. This index addresses common challenges faced when building retrievers for Generative AI assistants, such as data ingestion, model selection, and integration with various Generative AI tools. Key features of the Kendra GenAI Index include a managed retriever with high semantic accuracy, a hybrid index that combines vector and keyword search, pre-optimized parameters, connectors to a variety of enterprise data sources, and user permissions filtering based on metadata.
AWS Beinex Partnership
Generative AI’s potential is vast, from automating content creation to transforming entire industries. AWS’s secure infrastructure and AI services empower businesses to innovate confidently while safeguarding data integrity. Beinex is an AWS consulting partner, and we empower customers with AWS-managed services to host their BI solutions and much more on the cloud. Our cloud migration experts bring in best-in-class stability and reliability by understanding your business strategy and working closely with you to deploy AWS infrastructure as a service. Beinex has also achieved a Gold-level ranking for Cloud Consulting services in the Middle East by Consultancy-me for our excellence in client services and solutions in 2024.
Infusing a Dash of Freshness in Tableau: Relaunching Tableau Online as Tableau Cloud!
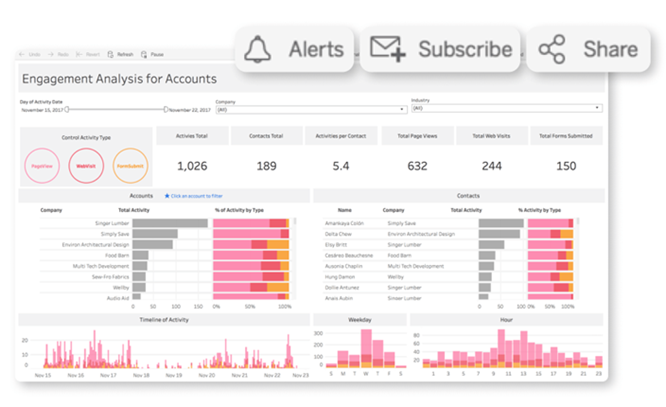
Tableau Cloud is a web-based data visualization tool. It is a part of the futuristic notion that enabled the evolution of a completely hosted, cloud-based solution, enabling wiser decisions through quick, flexible, and simple analytics. Tableau Cloud helps more people and teams obtain insights and become more innovative and competent decision-makers by distributing reliable data across enterprises, eventually leading to better, data-driven outcomes.
Tableau Cloud takes pride in the fact that the system is built to fit any enterprise architecture, with industry-leading security features, the highest certification requirements such as SOCII and ISO, and best-in-class governance capabilities to guarantee your data is always in the right hands.
The expected features are all here, with solid and intelligent additions such as Advanced Management, Data Stories, new embedded functionality, etc. These vital advancements add to the advantages of moving Tableau to the cloud, such as time savings, flexibility, and decreased costs. Still, they also give insights that evolve scale without having to install or maintain any software or hardware.
The most wanted features are here:
Advanced Management - Advanced Management contains several operational insight elements to gain information into visualisation load times, user interactions, number of views, and more. Admin Insights delivers easy-to-understand visualisations derived from the environment's usage statistics, and the Activities Log gives granular event data to create a record of activity. The newly added feature helps to handle critical analytics with ease. Features like flexible control, better security and manageability, and limitless scalability are designed to help the business thrive.
Data Stories – Data stories help to get clear, automated explanations for dashboards in no time. Make dashboard analytics simple with clear, automatic explanations. Big data is divided into critical aspects, and insights are provided in simple terminology
Embedded Analytics – Embedded Analytics integrates analytics seamlessly into the products and applications, surfacing insights to the users wherever they are, including public domains. It's straightforward to configure, integrate, and deploy Embedded Analytics right into your applications, products, and online portals. Tableau Cloud will allow administrators to share their workbooks and visualisations with the public, enabling users to view their information without logging in.
Tableau Cloud is an easy-to-use self-service platform, and all you must do is prepare your data, author, analyze, collaborate, publish, and share on Tableau Cloud
 Source: https://www.tableau.com/products/cloud-bi
Tableau Cloud is user-friendly, and its activation can be done with a finger snap. The first step is to configure the authentication mechanism and securely publish interactive dashboards and data because it is managed and hosted by Tableau.
The material will then be accessible from any browser or mobile device, allowing the team to collaborate and share analytics with everyone, anywhere. Simple, right!
Feel free to request a free trial using this link.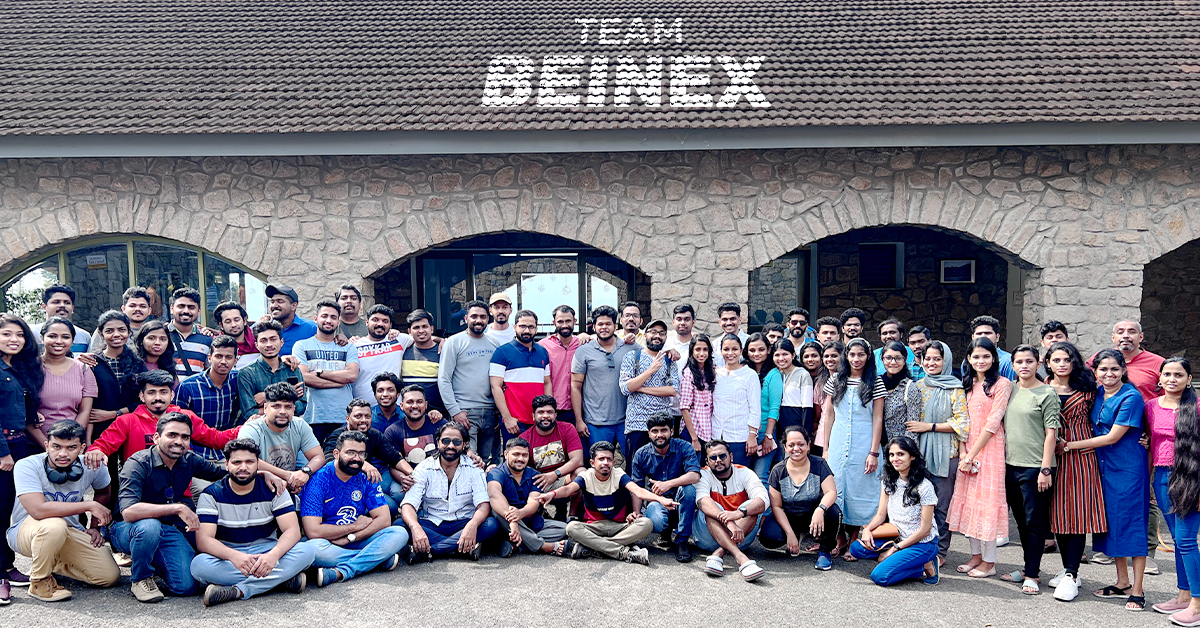
Just Go Wild: Beinex Offsite Visit to Munnar
We all boarded after breakfast from Edapally into the buses waiting as planned. Our journey to Munnar resembled the long-lost college trips, filled with songs, dances and ‘Antaksharis’. Finally, we reached our destination passing vast expanses of tea estates and dewy mountains.
Munnar is an exotic place with a breath-taking landscape and scenic spots. The chilly hill station stole our minds with its exotic flora and fauna. Our team stayed in a luxury resort: Mountain Club. The cottages chosen for us resembled the colonial architecture from the bygone era. The bedrooms were cosy, with a balcony open to the rustic surroundings.
The lunch was a luxurious affair that included starters to desserts. We used the mealtime to get to know more about each other. Then, we all attended the motivation speech by Sibu Varghese which was quite insightful, followed by an interactive session. Then, we interacted with and introduced each other. Personal interaction creates tight bonds and has an integral role in team building. We all broke the ice by sharing our stories and telling jokes. It was fun to get to know each other.
 In the evening, we had a wild-theme based gala party, and all got dressed up in sync with the theme, ‘Just Go Wild’. It was fun to watch everyone from the Manager to the employees dressed up in the same theme. We had an exhilarating DJ party manned by Darryl Gaulbert which made us all shake a leg to the tune. We danced and roared to the music. It was indeed wild!
The following day after breakfast, we met our founder Indumon Das, who had a chat with us regarding the journey of Beinex and his vision. It inspired us all to have a dream and pursue it fearlessly. Some of us accessed the infinity pool late afternoon and had great fun swimming and playing pool ball.
It was a blissful evening based on an ethnic wear theme. We competed for the best ethnic outfit of the evening. The different hues and styles made the evening stunning. Everyone flaunted the traditional wear in style. We had a musical evening with a live barbeque and a sumptuous dinner.
Finally, the day of leaving Munnar dawned; March 19. We all had breakfast in the morning and packed our backpacks. Most of us were pretty reluctant to leave Munnar as we were not ready to lose the bond we created together. Nonetheless, we vowed to stay connected. We boarded the buses around 10 AM and waved goodbye to Munnar.
When we reached Edapally in the evening, a surprise goody bag was waiting. It was an impressive and admirable gesture from our firm. Beinex has a culture of nurturing growth and spreading positivity, and employees’ comfort is the priority here.
In the evening, we had a wild-theme based gala party, and all got dressed up in sync with the theme, ‘Just Go Wild’. It was fun to watch everyone from the Manager to the employees dressed up in the same theme. We had an exhilarating DJ party manned by Darryl Gaulbert which made us all shake a leg to the tune. We danced and roared to the music. It was indeed wild!
The following day after breakfast, we met our founder Indumon Das, who had a chat with us regarding the journey of Beinex and his vision. It inspired us all to have a dream and pursue it fearlessly. Some of us accessed the infinity pool late afternoon and had great fun swimming and playing pool ball.
It was a blissful evening based on an ethnic wear theme. We competed for the best ethnic outfit of the evening. The different hues and styles made the evening stunning. Everyone flaunted the traditional wear in style. We had a musical evening with a live barbeque and a sumptuous dinner.
Finally, the day of leaving Munnar dawned; March 19. We all had breakfast in the morning and packed our backpacks. Most of us were pretty reluctant to leave Munnar as we were not ready to lose the bond we created together. Nonetheless, we vowed to stay connected. We boarded the buses around 10 AM and waved goodbye to Munnar.
When we reached Edapally in the evening, a surprise goody bag was waiting. It was an impressive and admirable gesture from our firm. Beinex has a culture of nurturing growth and spreading positivity, and employees’ comfort is the priority here.
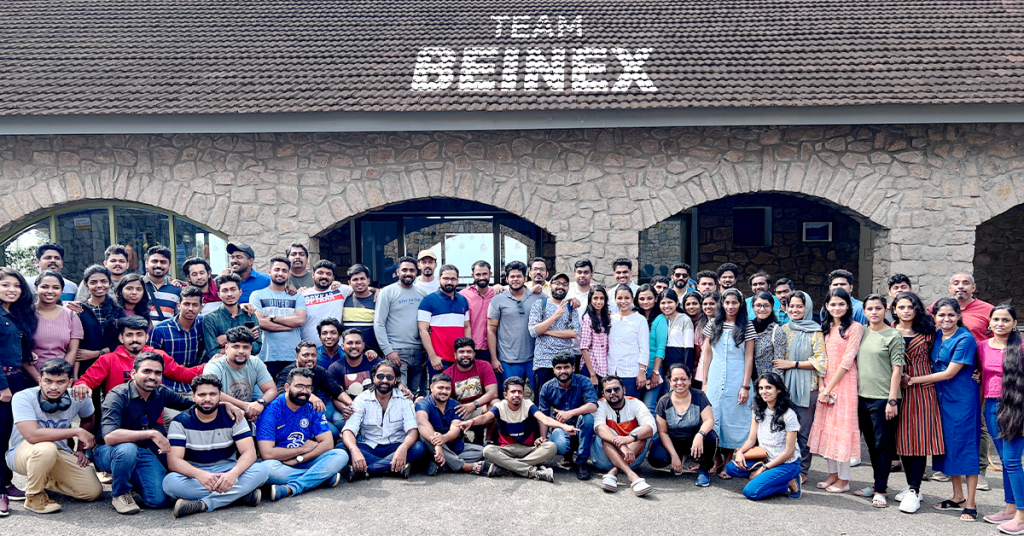 Yes, we had a fantastic time together. After this retreat, our rejuvenated and motivated minds are ready to bounce back to work with enhanced spirit. We are looking forward to more team building sessions in the future to meet each other more often.
In the evening, we had a wild-theme based gala party, and all got dressed up in sync with the theme, ‘Just Go Wild’. It was fun to watch everyone from the Manager to the employees dressed up in the same theme. We had an exhilarating DJ party manned by Darryl Gaulbert which made us all shake a leg to the tune. We danced and roared to the music. It was indeed wild!
The following day after breakfast, we met our founder Indumon Das, who had a chat with us regarding the journey of Beinex and his vision. It inspired us all to have a dream and pursue it fearlessly. Some of us accessed the infinity pool late afternoon and had great fun swimming and playing pool ball.
It was a blissful evening based on an ethnic wear theme. We competed for the best ethnic outfit of the evening. The different hues and styles made the evening stunning. Everyone flaunted the traditional wear in style. We had a musical evening with a live barbeque and a sumptuous dinner.
Finally, the day of leaving Munnar dawned; March 19. We all had breakfast in the morning and packed our backpacks. Most of us were pretty reluctant to leave Munnar as we were not ready to lose the bond we created together. Nonetheless, we vowed to stay connected. We boarded the buses around 10 AM and waved goodbye to Munnar.
When we reached Edapally in the evening, a surprise goody bag was waiting. It was an impressive and admirable gesture from our firm. Beinex has a culture of nurturing growth and spreading positivity, and employees’ comfort is the priority here.
Yes, we had a fantastic time together. After this retreat, our rejuvenated and motivated minds are ready to bounce back to work with enhanced spirit. We are looking forward to more team building sessions in the future to meet each other more often.