How AI Decision-Making is Improving Enterprise Outcomes
Blog
Share 
Agriculture and the Internet of Things: The Present and the Future
 6 October 2022
  Admin
Admin . A farmer must be knowledgeable about soil, climate, and market. If something goes wrong with any of these areas the result will be devastating. This is where one of mankind’s biggest inventions, the Internet, offers the most reliable assistance. The Internet of Things has a plethora of devices that can make the work of a farmer far easier and more productive.
Smart Sensors
Smart sensors are the number one in a huge list of IoT devices being used in agriculture. These devices can be used to gather data about various aspects of agriculture like the humidity, acidity or mineral contents of the soil. Earlier these kinds of knowledge were something that farmers were supposed to gain after many years of experiences of both gain and loss. Or they had to depend on time taking and distant laboratories. But even a lab test had a limited chance of being hundred percent accurate as the soil’s quality could change in the blink of an eye. Smart sensors can provide the farmer with accurate data in real time. The data collected can precisely calculate and predict many changing or evolving aspects like the humidity content of the soil. These data can help decide:
- The crops to be planted
- The manures to be used
- The amount and timing of watering
- The market price for the final product
Drones
Next in the line is the use of drones. These can be used to:
- Observe vast areas and collect important information that can help decide the most efficient methods of cultivation.
- Provide the farmer with a bird’s eye view, thereby reducing the time and effort wasted in surveying the land personally.
- Assist in remote application of pesticides and herbicides.
- Track the cattle or scrutinize their health.
The data collected by sensors and drones can be used to create a plan through which the farmers can guarantee a good output with minimum input and loss. This will reduce a great percentage of both financial and manual investment. Besides, instead of depending on one’s gut feelings, a farmer can take a multitude of important decisions with scientifically backed technology. IoT devices can be easily operated by the farmers by connecting it to a laptop or mobile phone. There are various apps that are already very popular for providing agricultural data. There are also various government backed projects aimed at collection of data, providing online solutions and even arranging financial support for the smart framer.
Smart Greenhouses
Another IoT contribution is Smart Greenhouses. Greenhouses always contain plants which are out of their natural habitat and therefore need extra care. IoT enabled greenhouses can help:
- Monitor the procedures of watering
- Adjust the humidity inside
- Analyse and provide proper lighting
- Ensure proper balance in delicate matters like the level of carbon dioxide, temperature, etc.
- In disease control by providing a close watch on all the plants’ vitals.
Such precise and high level of attention makes sure that there is no contamination in the greenhouse environment that could lead to spread of diseases. It can also help in detection or prevention of theft, which is a big risk especially if the plants are of rare or protected species.
Livestock Management
IoT in livestock management is bringing about revolutionary changes. With the spread of COVID-19, it is now a very crucial requirement that the livestock are healthy throughout their life. Even a small disease in the animal could turn out to be dangerous for the human who finally consumes it. Also spread of diseases in small animals like poultry can lead to devastatingly large loss for the farmer. Smart devices can help:
- Track the vitals of each animal or bird through devices which are wearable.
- Alert the farmer of even slight variations in the vitals via SMS, notifications, etc.
- Administer medicines at the correct time, to any number of animals without having to keep manual tabs
All these crucial routines help in keeping diseases in check and thus reduce livestock loss.
There are many more IoT powered devices that are revolutionizing the field of livestock management like Geo-tagging and Geo-fencing.
- Geo-tagging: It is used to locate the cattle that has strayed away from the herd or gone missing. Geo-tags are especially useful in case of natural calamities like flood, tsunami, landslide, etc. For example, the farmers of Kerala in South India used geo-tags to locate their animals that had either gone missing or died in the flood of 2018.
- Geo-fencing: It is another popular method and it uses GPS to monitor and keep the cattle within a boundary without actual fencing. This can help in detecting cattle theft or even wild animal attacks on the livestock.
The Limitations and Solutions
IoT is already here to stay in the fields of agriculture, and there is more to come. But like anything else IoT in agriculture has certain cons. These limitations can thankfully be eliminated.
| Limitations | Solutions |
|---|---|
| The data that is being collected by the various devices is stored on cloud. So the farmers are required to have a basic know-how of data analyzing and even device maintenance. |
|
| IoT devices need a lot of investment and the farmers might find it difficult to find funds for them. |
|
| Another area that requires improvement is the availability of fast internet connectivity. Internet is still something expensive or even unavailable in many parts of the world. There are places too remote to have net access. | These limitations are being dealt with and hopefully can be improved with the help of technologies like space-based internet systems. |
The Future
The agriculture IoT market is estimated to grow from USD 11.4 billion in 2021 to USD 18.1 billion by 2026 at a CAGR of 9.8% during 2021-2026, as per ResearchAndMarkets.com.
A few insights can be:
- Precision Aquaculture: The agriculture IoT market for the precision aquaculture application segment is projected to register the higher CAGR during the forecast period, by application. Increasing demand for real-time tracking of fishing activity is the major reason behind the high growth of the agriculture IoT market in aquaculture farm monitoring applications.
- Production Planning: The production planning stage segment of the agriculture IoT market is estimated to register the largest market share in 2026, by the farm production planning stage.
- Small Farm Segment: The agriculture IoT market for small farm segment is projected to register the higher CAGR during the forecast period, by farm size. Small farms are expected to adopt automation and other advanced technologies at the highest rate in the coming years due to the reducing cost of farm automation equipment and advancements in technology that make it more feasible to deploy automation tools even on smaller farms to achieve high returns on investments.
- Automation & Control Systems: The automation and control systems for the precision farming hardware segment of the agriculture IoT market is estimated to register the largest market share in 2026, by hardware type. The increasing demand for drones/unmanned aerial vehicles (UAVs) is a major reason behind the high growth of the market for automation and control systems.
APAC is likely to be the fastest-growing agriculture IoT market during the forecast period. Agriculture IoT techniques are expected to be adopted at a high rate in the region. This region consists of emerging countries such as India, China, and countries in Southeast Asia. Rapidly growing population, availability of arable land, and strong government support for farmers through subsidies in these regions are the major factors driving the adoption of agriculture IoT technologies in APAC.
These projections show that IoT based agriculture is here to make a big splash and is a boon of science.
The global population is swelling beyond our collective imagination. With a projected increase to 8.5 billion by 2030, the biggest demand will be on a most essential need of the humankind, food. Though food is the number one priority, cultivating it is (still) not an easy task.
Related Articles

Advanced Analytics and Emerging Trends(Infographic)
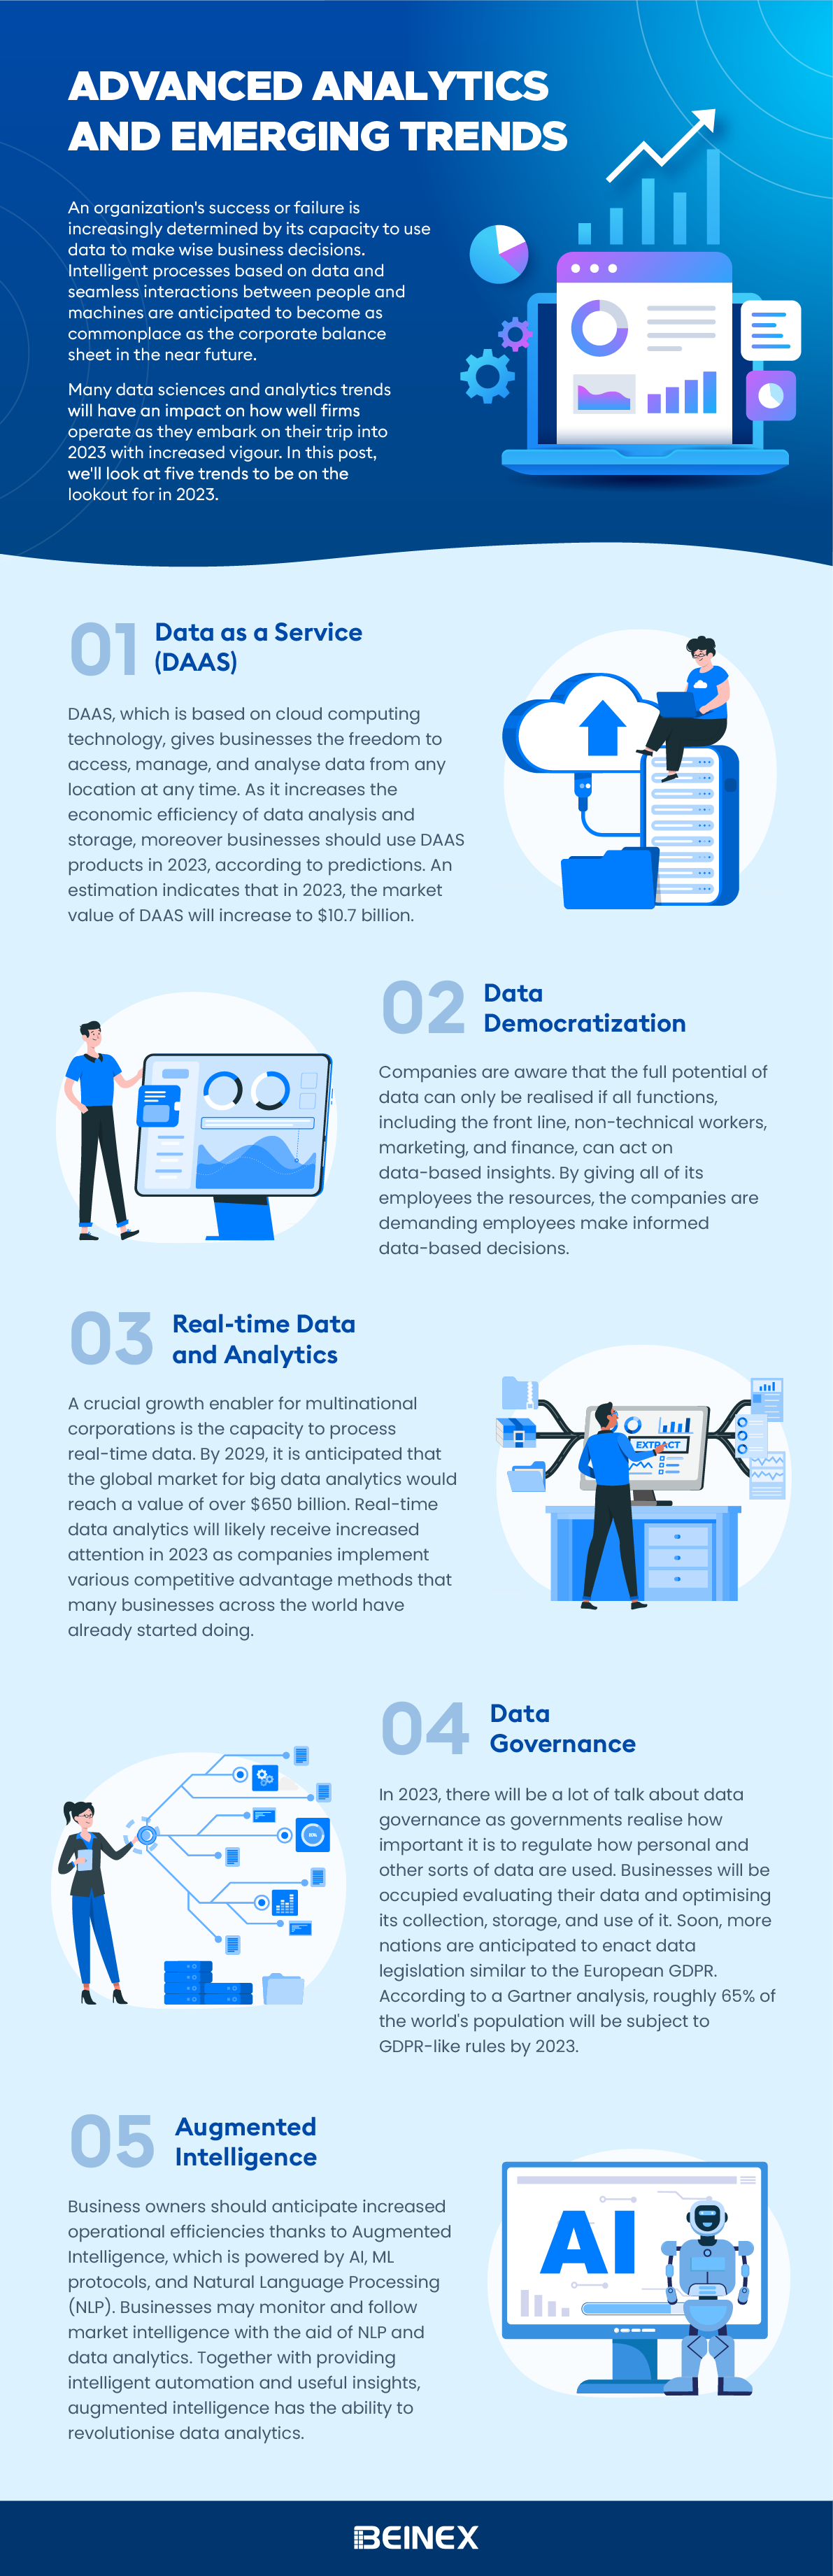
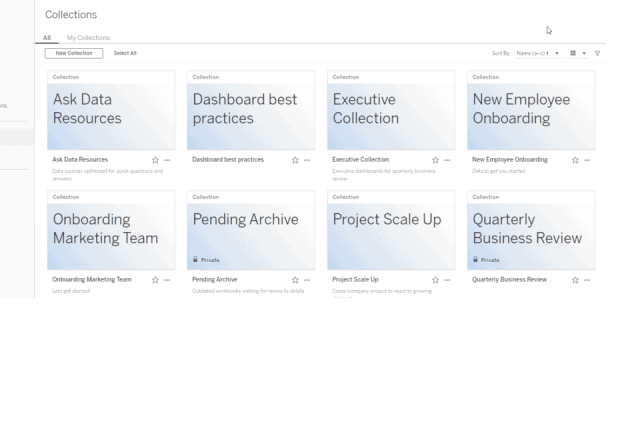
Tableau 2021.2 : New Features
This has changed the way we interpret information by giving us a look into past insights but also to forecast future events, allowing us to make informed decisions.
Tableau 2021.2. includes ‘ask and explain data’ for viewers, allow connected desktops, Collections, and many more valuable features. Some of the key enhancements are listed below.
Collections provides a new format to organize content across your sites on both Tableau Online and Server into manageable folders. You may group item together from different projects and workbooks and you can reuse content in multiple contexts without additional storage or resources. Collections also makes it easier to share content around a central theme. For example, you can create a “Daily Sales” collection that includes dashboards with daily sales statistics, ETL data flow, data sources, etc.
Collections helps you congregate your data. You are given the leeway to create, explore and save your content privately. Another key feature of ‘Collections” is that users can create customized collections which are by default private. However, you are given the option to share the collection with any authorized users you choose to provide access to.
1) User Management Enhancement


In earlier versions, a subscribed user, deleted by an admin, was not erased from the system entirely. They were then classified as an 'unlicensed user'.
With version 2021.2, the subscribed creator will be deleted automatically when an admin deletes a user either via the UI or the REST API, without the extra step of reassigning the subscription ownership.
2) Ask Data Enhancements
Ask Data Lenses
A new feature introduced with this update is 'Ask Data Lenses'. It allows for easy data curation with defined columns and value synonyms and also provides suggested questions to allow for more inclusive data from a variety of sources.
(The update brings a new content type that is Ask Data Lenses, making it easy to curate data with the definition of column and value synonyms and suggested questions so you can better leverage existing published data sources.)
They are created alongside published data sources Ask Data use case(s) while maintaining the underlying data source as its own entity.
These 'lenses' are comparable to ‘views’. For those of you who are adept with SQL, where you can write selected statements specifically to extract the required columns, give definitions, whilst maintaining the integrity of the data source. Similarly, once created, ‘lenses’ can be accessed by viewers, opening Ask Data to a new class of users that struggle to self-serve their needs today.
Entity Search
Entity Search shows users search results of keywords, like the Google search box. Ask Data gives you word-by-word search results, giving you instant feedback on your data and what Ask Data can do. Ask Data will automatically choose the most relevant interpretation of your search and these search results help you build that input more effectively by selecting the right fields and values in the data set. Ask data learns from your selections to choose smarter defaults for future searches.

MFA allows users to easily add an additional layer of security to their accounts.
This feature unlocks the ability for Tableau Online customers who utilize native Tableau ID authentication to enforce multi-factor authentication (MFA) when their users sign into their sites. End-users can use applications like Salesforce Authenticator or Google Authenticator to perform additional verification of their identity when they log on to Tableau.
MFA makes it much harder for common threats like phishing attacks and account takeovers to succeed. MFA is one of the easiest and most effective ways customers can enhance login security and safeguard their business and data against external threats.


 Easily rename multiple fields in prep allows creators to transition seamlessly from web authoring to Tableau Desktop with a single click of a button. Creators will now be able to edit any workbook that they have permission to on Desktop.
Prior to 2021.2, users had to manually change each header name. For example, if a user wanted to change “Customer” at the start of multiple header names, they would need to click on each field name and individually change/remove “Customer” in the field name. Not a big deal when there are less than 10 columns to update. However, for customers with data sets of 50+ columns, it is more cumbersome to have to individually change each field name. This feature allows a customer to quickly add a prefix, rename or add a suffix to multiple fields collectively.
Easily rename multiple fields in prep allows creators to transition seamlessly from web authoring to Tableau Desktop with a single click of a button. Creators will now be able to edit any workbook that they have permission to on Desktop.
Prior to 2021.2, users had to manually change each header name. For example, if a user wanted to change “Customer” at the start of multiple header names, they would need to click on each field name and individually change/remove “Customer” in the field name. Not a big deal when there are less than 10 columns to update. However, for customers with data sets of 50+ columns, it is more cumbersome to have to individually change each field name. This feature allows a customer to quickly add a prefix, rename or add a suffix to multiple fields collectively.
 Tableau Prep is expanding its output capabilities to include Google BigQuery, enabling you to add or update data in Google BigQuery with clean, prepped data from your flow each time it is run.
TABLEAU DESKTOP 2020.2 – Key Features
1) Maps: Spatial File Support
The Marks Layers Control SP1 feature provides a control that allows users to toggle the visibility of layers on a map viz. The control works like a filter and the user is free to choose which layer(s) to view in order to answer their question. In addition, the user can control the interactivity of the map viz by selectively enabling or disabling selection on the layer in question.
Tableau Prep is expanding its output capabilities to include Google BigQuery, enabling you to add or update data in Google BigQuery with clean, prepped data from your flow each time it is run.
TABLEAU DESKTOP 2020.2 – Key Features
1) Maps: Spatial File Support
The Marks Layers Control SP1 feature provides a control that allows users to toggle the visibility of layers on a map viz. The control works like a filter and the user is free to choose which layer(s) to view in order to answer their question. In addition, the user can control the interactivity of the map viz by selectively enabling or disabling selection on the layer in question.
 Toggle button – Our users can now use a button to show/hide any dashboard zone, floating or tiled. This function was previously limited to floating horizontal and vertical containers only.
URL support for images – Users can now add images via external URLs, which also provides GIF support for images on the internet and workbooks. Loading these images will be time-efficient.
Toggle button – Our users can now use a button to show/hide any dashboard zone, floating or tiled. This function was previously limited to floating horizontal and vertical containers only.
URL support for images – Users can now add images via external URLs, which also provides GIF support for images on the internet and workbooks. Loading these images will be time-efficient.
Geo Spatial Analysis Using Map Layers, Buffer Calculations, and Parameter Actions
For instance, the dashboard given below mirrors a project undertaken for a client seeking insights into the pandemic's impact on their business across specific areas. They wanted to determine the number of stores stocking their product within a defined radius, highlighting the local business impact amid the pandemic.
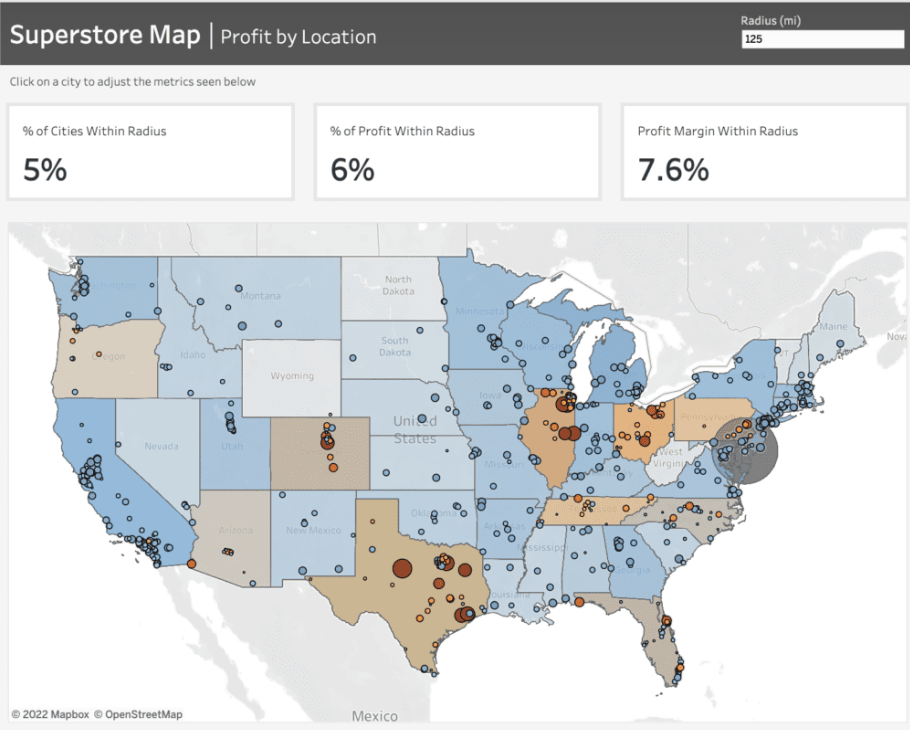 To craft the map showcased in this dashboard, we leverage Tableau's map layers feature introduced in version 2020.4. For further insights into this functionality, additional details can be found here.
Prior to initiating the map creation process, frequently refer to the Profit Margin field. Here's the calculation for this field: it computes the percentage of Sales that translates into Profit. This calculation enables us to gauge the profitability derived from our sales figures.
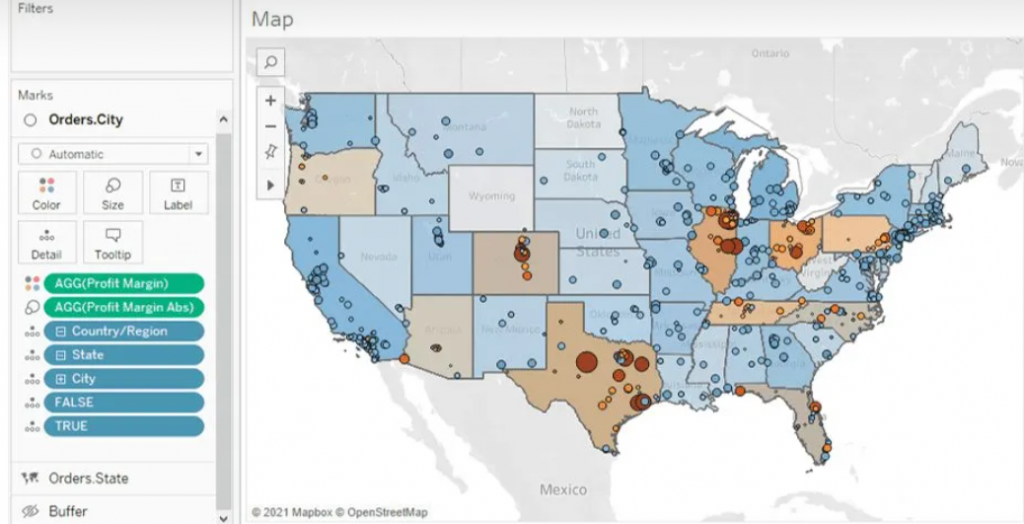
 For the States map layer, the State field is utilized and placed on the 'Detail' shelf. Each state is color-coded based on its Profit Margin.
Moving to the Cities layer, the City field is added onto the top left area labeled "Add a Marks Layer." To ensure the visibility of every city, the State level of detail is included as well. This accounts for cities existing in multiple states, displaying every city/state combination. Cities are color-coded using the Profit Margin field, with additional color based on the absolute value of the Profit Margin. This helps visualize the range and direction of profitability for each city.
Buffer Calculation
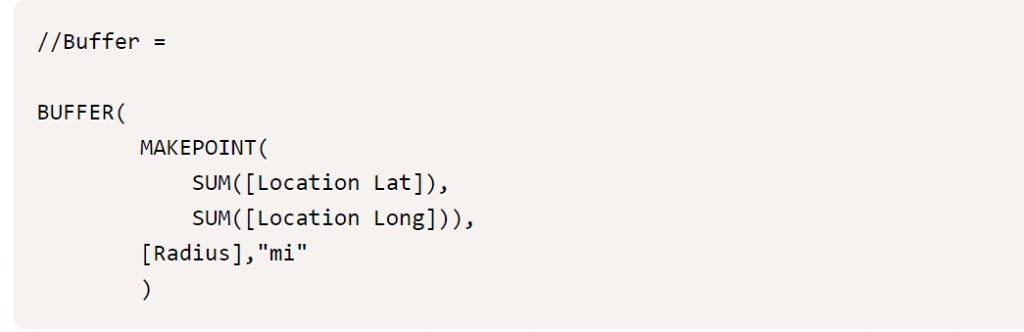
The Buffer calculation generates a radius, known as a "buffer," around a specific map point, defined within the syntax parameters. Here's the syntax breakdown for the Buffer: The initial part determines the center location, followed by the distance around the point, and finally, the chosen unit of measurement.
 To establish the desired centroid point, we employ the Makepoint function. This function simply utilizes latitude and longitude coordinates to generate a point on the map. Below is the calculation illustrating its usage.
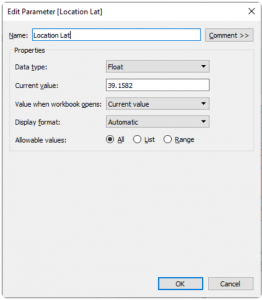
To achieve the interactivity you desire, you'll begin by creating three parameters: [Location Lat], [Location Long], and [Radius]. These parameters offer flexibility, allowing you to adjust them within the dashboard interface.
As you click on different cities, the [Location Lat] and [Location Long] fields dynamically change, altering the central point. Meanwhile, the [Radius] field, functioning as an input parameter, enables you to modify the radius distance according to your preferences. This setup grants you personalized control over these parameters directly within the dashboard.
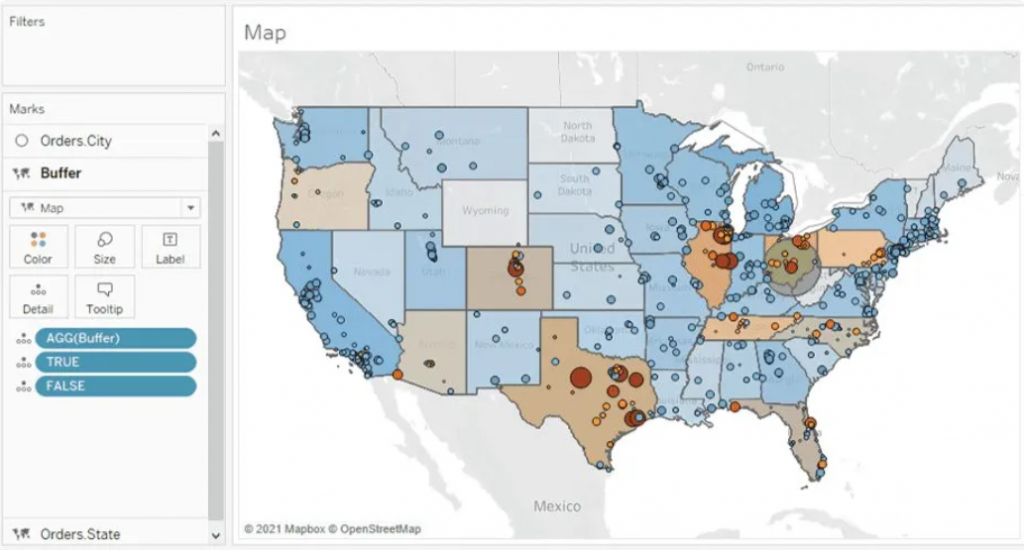
With the creation of the final map layer field, you can now drag this field to the top left of the map and add it to the existing layers. Once done, you'll have all the map layers integrated into the map, allowing you to recreate the dashboard as depicted below. This comprehensive setup will mirror the dashboard layout and functionality.
Parameter Actions
Parameter Actions are essential at this stage to ensure dynamic interaction within the map layers. By implementing parameter actions, we enable the Location Lat and Location Long fields to adjust dynamically when clicking on a city. This action directly affects the MAKEPOINT() field within the Buffer calculation, effectively altering the radius location. Below, you can observe the setup of the parameter action and how it facilitates this dynamic transformation.
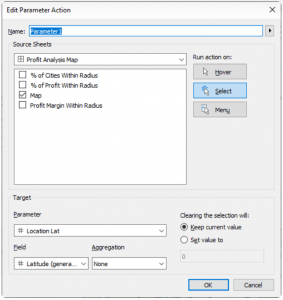 Finally, we aim for these parameters to influence the available metrics showcased at the top of the dashboard. These metrics offer insights into the concentration of profit and profit margin within the selected radius. Below, you'll find the supporting calculations and the formulae for the metrics displayed on the dashboard. These metrics serve as indicators of profitability and profit margin concentration within the chosen radius.
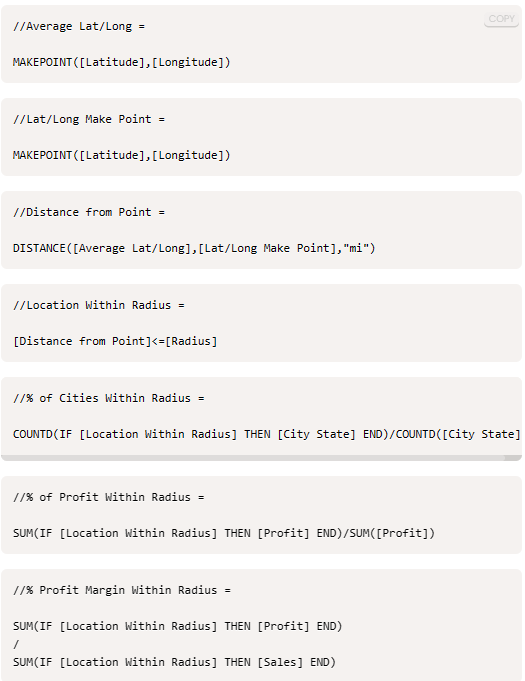
Wrapping up, creating interactive data visualizations opens doors to explore and comprehend information, fostering informed decision-making and exploration of new analytical paths.

Snowflake Cloud Services Layer: The Silent Workhorse in Architecture and its Five Key Functions
These services link together all the Snowflake components to handle user requests, from login to query dispatch. The compute commands that Snowflake procured from the cloud provider is also used by the cloud services layer. Every day, Snowflake processes petabytes of data and thousands of customer accounts.
The cloud service layer enables the management of a customer’s account, and it includes:
Authentication
Snowflake allows flexible authentication methodologies like Local, Active Directory, Multifactor and SAML Authentications. It permits the use and maintenance of Snowflake user credentials like login name and password. In short, account and security managers can create users with passwords stored in Snowflake or other authenticators and users can access Snowflake using their login credentials.
Infrastructure Management
With the capacity to immediately spin up and down an almost infinite number of concurrent workloads against the same, single copy of data, the users need not be concerned about the size of the data or the details about how a cluster is powered up instantly, with a few clicks on the corresponding interface. Behind the scenes, the infrastructure manager communicates and provides instructions to the corresponding cloud provider to immediately spin up the resources required by the users.
Metadata Management
Snowflake metadata management is a part of the data governance discipline which involves processes, policies, workflows, and technology to identify, and organise Snowflake metadata for data consumers. Metadata management is the key to adding actionable context to the assets in the Snowflake data warehouse.
Metadata management in Snowflake makes it easy to search, filter, and find data assets by various criteria. Metadata gives you complete visibility into the lifecycle of a data asset. Snowflake stores all the metadata in a centralized component called Cloud Services.
Snowflake automatically creates metadata for data residing both externally (S3, Azure, GCP) and internally (within Snowflake), stores it as a key-value pair (dictionary), and makes it available via the Information Schema.
Query Parsing and Optimisation
Users need not be much concerned regarding query performance. It is handled automatically via a dynamic query optimization engine in the cloud services layer. It can model, load, and query the data.
The cloud services layer does all the query planning and query optimization based on data profiles that are collected automatically as the data is loaded. It automatically collects and maintains the required statistics to determine how to distribute the data and queries most effectively across the available compute nodes.
Snowflake's query caching retains the outcomes of all queries run during the previous 24 hours. The query results returned to one user are accessible to any other user on the system who conducts the same query. It helps to save time by drastically reducing retrieval time when data is pulled from cache memory. The cost is also saved by not spinning up the compute clusters.
Access Control
Access to Snowflake depends on Access Control privileges which determine who can access and operate on Snowflake. According to the Snowflake model, users or other roles with rights allocated to them can gain access to secure items. Every secure object also has an owner who can provide access to other roles. Unlike user-based access control models, which provide rights and privileges to individual users or groups of users, this model does not do it. The Snowflake approach is intended to offer a sizable level of flexibility and control. It enables Snowflake to provide row-level security and protect PII through dynamic data masking.

Learning to Trust Zero Trust
ZTA in Simple Terms
It is a cybersecurity paradigm focused on enterprise resource protection. This includes data; no matter where it resides, cloud or on-premises, and resources like printers, compute resources and Internet of Things (IoT) actuators. The objective of the paradigm is to prevent unauthorised access to data and resources but at the same time enable authorised and approved subject to have access to the same. The word subject can mean user, device or an application/ service. The paradigm also envisions making the access control enforcement as granular as possible. Thus, “Zero trust architecture (ZTA) is an enterprise’s cybersecurity plan that utilizes zero trust concepts and encompasses component relationships, workflow planning, and access policies. Therefore, a zero-trust enterprise is the network infrastructure (physical and virtual) and operational policies that are in place for an enterprise as a product of a zero trust architecture plan.” Zero trust (ZT) provides a collection of concepts and ideas designed to minimize uncertainty in enforcing accurate, least privilege per-request access decisions in information systems and services in the face of a network viewed as compromised. The crux of the concept is that trust must be continually evaluated. If a subject needs access to data or resources, it is granted after authentication and authorisation, but it will not go beyond the minimum privileges needed to perform the mission.Benefits of Implementing ZTA
The ZTA paradigm comes packed with a slew of benefits:- Supporting employees/ workers with secure and reliable access to a multitude of resources from anywhere using any device, any time
- Resource protection irrespective of whether it is on-prem or cloud
- Improving visibility and governance: who, what, and how users are accessing enterprise data and apps.
- Limiting of insider threat borne of the need-to-know approach to resource access
- Limiting of lateral movements of attackers in the system which perimeter security-oriented networks are otherwise prone to.
- Limiting the cost for recovery and mitigation
- Ensuring confidentiality and security of sensitive enterprise data
- Enhanced risk mitigation courtesy of continuous assessment and review of resource access
ZTA: How it Works
The Zero Trust Architecture evaluates the level of confidence about the subject’s identity for a unique request and if the device used to place the request have proper security posture. The system also evaluates if there are other factors that should be considered and that change the confidence level. Also the access rules are made as granular as possible to enforce those least privileges needed to perform the action in the request. Image courtesy: https://nvlpubs.nist.gov/nistpubs/SpecialPublications/NIST.SP.800-207.pdf
Three terms assume significance in the context of Zero Trust. They are Implicit Trust Zone, Policy Decision Point (PDP) and Policy Enforcement Point (PEP). Implicit Trust Zone represents an area where all the entities are trusted to at least the level of the last PDP/PEP gateway. In other words, the PDP/ PEP engine decides as to whether a request for resource should be allowed access to the Implicit Trust Zone from where it can access the resource.
The PDP/ PEP gate is more like an airport security checkpoint. The passengers, once they have been through the security check are granted access to boarding gates where they can wait for the entry to the airplane. They are considered worthy of trust once they are through. The boarding area is thus the Implicit Trust Zone in the analogy. In our case, the idea is to explicitly authenticate and authorize all subjects, assets and workflows that make up the enterprise.
Image courtesy: https://nvlpubs.nist.gov/nistpubs/SpecialPublications/NIST.SP.800-207.pdf
Three terms assume significance in the context of Zero Trust. They are Implicit Trust Zone, Policy Decision Point (PDP) and Policy Enforcement Point (PEP). Implicit Trust Zone represents an area where all the entities are trusted to at least the level of the last PDP/PEP gateway. In other words, the PDP/ PEP engine decides as to whether a request for resource should be allowed access to the Implicit Trust Zone from where it can access the resource.
The PDP/ PEP gate is more like an airport security checkpoint. The passengers, once they have been through the security check are granted access to boarding gates where they can wait for the entry to the airplane. They are considered worthy of trust once they are through. The boarding area is thus the Implicit Trust Zone in the analogy. In our case, the idea is to explicitly authenticate and authorize all subjects, assets and workflows that make up the enterprise.
Challenges of Implementing the ZTA
For where there are opportunities, there are challenges. The road to ZTA implementation has its fair share of challenges.- There is no single solution encompassing all the tenets of Zero Trust. A one-size-fits-all approach is off the table for obvious reasons. Many different technologies need to be integrated and often, they are of varying maturity.
- Investment in terms of time, resources and technical capabilities. Migration of extant and legacy systems to a Zero Trust environment is not as easy as it sounds.
- And finally, there is no such thing as 100% fool-proof security. The ZTA control plane is still susceptible to compromise.
Overcoming ZTA Implementation Challenges
The challenges need a holistic approach to overcoming them.- Getting hold of visibility: The resources within the enterprise and who needs access to the same and when; these queries should be ascertained at a granular level. This exercise must be inclusive of:
- Identities
- Permissions
- Configurations
- Activities crisscrossing the cloud infrastructure which are about access to networks and resources that are publicly exposed.
- Managing risk: Continuous risk assessment exercise across the cloud IT stack including but not limited to:
- Identity
- Networks
- Compute & storage segments
- Publicly exposed resources if any
- Third-party risks originating from vendors, clients etc.