How AI Decision-Making is Improving Enterprise Outcomes
Blog
Share 
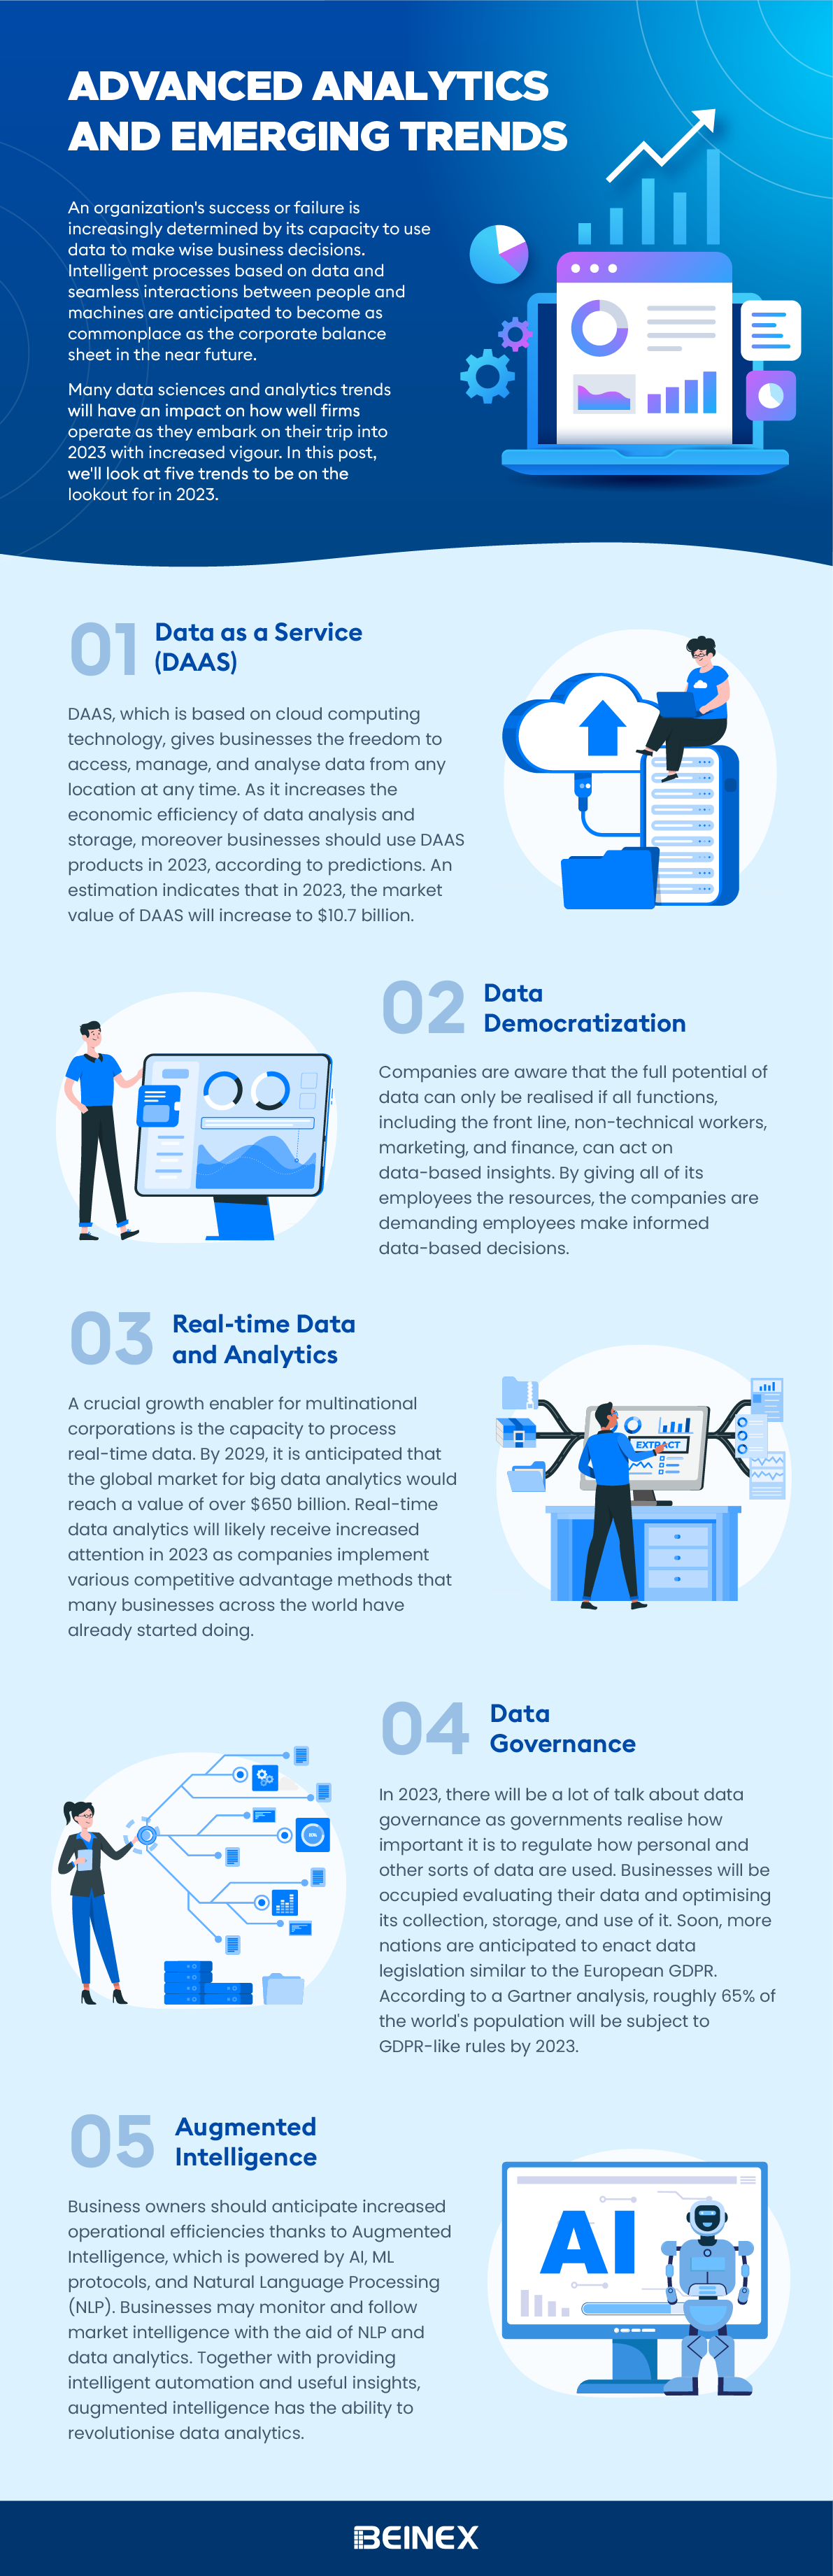
Advanced Analytics and Emerging Trends(Infographic)
-
Related Articles

Snowflake Time Travel: How to Leverage it to Achieve Optimal Results
Benefits of Snowflake Time Travel
With Snowflake Time Travel, you can access historical data, including data that has been altered or deleted, at any given point. This feature is helpful for various tasks, such as:- • Querying data that has been modified or erased in the past
- • Duplicating entire tables, schemas, or databases at or before specific dates
- • Restoring deleted tables, schemas, and databases
How to activate Snowflake Time Travel?
Activating Snowflake Time Travel is a simple process that requires no additional effort. It is automatically activated with a retention period of one day. Nonetheless, upgrading to the Snowflake Enterprise Edition is necessary to customise the Data Retention Period and extend it to 90 days for Databases, Schemas, and Tables. It's important to note that increasing the Data Retention Period results in additional storage usage, reflected in your monthly Storage Fees.
Data Retention Period in Snowflake
In Snowflake, Data Retention Period determine how long historical data is retained to support Time Travel functionality. When data in a table is altered, such as through deletions or updates, Snowflake maintains the previous state of the data so that Time Travel operations (like SELECT, CREATE...CLONE, UNDROP) can be performed on it. By default, all Snowflake accounts have a standard retention period of one day (24 hours).
However, the Retention Period can be adjusted at the account and object level in the Snowflake Standard Edition to 0 (or unset to the default of 1 day) for databases, schemas, and tables.
In the Snowflake Enterprise Edition or higher, the Retention Period can be set to 0 for temporary databases, schemas, tables, and temporary tables. For permanent databases, schemas, and tables, the Retention Time can be configured to any duration between 0 and 90 days.
Functions of Snowflake Time Travel SQL Extensions
Snowflake Time Travel SQL Extensions are special SQL commands that allow users to query historical data from a specific point in time using the Time Travel feature. These extensions enable users to perform various Time Travel operations, including:
- a. CLONE: This command creates a copy of a table, schema, or database at a specific point in time using Time Travel.
- b. UNDROP: This command restores a dropped table, schema, or database to a specific point in time using Time Travel.
- c. HISTORY: This command retrieves the history of changes made to a table, schema, or database over time using Time Travel.
- d. AS OF: This command retrieves data from a table as it appeared at a specific point in time using Time Travel.
Specifying a Custom Data Retention Period for Snowflake Time Travel
To specify a custom Data Retention Period for Snowflake Time Travel, you can use the DATA_RETENTION_TIME IN_DAYS argument in the command when creating a table, schema, or database. By default, the maximum Retention Time in Standard Edition is set to 1 day (i.e. 24 hours), while in Snowflake Enterprise Edition (and higher), it can be set to any value up to 90 days.
The Data Retention Time can be set in the way it has been placed in the example below.
To create a schema with a custom Data Retention Period of 60 days, you can use the following SQL command:
create table mytable(col1 number, col2 date) data_retention_time_in_days=60;
Modify the Data Retention Period for Snowflake Objects
To modify the Data Retention Period of a Snowflake object, any change made to the Retention Period affects both active data and data in Time Travel. Depending on whether the period is increased or decreased, the following impacts occur:
- a. Increasing Retention
- b. Decreasing Retention
Let’s dive deep into more details:
a. Increasing Retention
Snowflake Time Travel preserves the data for a more extended period. For instance, if a Table’s Retention Time is increased from 10 to 20 days, the data set to be deleted after ten days will be retained for an additional ten days before being moved to Fail-Safe. However, data over ten days old and already transferred to Fail-Safe mode is unaffected.
b. Decreasing Retention
The duration of data stored in Time Travel is reduced. The shorter Retention Period applies only to active data updated after the Retention Period is shortened. If the data is still within the new Retention Period, it stays in Time Travel; otherwise, it is placed in Fail-Safe Mode. For instance, if a table with a 10-day Retention Period is reduced to 1 day, data from day 2 through day ten will be transferred to Fail-Safe, and only data from day one will be accessible through Time Travel.
Since the background process moves the data from Snowflake Time Travel to Fail-Safe, it may take some time to see the changes. Although Snowflake guarantees that the data will be transferred, it does not specify when the process will be finished. The data remains accessible via Time Travel until the background process is completed.
To change an object's Retention Period, use ALTER object command, such as the following command for modifying a table's Retention Period:
alter table mytable set data_retention_time_in_days=30;
Snowflake Time Travel Data Query
To query previous versions of data in Snowflake Time Travel, you can use the AT | BEFORE Clause after making any DML actions on a table. This clause allows you to query data at or before a certain point in the table's history throughout the retention period. The specified threshold can be either time-based (e.g., a timestamp or time offset from the present) or a statement ID (e.g., SELECT or INSERT).
For example, to select historical data from a table as of a specific date and time, you can use a query like:
sql
SELECT * FROM my table AT (TIMESTAMP => 'Fri, 05 May 2023 16:20:00 -
If you want to pull data from a table that was last updated a certain number of minutes ago, you can use a query like:
sql
SELECT * FROM my_table AT(OFFSET => -60*5);
And to collect historical data from a table up to a specified statement's modifications, but not including them, you can use a query like:
Sql
SELECT * FROM my_table BEFORE(STATEMENT => '8e5d0ca9-005e-44e6-b858-a8f5b37c57
How to Restore Deleted Objects by Utilising the UNDROP Command?
To restore a deleted object that hasn't been permanently removed from the system (meaning it can still be seen in the "SHOW object type> HISTORY" output), you can use the UNDROP command in conjunction with Snowflake Time Travel. This command can be applied to various objects, such as tables, schemas, and databases. It effectively reverts the thing to its previous state before it was deleted with the DROP command. For example, the UNDROP command can also restore a dropped database.
Summing Up
Snowflake Time Travel’s features can enhance your decision-making process and overall data experience. If you're looking for a Snowflake service provider, Beinex is an excellent option. Our partnership with Snowflake enables us to offer advanced features like automated tuning, elastic compute, and analytics modernisation services to help your organisation realise exponential Returns on Investment.

Strengthening Cloud Security: Exploring New Capabilities in AWS Security
AWS Network Firewall Expansion
AWS Network Firewall, a managed firewall service, now expands its availability to four additional AWS Regions. This expansion ensures that organisations worldwide can benefit from the advanced network protection it provides. With AWS Network Firewall, users can effortlessly enforce network security rules and gain granular control over traffic flow. This enhanced capability fortifies the first line of defence, safeguarding against potential threats and attacks.
Enhanced Management with AWS Security Hub and AWS CloudFormation
AWS Security Hub announces a significant improvement in management capabilities by integrating with AWS CloudFormation. This powerful integration simplifies managing security and compliance resources across the AWS infrastructure. Now, organisations can automate the deployment and configuration of security standards using Infrastructure as Code (IaC) principles, ensuring consistent and secure cloud environments across their operations.
AWS Control Tower Integration
The general availability of AWS Control Tower's integration with Security Hub marks a crucial milestone in maintaining control and compliance over AWS accounts. AWS Control Tower streamlines setting up a well-architected and compliant multi-account environment. With Security Hub integration, administrators gain enhanced visibility and control over security findings, enabling enforcement of centralised governance and security best practices.
You can now activate more than 170 Security Hub detective controls, aligning them with corresponding control objectives from AWS Control Tower. Notably, AWS Control Tower can now detect when a control is disabled in Security Hub, indicating a 'Drifted' control state. This new drift detection capability simplifies the monitoring of control deployment status, enabling you to promptly manage the security posture of your AWS Control Tower environment by taking necessary actions.
Amazon Inspector Code Scans for AWS Lambda Function
Ensuring secure serverless applications are now more accessible with the general availability of Code Scans for AWS Lambda functions. Amazon Inspector Console, a robust security assessment service, now offers code-level security assessments for Lambda functions, identifying vulnerabilities and potential security risks. This capability empowers developers to take proactive measures to strengthen the security posture of their serverless applications.
Amazon Verified Permissions
With the introduction of Amazon Verified Permissions, AWS simplifies the permissions management process for cloud resources. Organisations can streamline security audits and compliance checks, saving time and effort. This capability provides an extra layer of confidence, ensuring that only authorised users can access and modify critical resources.
Utilise your current identity provider, responsible for managing users and groups, to effectively manage application permissions and control access. With this integrated authentication and authorisation solution, applications utilising Amazon Cognito now benefit from seamless policy validation based on attributes in Amazon Cognito while also being able to authorise requests using Amazon Cognito tokens.
AWS Security Hub Automation Rules
AWS Security Hub Automation Rules introduce a game-changing capability for proactive incident response. Users can now define automated actions responding to security events, enabling faster and more efficient incident resolution. This empowers organisations to respond swiftly to potential security threats and minimise the impact of security incidents.
AWS Global Partner Security Initiative
Security is a shared responsibility, and AWS takes a collaborative approach to empower its users and partners in fortifying their cloud security. The AWS Global Partner Security Initiative provides valuable insights, resources, and tools to help partners enhance their security offerings and better protect their customers' data. This initiative fosters a more robust security ecosystem and builds trust among AWS users worldwide.
AWS continues to demonstrate its commitment to cloud security with these latest capabilities. As organisations navigate an ever-changing threat landscape, the robustness of AWS security offerings ensures that cloud environments remain fortified and data remains secure. By leveraging these new features and capabilities, users can confidently embrace the cloud's potential without compromising security.
Beinex Offering
Beinex is an AWS consulting partner, and we empower customers to host their BI solutions and much more on the cloud. Our cloud migration experts bring in best-in-class stability and reliability by understanding your business strategy and working closely with you to deploy AWS infrastructure as a service.

Beinex Makes to the League of Top Consulting Firms for Cloud Services in the Middle East 2024
Our Top Cloud Engineering Services Include:
• Cloud Consulting • Cloud Security • Cloud Migration & Modernization and more Feel Free to Schedule a Call: https://beinex.com/cloud-engineering
Read More
Beinex Among Top BI Consulting Firms in the Middle East Beinex Ranked as Top Data Science Consulting Firms in the Middle EastAbout Beinex Cloud Services
By partnering with Beinex, a leading cloud engineering and enablement partner in the Middle East, you can leverage our expertise to optimize your cloud infrastructure, enhance performance, and ensure security and compliance. Our technical prowess allows us to design and implement tailored cloud solutions that align with your business needs, enabling you to maximize the benefits of cloud technology and drive innovation.
Partnering with industry-leading cloud technology providers like Google Cloud Platform, AWS, and Microsoft Azure to build scalable, secure, cost-effective solutions and deliver transformative cloud technology solutions. Beinex has also forged strong partnerships with Snowflake, Tableau, Alteryx, Alation, and Databricks. These collaborations enable us to offer comprehensive solutions that leverage the best-in-class capabilities of these platforms. We can provide our clients with cutting-edge technologies and expert guidance by working closely with our partners.
About Consultancy-me
Consultancy-me.com is a premier platform for those seeking to remain informed about the advisory and consulting industry. The website provides a comprehensive array of the latest news and trends across more than 60 industries and functional areas within the consultancy sector. Consultancy-me.com collaborates globally with over 150 prominent consulting firms and organizations.

AI Adoption in HR: Top Five Benefits Powering the Future Workforce

Amazon CloudFront Case Study: How It Transformed the Customer Experience of Zalando, a Prominent E-commerce Platform
What is Amazon CloudFront?
Amazon CloudFront is a content delivery network offered by Amazon Web Services. It securely transfers content such as software, SDKs, and videos to clients with high transfer speeds. It helps to:
• Increase productivity while maintaining user-friendliness
• Cache your content in edge locations to reduce workload
• Provide high security through the "Content Privacy" feature.
• Utilize HTTPS protocols for fast content delivery.
• Support geo-targeting services for delivering content to specific end users.
The Amazon CloudFront solved the performance and scalability issues, providing Zalando's development teams more insight, flexibility, and control. Eventually, the shift set the stage for long-term innovation and large-scale customer happiness.
Amazon CloudFront Case Study: Challenges Faced by Zalando
In the face of rapid expansion, Zalando sought to maximize its offerings. With more than 49 million active users, Zalando links consumers with brands and goods in 25 European regions. Rich media content is integral to Zalando's website and app to enhance the online customer experience. However, the company's image management, transformation, and delivery system have limited visibility and control for developers. All these factors are crucial for sustaining growth and delivering a unique customer experience.
Zalando migrated its media management and delivery system to Amazon Web Services (AWS) by leveraging Amazon CloudFront, a content delivery network service designed for developer simplicity, security, and high performance. Using CloudFront, Zalando enhanced developer observability, scalability, and online purchasing experiences.
Strengthening Developer Ownership to Promote Development
Due to substantial expansion, Zalando outgrew its prior image management system, which provided its engineering and product teams with few configuration options. Furthermore, few operational insights were available, making it difficult to see how well the service was doing and what improvements could be made. It affected Zalando's capacity to modify and enhance its online stores. Delivering a consistent client experience during high-demand seasonal events was made difficult by the absence of comprehensive reporting regarding image transformation.
To overcome these obstacles and to develop their new media management system, the Zalando team used Amazon CloudFront. Because of its programmability and flexibility, Amazon CloudFront became crucial for scaling operations and keeping up with rising client demand.
Migrating to AWS Edge
Zalando executed its migration quickly and effectively. The company coordinated its migration schedule with AWS's Enterprise Support, Service Specialists, and Service Teams to avoid conflicts with customer campaigns and market events. Small client groups were used in the initial stages of the conversion so that the business could identify any areas for improvement without significantly impacting Zalando customers. During this procedure, Zalando moved more than 20 websites and apps, totaling 26.93 PB of data. CloudFront's peak load has consistently surpassed 100,000 requests per second.
The development team enhanced the image-delivery method using Zalando's prelaunch hands-on access to CloudFront Functions. The team was pleased to receive support on several levels throughout several stages. Regular contact began very early on, while they looked for proofs of concept and sent the code to verify its legitimacy and identify any obstacles.
Zalando started using CloudFront Functions in production in May 2021. Smooth configuration is a significant change with CloudFront Functions. On an operational level and for daily development, it makes it easier to deploy and reliably revert tasks and scale on demand. Zalando swiftly overcame challenges by implementing the new solution across its online domains. Zalando needed to be able to roll back quickly when necessary, making changes before actual downtime could happen. For various use cases, Zalando now employs both Lambda@Edge and CloudFront Functions. Multiple layers of edge computing give developers greater flexibility, visibility, and control while improving the client experience. It enabled Zalando to respond quickly and provide better consumer and business services.
Since the move, Zalando has been attaining cache hit percentages of 99.5 percent, and its new image-delivery system serves almost five billion images daily. They didn't face any challenges with Amazon CloudFront. With about 250 million online orders after the transformation, Zalando's CloudFront solution's size and effectiveness were crucial in providing a first-rate consumer experience.
Additional optimizations made by Zalando have resulted in a threefold decrease in requests for nonoptimized photos on the home screens of the company's online and mobile applications. Because of its improved efficiency and versatility, teams within Zalando have shifted to utilize the pipeline built on CloudFront for additional kinds of material.
Fostering Client Interaction
Using AWS, Zalando intends to keep innovating in managing and manipulating rich media assets. By developing an interactive e-commerce solution with AWS Elemental MediaConvert, a file-based video converting service with broadcast-grade features, it intends to promote consumer interaction. To better serve its clients, Zalando moved to CloudFront to enhance the media management and delivery systems that influence the shopping experience. Zalando could carry out a seamless move with the help of the AWS team, which had significant advantages. The business benefits of using Amazon CloudFront are the operational flexibility and the ability to monitor the health of the solution, experiment, and reverse changes quickly.
Summing Up
Zalando's decision to strategically switch to Amazon CloudFront was a watershed moment in its quest to provide a better, more scalable consumer experience. By tackling important issues with media delivery, performance, and developer control, Zalando increased operational efficiency and enhanced the user experience across all platforms. This success story illustrates how intelligent content delivery systems can enhance long-term value, performance, and customer satisfaction in digital commerce as the company grows and changes.