How AI Decision-Making is Improving Enterprise Outcomes
Blog
Share 
التبحّر بعمق في تابلو 2019.3
مع كل إصدار، يثبت تابلو أنه يأخذ اقتراحات المستخدمين في الاعتبار عند تطوير ميزات جديدة. إذ يحاول تابلو دائمًا الحفاظ على المرونة وراحة البال للعملاء. يأتي أحدث إصدار من تابلو 2019.3 مع ميزات جديدة ومثيرة مثل كتالوج تابلو (Tableau Catalog) وبيانات الشرح (Explain Data) والوظائف الإضافية لخادم تابلو Tableau Server Add-on. لنلقي نظرة أعمق على هذه الميزات الجديدة:
أفضل ميزة لكتالوج تابلوه هي توفير رؤية وإدارة بيانات أفضل في الوقت ذاته، وتضمن أيضًا استخدام البيانات الصحيحة للتحليل. كل هذا أصبح ممكنًا مع الميزة الجديدة (كتالوج تابلو.)
 استخدام آخر لكتالوج تابلو هو التحليل الخطي وتحليل التأثير. هذا التحليل لا يُظهر فقط الأصول التي ستتغير بل أيضًا ما سيتأثر بها، مما يجعل العمل أبسط للكثيرين ويجنبهم إضاعة الوقت.
بيانات الشرح
يأتي تابلو 2019.3 مع ميزة جديدة تعتمد على الذكاء الإصطناعي تسمى “بيانات الشرح” والتي تساعد الأشخاص على الانتقال من ماهية البيانات إلى كيفية البيانات. باستخدام بيانات الشرح، يمكننا الحصول على شرح لكل قيمة غير متوقعة في البيانات بنقرة واحدة فقط. عند اختيار البيانات المطلوبة، يظهر رمز “شرح البيانات” (المصباح).
قد يكون هناك عدد من التفسيرات لكل قيمة. كل من هذه التفسيرات يتم فحصها وتوضيحها بصورة مرئية.
يمكن الآن استخدام هذه التصورات لمزيد من الاستكشافات.
الوظائف الإضافية لإدارة خادم تابلو
ذكرت المؤسسات التي تعتمد على خادم تابلو في المنشورات الهامة على نطاق واسع مخاوفها تجاه قابليةالإدارة وقابلية التوسع. فقد كانوا يبحثون عن الأدوات التي يمكن أن تنظم عملية الإدارة بطريقة فعالة، والتي يمكن أن توفر الكثير من الوقت. قام تابلو بحل هذه المشكلة عن طريق تقديم الوظائف الإضافية لإدارة خادم تابلو، وهي ميزة جديدة مصممة لمساعدة المؤسسات على إدارة المنشورات لخادم تابلو. بهذه الميزة، يمكن للمؤسسات الاستجابة بسرعة لاحتياجات الأعمال المتغيرة، بالإضافة إلى توفير الوقت من خلال تنظيم عملية الإدارة بأكثر الطرق كفاءة. جعلت الوظائف الإضافية لإدارة خادم تابلو تشغيل تابلو في المنشورات الهامة على نطاق واسع أكثر بساطة
استخدام آخر لكتالوج تابلو هو التحليل الخطي وتحليل التأثير. هذا التحليل لا يُظهر فقط الأصول التي ستتغير بل أيضًا ما سيتأثر بها، مما يجعل العمل أبسط للكثيرين ويجنبهم إضاعة الوقت.
بيانات الشرح
يأتي تابلو 2019.3 مع ميزة جديدة تعتمد على الذكاء الإصطناعي تسمى “بيانات الشرح” والتي تساعد الأشخاص على الانتقال من ماهية البيانات إلى كيفية البيانات. باستخدام بيانات الشرح، يمكننا الحصول على شرح لكل قيمة غير متوقعة في البيانات بنقرة واحدة فقط. عند اختيار البيانات المطلوبة، يظهر رمز “شرح البيانات” (المصباح).
قد يكون هناك عدد من التفسيرات لكل قيمة. كل من هذه التفسيرات يتم فحصها وتوضيحها بصورة مرئية.
يمكن الآن استخدام هذه التصورات لمزيد من الاستكشافات.
الوظائف الإضافية لإدارة خادم تابلو
ذكرت المؤسسات التي تعتمد على خادم تابلو في المنشورات الهامة على نطاق واسع مخاوفها تجاه قابليةالإدارة وقابلية التوسع. فقد كانوا يبحثون عن الأدوات التي يمكن أن تنظم عملية الإدارة بطريقة فعالة، والتي يمكن أن توفر الكثير من الوقت. قام تابلو بحل هذه المشكلة عن طريق تقديم الوظائف الإضافية لإدارة خادم تابلو، وهي ميزة جديدة مصممة لمساعدة المؤسسات على إدارة المنشورات لخادم تابلو. بهذه الميزة، يمكن للمؤسسات الاستجابة بسرعة لاحتياجات الأعمال المتغيرة، بالإضافة إلى توفير الوقت من خلال تنظيم عملية الإدارة بأكثر الطرق كفاءة. جعلت الوظائف الإضافية لإدارة خادم تابلو تشغيل تابلو في المنشورات الهامة على نطاق واسع أكثر بساطة
 يمكن أن تساعد ميزة الوظائف الإضافية لإدارة خادم تابلو في تحسين أداء النشر عن طريق تحديد العقد التي تعالج وظائف الخلفية مثل استخراج التحديثات والاشتراكات، وتخصيص تلك العمليات لعقد محددة، مما يسهل توسيع نطاق عمليات النشر لاحتياجات المؤسسة.
تحتوي هذه الميزة على عدد قليل من الأدوات، بما في ذلك اثنتان لتحسين الموثوقية وقابلية التوسع وواحدة لنقل المحتوى، وكلها تساعد المؤسسات على التحكم في بياناتها بشكل فعال. إذا كنت مهتمًا بمعرفة المزيد حول أحدث إصدارات تابلو وحالات الاستخدام، فيرجى الاتصال بنا على training@beinex.com/ info@beinex.com كما يسعدنا تحديد موعد لعرض تابلو أو إجراء تدريب لك ولشركتك. ملاحظة: الوظيفة الإضافية لإدارة الخادم غير متاحة لتابلو أونلاين، حيث يديرون كل شيء من القياس والأداء والأمان نيابة عن عملاء تابلو أونلاين يمكن شراء الوظائف الإضافية لإدارة خادم تابلو بشكل منفصل عن نشر خادم تابلو.
يمكن أن تساعد ميزة الوظائف الإضافية لإدارة خادم تابلو في تحسين أداء النشر عن طريق تحديد العقد التي تعالج وظائف الخلفية مثل استخراج التحديثات والاشتراكات، وتخصيص تلك العمليات لعقد محددة، مما يسهل توسيع نطاق عمليات النشر لاحتياجات المؤسسة.
تحتوي هذه الميزة على عدد قليل من الأدوات، بما في ذلك اثنتان لتحسين الموثوقية وقابلية التوسع وواحدة لنقل المحتوى، وكلها تساعد المؤسسات على التحكم في بياناتها بشكل فعال. إذا كنت مهتمًا بمعرفة المزيد حول أحدث إصدارات تابلو وحالات الاستخدام، فيرجى الاتصال بنا على training@beinex.com/ info@beinex.com كما يسعدنا تحديد موعد لعرض تابلو أو إجراء تدريب لك ولشركتك. ملاحظة: الوظيفة الإضافية لإدارة الخادم غير متاحة لتابلو أونلاين، حيث يديرون كل شيء من القياس والأداء والأمان نيابة عن عملاء تابلو أونلاين يمكن شراء الوظائف الإضافية لإدارة خادم تابلو بشكل منفصل عن نشر خادم تابلو.
استخدام آخر لكتالوج تابلو هو التحليل الخطي وتحليل التأثير. هذا التحليل لا يُظهر فقط الأصول التي ستتغير بل أيضًا ما سيتأثر بها، مما يجعل العمل أبسط للكثيرين ويجنبهم إضاعة الوقت.
بيانات الشرح
يأتي تابلو 2019.3 مع ميزة جديدة تعتمد على الذكاء الإصطناعي تسمى “بيانات الشرح” والتي تساعد الأشخاص على الانتقال من ماهية البيانات إلى كيفية البيانات. باستخدام بيانات الشرح، يمكننا الحصول على شرح لكل قيمة غير متوقعة في البيانات بنقرة واحدة فقط. عند اختيار البيانات المطلوبة، يظهر رمز “شرح البيانات” (المصباح).
قد يكون هناك عدد من التفسيرات لكل قيمة. كل من هذه التفسيرات يتم فحصها وتوضيحها بصورة مرئية.
يمكن الآن استخدام هذه التصورات لمزيد من الاستكشافات.
الوظائف الإضافية لإدارة خادم تابلو
ذكرت المؤسسات التي تعتمد على خادم تابلو في المنشورات الهامة على نطاق واسع مخاوفها تجاه قابليةالإدارة وقابلية التوسع. فقد كانوا يبحثون عن الأدوات التي يمكن أن تنظم عملية الإدارة بطريقة فعالة، والتي يمكن أن توفر الكثير من الوقت. قام تابلو بحل هذه المشكلة عن طريق تقديم الوظائف الإضافية لإدارة خادم تابلو، وهي ميزة جديدة مصممة لمساعدة المؤسسات على إدارة المنشورات لخادم تابلو. بهذه الميزة، يمكن للمؤسسات الاستجابة بسرعة لاحتياجات الأعمال المتغيرة، بالإضافة إلى توفير الوقت من خلال تنظيم عملية الإدارة بأكثر الطرق كفاءة. جعلت الوظائف الإضافية لإدارة خادم تابلو تشغيل تابلو في المنشورات الهامة على نطاق واسع أكثر بساطة
يمكن أن تساعد ميزة الوظائف الإضافية لإدارة خادم تابلو في تحسين أداء النشر عن طريق تحديد العقد التي تعالج وظائف الخلفية مثل استخراج التحديثات والاشتراكات، وتخصيص تلك العمليات لعقد محددة، مما يسهل توسيع نطاق عمليات النشر لاحتياجات المؤسسة.
تحتوي هذه الميزة على عدد قليل من الأدوات، بما في ذلك اثنتان لتحسين الموثوقية وقابلية التوسع وواحدة لنقل المحتوى، وكلها تساعد المؤسسات على التحكم في بياناتها بشكل فعال. إذا كنت مهتمًا بمعرفة المزيد حول أحدث إصدارات تابلو وحالات الاستخدام، فيرجى الاتصال بنا على training@beinex.com/ info@beinex.com كما يسعدنا تحديد موعد لعرض تابلو أو إجراء تدريب لك ولشركتك. ملاحظة: الوظيفة الإضافية لإدارة الخادم غير متاحة لتابلو أونلاين، حيث يديرون كل شيء من القياس والأداء والأمان نيابة عن عملاء تابلو أونلاين يمكن شراء الوظائف الإضافية لإدارة خادم تابلو بشكل منفصل عن نشر خادم تابلو.-
Related Articles

Tableau User Group: One Unique Network and a Force Multiplier
You are into Business Intelligence & Data Visualisation and want to :
- • Learn more about Tableau and its infinite visualization possibilities
- • Get some exposure and want to showcase your work to the world and get some valuable skill-enhancing feedback
- • Network with like-minded peers
Be assured, you are in the right place!
Learn, grow and network: that is what Tableau User Groups are all about. You may be a novice, a beginner, an intermediate or an expert in Tableau. TUG, as they are known in an abbreviated form, provide you with spaces to support connection, growth, and inspiration.
Be a part of an excellent ecosystem of ideas! Get the inspiration you need! Showcase your work, get useful feedback and flourish!
TUG UAE Launch
Now comes the big news: Tableau User Group, UAE launch is around the corner, and we all are quite excited about it!- Date: 14 December 2022; Wednesday
- Venue:The First Collection Business Bay Hotel, Dubai
- Time: 5.00 PM to 8.00 PM GST
- Speakers: Kush Goel and Sanchit Katiyar of Beinex Consulting
- Sponsor: Beinex
Be there, and you will be joined by Kush Goel and Sanchit Katiyar of Beinex Consulting to provide you with more insights to Tableau.
You can secure tons and tons of motivation from your peers across geographies and industries and further your analytics skills. You will have a community cheer you and guide you along the way! All in Dubai!
TUG! The pull of it is incredible.
The Tableau User Group Experience
You need not be an expert to join TUG! This idea comes from a Tableau User Group leader from Oklahoma City.
“A mistake I made early on was thinking I had to be the expert. At the end of the day, it’s about the community and how you can get the community involved and talking. Remember (as a leader) your job is…not to know everything about Tableau,” Amber Smart noted. The purpose of TUG is to share knowledge, engage in networking and give back to the community.
“Here, everything about Tableau is discussed, from basics to advanced. Thus, you get to learn best practices, tips, shortcuts, little tricks that help you save time, ramp up efficiency and a lot of other things,” said Abdelaziz Mahjoub, Lead Consultant, Analytics at Beinex Consulting. He was instrumental in setting up Cairo TUG.
“If there is one aspect that marks TUG, then it is the eagerness with which the participants imbibe knowledge. Everyone was curious to know what they could know more, and all of them were kind enough to share with others what they already knew,” Mahjoub noted.
So, be there and make the TUG, UAE launch a grand success.
Here is the link to the TUG UAE LinkedIn: https://www.linkedin.com/groups/14118611/
DATA MONETIZATION USING SNOWFLAKE
Most of the companies operating today are data-driven as they have started identifying the value of data. The value of data and data marketplaces are evolving with the growth of big data and data requirements of companies.
Understand your Data Offerings - What types of data or data services are you producing that would be valuable to other organizations?
Decide How to Price Data Products - What should be the pricing strategy followed, and how easy would it be to put into action?
Know About Data Sharing Methods - Which distribution channel should be selected for data sharing that adheres to GDPR and data governance policies?
Once you have decided on the data offerings and priced the data products, the key to successfully monetize your data is by sharing the data with the clients/ prospects. The customers and business partners would be eager to get data from you, especially if you can make the process easy and secure. Traditional data sharing technologies often use FTP, Cloud Storage, or API. These methods generally do have few disadvantages.
Data Marketplace
In simple terms, these are online marketplaces where we can buy and sell data of any sort. Data marketplaces offer several kinds of data from a wide range of different data sources. These data include Business Intelligence, demographics, research, and marketing data. Data types are structured and offered to clients by data providers. Providing buyers with more choice of high-quality data generates more engagement and encourages fair pricing between the sellers. Every company has the potential to earn revenue from the information it generates. In a recent study of more than 400 organizations, only 1 in 12 were monetizing their data to its fullest extent. Modern data monetization strategies can help you open brand new revenue streams. There are 3 key steps to monetize your data and drive new revenue streams.- Storage costs for both vendors and buyers
- ETL costs and effort
- Security vulnerabilities
- Service and support costs
- Latency and potential errors leading to poor customer experience
Snowflake & Data Monetization
Snowflake is an analytic data warehouse provided as Software-as-a-Service (SaaS). It provides a data warehouse that is faster, easier to use, and far more flexible than traditional data warehouse offerings. Snowflake allows companies to easily publish a variety of data sets that become immediately available for use or purchase for clients. Snowflake Data Exchange, a modern data sharing method, reduces the time to market and significantly influences customer success. Data Exchange is your own data hub for securely collaborating around data between a selected group of members that you invite. It enables providers to publish data that can then be discovered by consumers. The benefits of Snowflake Data Exchange over Traditional Data sharing Methods are:- Secure Data Sharing
- Exchange data within your organization between different business units. Collaborate with external parties such as vendors, suppliers, partners, and customers.
- Reduce Time to Market
- Break down data silos and reduce time to market.
- Interchange data with third-party vendors to help augment internal datasets.
- Break down data silos by scaling multiple data sets from different sources within your organization.
- Find and consume data on other Data Exchanges to get business insights.
- Speed of Processing
- Snowflake’s multi-cluster shared data architecture is designed to process enormous quantities of data with maximum speed and efficiency.
- All data processing horsepower within Snowflake is performed by one or more clusters of computing resources.
- Data is cached locally within computing resources, along with the caching of query results, to improve the performance of future queries.
- Cost Benefits
- The costs for sharing data with Snowflake are minimal and straightforward.
- Simply pay for the data you store, i.e., you only pay for what you use.
- Reduce extract, transform, load (ETL), and data pipeline maintenance costs.
- Control and Govern Access
- Managing membership
- Granting and revoking access to data through standard and personalized listings
- Auditing data usage
- Applying security controls to your data
Real-life Implementation
A famous telecom organization in Europe was sitting on large silos of data that they could not monetize properly because of the complex architecture of the data warehouse operations and data security challenges involved in the data sharing process. The company has Customer Daily Records (CDR) of its subscribers that contains location data of the users. This data can be used to identify the places people visit and help with building consumer profiles. The gathered data allows advertisers to target messages to specific users while tracking whether they visited a retail store after seeing a mobile ad. This helps them plan personalized marketing strategies and business goals based on demography profiles for targeted users. However, due to the data privacy policies of the European Union like GDPR, organizations were struggling to share data with their potential clients. The GDPR policy makes it mandatory for organizations to ensure that the customer's personal information is not shared with third parties without the customer's consent and involves hefty fines and penalties for the data breach. Even the data sharing process was a source of concern as the data was often shared in text/excel files because of the different database architecture of the clients. With growing data privacy concerns and challenges in creating datasets adhering to the GDPR policies, organizations are strictly asked not to share customer data with third parties. The current system architecture forced the organizations to employ a large number of resources to extract the data from the database system and ensure that customer data is not compromised at any point. The companies were evaluating the possibilities of a potential system that would help them monetize the data they currently hold. The introduction of Snowflake into the organizational architecture solved the data monetization problem and improved the overall data culture in the organization. The unique architecture of Snowflake separates the data storage and computation layer to enhance organizational productivity. The pay as you use policy of the Snowflake and the zero maintenance of infrastructure helped the organization phase out the complex on-premise solutions required to handle the huge data volume. Easy connectivity with the existing solutions used for data analytics practice and on the fly scalability of the computation layer helped the organization increase productivity. It also paves the way for seamless integration to the organization's architecture. The Data Marketplace of Snowflake ensured secure data sharing with third parties adhering to the GDPR policies. The in-built data security policies and features minimize the role of organizations to provide data privacy as well. This enables the organizations to make only those data points visible to end-users that they seemed apt for sharing. It also ensures that the data always resides in the organizational Snowflake database rather than on third-party databases. Moreover, the organizations could reach out to thousands of potential clients through Snowflake Data Marketplace without relying on any intermediatory sources. All this ultimately brings out the scope of using the existing data to drive revenue to the organization and highlights the importance of having a complete environment like Snowflake to capture, preserve, access, and transform data. Authors: Rahul Vijayan, Firdous Maqbool
Snowflake for Optimizing Big Data Workloads
The Snowflake data platform is built for efficiency, scalability, and ease of use. It supports unlimited Virtual Data Warehouse clusters, enabling real-time data sharing for optimal performance. Designed with simplicity, Snowflake requires minimal management or tuning and offers limited performance tuning options. The blog gives you a walkthrough of optimizing big data workloads with Snowflake and making the most of the platform to enhance performance.
Understanding Big Data
Big data is an immensely large and diverse dataset, with structured, semi-structured, and unstructured data that expands exponentially over time. Technological advances like AI, IoT, etc., stimulate the rapid proliferation of big data. Given their increasing volume, velocity, and variety, traditional data systems can't store, process, and analyze big data. In 2021, Gartner used volume, velocity, and variety to define the attributes of big data. Volume: It indicates the high volume of big data gathered from diverse sources continuously. Velocity: It is the speed at which data is collected and needs to be processed and analyzed. Variety: It refers to the diverse nature of data (structured, unstructured, and semi-structured) collected from various sources. In addition, big data can also be defined by the following: Veracity: It is about the accuracy and quality of big data, implying the potential of data to be inconsistent, unreliable, and error-prone. Variability: It indicates the inconsistency and fluctuations in data over time. Value: It is about the relevance and usefulness of the data you collect to add value to your business. However, platforms like Snowflake, AWS, and Google Cloud help businesses manage big data at a rate needed to leverage its power. The application of big data extends to advanced analytics, predictive modeling, and machine learning, enabling businesses to make informed decisions.The Benefits of Big Data
• Facilitates informed and strategic decisions by discovering patterns and insights from analyzing big data. • Helps mitigate risks better and easily with actionable insights from analyzing voluminous data • Boosts customer experiences by deriving useful insights from diverse data, enabling the comprehension, personalization, and optimization of user experience. • Gives businesses a competitive edge and enhances agility by analyzing data in real-time and expediting the further processes with data-driven insights. • Boosts efficiency by employing big data analytical tools that generate faster insights and assist in saving costs and time. • Integrates automated, real-time data streaming with advanced data analytics to continuously gather data, discover new insights and growth opportunities.Optimizing Big Data Workloads with Snowflake
Snowflake, a cloud-based data warehousing platform, offers scalable and flexible solutions for big data workloads. Here are some of the ways in which Snowflake optimizes performance when managing big data workloads. Warehouse Scaling: By configuring several warehouses based on file size and employing auto-scale capabilities, Snowflake can help stop timeouts and boost processing speed. Snowflake provides flexible scaling options (scale up and scale out) to fit your escalating data requirements. Scaling up refers to expanding the warehouse size to manage more workloads and is ideal for data workloads needing more resources. Scaling out is about adding more warehouses to enhance capacity by distributing workloads, and it is better suited to handle multiple workloads simultaneously. Snowflake also offers a warehouse of various sizes, organized into T-shirt sizes (X-Small, Small, Medium, Large, X-Large, 2X-Large, 3X-Large, 4X-Large, 5X-Large, and 6X-Large). The range of sizes makes choosing the right warehouse for your needs seamless and allows you to scale up or down as required. Besides, Snowflake's architecture enables you to decouple storage and compute resources, that is, scale your compute and storage independently while lowering costs and optimizing performance and resource utilization. Storage Optimization: The columnar storage engine of Snowflake helps optimize storage by reducing storage costs and enhancing query performance. Besides, leveraging Snowflake's automatic compression lowers storage costs and improves data transfer times. Micro-partitions are also important, allowing for efficient storage and querying of large datasets. The storage optimization faculty of Snowflake offers a powerful and flexible foundation for efficiently managing diverse data, including structured data, semi-structured data, and unstructured. It also ensures your data is accessible and never becomes a bottleneck. Snowflake has redundant data storage; it stores multiple data copies across various servers and locations, ensuring multiple workloads can run concurrently without resource contention, and your data is always available. Query Optimization: Snowflake's query acceleration features, like query result caching and materialized views, can be harnessed to boost query performance greatly. Materialized views store data physically and precompute complex queries, boosting performance. What makes it different from the traditional views is that it offers the capability to precompute data based on materialized view queries, expediting and streamlining access to complicated data. The automation and the routine refresh capabilities ensure the data is updated, eliminating the need for manual intervention. Snowflake's materialized views offer granular control over data management and scalability, simplifying the process and enhancing flexibility compared to the traditional materialized views. Also, queries can be optimized by utilizing efficient query patterns and specifying only the columns required. Techniques like Common Table Expressions help optimize joins and subqueries. Query performance can also be optimized by filtering data early, lowering operation counts, preventing unnecessary sorts, and using window functions. Data Loading Optimization: Snowflake's bulk loading capabilities, like Snowpipe and COPY INTO, enable the efficient loading of extensive datasets, optimizing data loading. Snowflake Functions and Snowflake Tasks, the transformation and processing faculties of Snowflake, run data processing and transformation during loading. Snowpipe offers scalable and serverless architecture and facilitates real-time data ingestion, processing, and integration with platforms like Kafka. With Snowpipe, you can stream data into Snowflake in real time, enabling immediate analysis and decision-making. Dynamic Tables and Streams: Dynamic Tables and Streams in Snowflake facilitate real-time data processing and analysis. Dynamic Tables make storing and managing structured and semi-structured data flexible and scalable. Streams enable real-time data ingestion and processing. By incorporating these features, Snowflake allows users to capture, process, and analyze changing data effortlessly, assisting in real-time analytics, IoT data processing, and machine learning. Resource Optimization: Right-sizing your warehouse optimizes resources by preventing over-provisioning or under-provisioning resources, ensuring the resources are sized right for the data workload. Snowflake's auto-suspend and auto-scaling features adjust warehouse size automatically based on the demand. Monitoring and optimizing resource usage by tracking resource utilization and optimizing data workload results in enhanced performance and cost efficiency. Search Optimization in Snowflake: Snowflake Search Optimization is a robust query optimization service that helps boost the performance of specific lookup and analytical queries that retrieve small subsets of data from large datasets. When enabled on a table, the search optimization service generates a Search Access Path, an additional dataset that tracks the micro-partitions where table values are stored. This mechanism significantly enhances query efficiency by minimizing the number of partitions scanned during table operations, eliminating the need to search through all partitions. Data Partitioning: To access relevant data quickly and decrease the volume of data analyzed during queries, data can be segmented based on specific criteria or keys. Managing big data workloads and large datasets in Snowflake comes with a few challenges, such as issues in query performance and data loading delays. However, effective strategies like employing Snowpipe for efficient data loading, advanced SQL techniques, and warehouse configuration for improved query performance help overcome the challenges. The advantages of using Snowflake for big data workloads include: • Seamless scaling to manage voluminous data • Attaining faster query performance and real-time insights • Streamlining data management and lowering administrative burdens • Facilitating data democratization and self-service analyticssea • Foster business growth and competitive edge through data-driven decisions. By leveraging Snowflake, businesses can optimize their big data workloads and achieve greater scalability, performance, and cost-efficiency.
Beinex Achieves Snowflake Select Tier Partner Status

Benefits: Enhanced Data Cloud Capabilities
The partnership will let Beinex turbocharge services on the AI-ML, analytics fronts by utilising storage and compute scalability unlocked by the unique collaboration. It awards Beinex and its clients the capability to flourish in terms of cost leadership, domain leadership and added utilisation of potential in sync with market conditions.
Data marketplace enhancement
The partnership also means that acquiring and testing third-party data is now easier which also entails the Snowflake users to imbibe the expanded third-party data into their environment, attach it to their first-party data and evaluate the data efficacy vis-à-vis customer experience along with the impact it can create.
There is little doubt that the capability is very much in demand as Beinex clients are into delivering powerful customer/ user experience as a part of their service efforts
Features:
- Privacy-safe
- Secure sharing platform
- No need to set up extra secure portals to support sharing of Personally Identifiable Information
The power of partnership
Beinex partnership with Snowflake enables it to offer clients advanced features like automated tuning and elastic compute with unlimited decoupled computing capability, along with the analytics modernization services, to help organisations realise exponential Return on Investment. This upgrade in status will take business to the next level for both Beinex and its esteemed client line-up.
Partnerships are what make Beinex stronger. The company has strong partnerships with some of the leading technology firms, research labs, and universities around the globe.
Businesses can leverage the power of our partner ecosystem to maximize the value of their end-to-end analytics journey.
Beinex is ecstatic to receive this recognition as a Snowflake select services tier partner and is grateful to Snowflake for acknowledging its client services.
Cohort Retention Analysis in Tableau
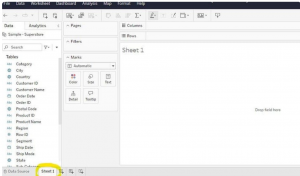
To start, access the Superstore Dataset, available for download on Kaggle. Use Tableau Public to connect to this dataset and explore the rows and columns to understand the documented data related to the Superstore. This exploration sets the stage for the subsequent cohort retention analysis.
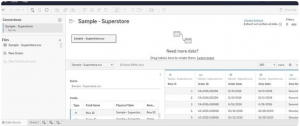 Move over to the Sheet 1 tab; this will serve as your dedicated workspace where you'll craft your visualizations. This area will be your canvas to build and design the subsequent analyses and visual representations.
To perform cohort analysis effectively, specific data points are necessary:
Unique Identifier: Utilize the Customer ID as the unique identifier for each customer.
First Purchase Date: This marks the date when a customer made their initial purchase, a pivotal point for creating cohort groups.
Revenue Data: Information regarding the financial aspect of each transaction.
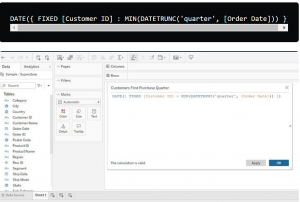
Creating Calculated Fields
One crucial calculated field needed is the "Customers’ First Purchase Date (quarter)." Since the dataset doesn't contain the first purchase date field, a calculated field is essential. This field is derived from computations based on existing data in the dataset, enabling the identification of when each customer made their initial purchase. Calculated fields are instrumental in manipulating and analyzing data by performing calculations based on existing dataset information.

To create quarter and year cohorts based on the customers' first purchase date:
Defining Cohorts: In this dataset spanning four years (2014–2017), cohorts will be based on the quarter and year when customers made their initial purchase. This approach ensures a manageable cohort table for analysis.Calculation for Quarter Identification: The calculation to establish the quarter in which a customer made their first purchase involves determining the quarter and year from the purchase date.
This calculation utilizes the 'DATETRUNC' function to extract the quarter from the 'First Purchase Date' field, aligning customers based on the quarter they made their initial purchase.
Flexibility in Cohort Creation: While quarters and years are chosen for cohort segmentation in this scenario, other time parameters like days, weeks, or months could also be used for cohort creation, depending on the dataset and analytical objectives. However, for this particular dataset, quarters and years were deemed more practical for effective analysis.
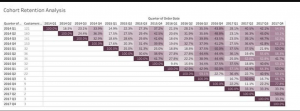
Assembling the cohort retention table involves using the calculated fields previously created to form a comprehensive table that illustrates cohort-based metrics, particularly the number of unique customers per first quarter and the retention rate.
Here's how to assemble the cohort table:

This formula divides the count of unique customers by the total number of customers from the first quarter, providing the retention rate for each subsequent period.
This table allows for a clear visualization of how customer retention varies across different cohorts over subsequent periods, providing insights into the effectiveness of retaining customers acquired in specific quarters.
This step-by-step guide is incredibly detailed for constructing the cohort table in Tableau. It breaks down the process systematically, ensuring proper visualization of the cohort analysis.
Interpreting the retention rates from this table involves examining both the rows and columns:
Rows (First and Second Columns): Here, you'll find different year and quarter groups representing cohorts, along with the count of customers who made their first purchase in each respective period.Columns (Third Column): As you move across the table, you'll encounter the percentages indicating how many customers continued making purchases at the Superstore across subsequent quarters after their initial purchase.
For instance, if 160 customers made their first purchase in 2014 Q2, you'd observe that 24.4% returned to make purchases in 2014 Q3, and 36.3% made purchases in 2014 Q4. This trend continues across the subsequent periods.
 In conclusion, creating calculated fields is an essential part of conducting cohort analysis in Tableau. It involves utilizing functions effectively. If you're new to Tableau functions, exploring articles or resources on Tableau functions could fill any knowledge gaps and provide a deeper understanding of their usage in data analysis and visualization. The provided Tableau article on functions might be particularly helpful for a more comprehensive understanding.