How AI Decision-Making is Improving Enterprise Outcomes
Blog
Share 
A DEEP DIVE INTO TABLEAU 2019.3
TABLEAU CATALOG
What could be better than a feature that could provide better visibility and better data management at the same time, and also ensure that the right data is always used for analysis. This is possible with the new feature -Tableau Catalog.
 This feature provides a complete picture of the data and how each data is connected.
Another use of Tableau Catalog is linear and impact analysis. This not only shows which assets will change but also who will be affected by it, which makes work easier for many and avoids wastage of time.
EXPLAIN DATA
Tableau 2019.3 is up with a new Al-driven feature called the “Explain Data”, which helps people go from the “what” of the data to the “how” of it. With explain data, we can get an explanation for each unexpected value in the data by just a single click. On selecting the desired data point, the ‘explain data’(lightbulb) icon appears.
For each value there might be a number of explanations. Each of these explanations are checked and only the most likely ones are provided as visualizations.
This feature provides a complete picture of the data and how each data is connected.
Another use of Tableau Catalog is linear and impact analysis. This not only shows which assets will change but also who will be affected by it, which makes work easier for many and avoids wastage of time.
EXPLAIN DATA
Tableau 2019.3 is up with a new Al-driven feature called the “Explain Data”, which helps people go from the “what” of the data to the “how” of it. With explain data, we can get an explanation for each unexpected value in the data by just a single click. On selecting the desired data point, the ‘explain data’(lightbulb) icon appears.
For each value there might be a number of explanations. Each of these explanations are checked and only the most likely ones are provided as visualizations.
 Now these visualizations can be used for further explorations.
TABLEAU SERVER MANAGEMENT ADD-ON
Organizations that run critical deployment of Tableau Server at a large scale, have mentioned concerns over manageability and scalability. They have been in search for tools that could organize the management process in an efficient way, which could save a lot of time. Tableau solved this problem by introducing the Tableau Server Management Add-on – a new feature designed to help organizations manage the deployment of Tableau Server. With this, they can quickly react to the changing needs of the business as well as save time by organizing the management process in the most efficient way. Tableau Server Management Add-on, which makes running the critical deployment of tableau at a large-scale server much simpler.
Now these visualizations can be used for further explorations.
TABLEAU SERVER MANAGEMENT ADD-ON
Organizations that run critical deployment of Tableau Server at a large scale, have mentioned concerns over manageability and scalability. They have been in search for tools that could organize the management process in an efficient way, which could save a lot of time. Tableau solved this problem by introducing the Tableau Server Management Add-on – a new feature designed to help organizations manage the deployment of Tableau Server. With this, they can quickly react to the changing needs of the business as well as save time by organizing the management process in the most efficient way. Tableau Server Management Add-on, which makes running the critical deployment of tableau at a large-scale server much simpler.
 The server management add-on feature can help in optimising the performance of deployment by customizing which nodes process background jobs such as extract refreshes and subscriptions and isolating these workloads, to specific nodes. This makes it easier to scale deployments to the needs of their organization.
This feature has a few tools, including two for better reliability and scalability and one for content migration, all of which helps the organizations to govern their data effectively.
If you are interested in learning more about the latest Tableau release and use cases, please contact us at training@beinex.com/ info@beinex.com and we would be happy to schedule a Tableau demo or training for you and your company.
The server management add-on feature can help in optimising the performance of deployment by customizing which nodes process background jobs such as extract refreshes and subscriptions and isolating these workloads, to specific nodes. This makes it easier to scale deployments to the needs of their organization.
This feature has a few tools, including two for better reliability and scalability and one for content migration, all of which helps the organizations to govern their data effectively.
If you are interested in learning more about the latest Tableau release and use cases, please contact us at training@beinex.com/ info@beinex.com and we would be happy to schedule a Tableau demo or training for you and your company.
This feature provides a complete picture of the data and how each data is connected.
Another use of Tableau Catalog is linear and impact analysis. This not only shows which assets will change but also who will be affected by it, which makes work easier for many and avoids wastage of time.
EXPLAIN DATA
Tableau 2019.3 is up with a new Al-driven feature called the “Explain Data”, which helps people go from the “what” of the data to the “how” of it. With explain data, we can get an explanation for each unexpected value in the data by just a single click. On selecting the desired data point, the ‘explain data’(lightbulb) icon appears.
For each value there might be a number of explanations. Each of these explanations are checked and only the most likely ones are provided as visualizations.
Now these visualizations can be used for further explorations.
TABLEAU SERVER MANAGEMENT ADD-ON
Organizations that run critical deployment of Tableau Server at a large scale, have mentioned concerns over manageability and scalability. They have been in search for tools that could organize the management process in an efficient way, which could save a lot of time. Tableau solved this problem by introducing the Tableau Server Management Add-on – a new feature designed to help organizations manage the deployment of Tableau Server. With this, they can quickly react to the changing needs of the business as well as save time by organizing the management process in the most efficient way. Tableau Server Management Add-on, which makes running the critical deployment of tableau at a large-scale server much simpler.
The server management add-on feature can help in optimising the performance of deployment by customizing which nodes process background jobs such as extract refreshes and subscriptions and isolating these workloads, to specific nodes. This makes it easier to scale deployments to the needs of their organization.
This feature has a few tools, including two for better reliability and scalability and one for content migration, all of which helps the organizations to govern their data effectively.
If you are interested in learning more about the latest Tableau release and use cases, please contact us at training@beinex.com/ info@beinex.com and we would be happy to schedule a Tableau demo or training for you and your company.
Note: The Server Management Add-on is not available for Tableau Online, as they manage everything from scaling, performance, and security on behalf of their Tableau Online customers. The Tableau Server Management Add-on can be separately purchased from the Tableau Server deployment.
With every release, Tableau proves that it takes user suggestions into account when developing new features. Tableau has always tried to keep customers convenience and flexibility as their matters of concern. Tableau’s latest version 2019.3 has been included with exciting new features like Tableau Catalog, Explain Data and Tableau Server Management Add-on. Let us have a look at what these new features are:
Related Articles

Just Go Wild: Beinex Offsite Visit to Munnar
We all boarded after breakfast from Edapally into the buses waiting as planned. Our journey to Munnar resembled the long-lost college trips, filled with songs, dances and ‘Antaksharis’. Finally, we reached our destination passing vast expanses of tea estates and dewy mountains.
Munnar is an exotic place with a breath-taking landscape and scenic spots. The chilly hill station stole our minds with its exotic flora and fauna. Our team stayed in a luxury resort: Mountain Club. The cottages chosen for us resembled the colonial architecture from the bygone era. The bedrooms were cosy, with a balcony open to the rustic surroundings.
The lunch was a luxurious affair that included starters to desserts. We used the mealtime to get to know more about each other. Then, we all attended the motivation speech by Sibu Varghese which was quite insightful, followed by an interactive session. Then, we interacted with and introduced each other. Personal interaction creates tight bonds and has an integral role in team building. We all broke the ice by sharing our stories and telling jokes. It was fun to get to know each other.
 In the evening, we had a wild-theme based gala party, and all got dressed up in sync with the theme, ‘Just Go Wild’. It was fun to watch everyone from the Manager to the employees dressed up in the same theme. We had an exhilarating DJ party manned by Darryl Gaulbert which made us all shake a leg to the tune. We danced and roared to the music. It was indeed wild!
The following day after breakfast, we met our founder Indumon Das, who had a chat with us regarding the journey of Beinex and his vision. It inspired us all to have a dream and pursue it fearlessly. Some of us accessed the infinity pool late afternoon and had great fun swimming and playing pool ball.
It was a blissful evening based on an ethnic wear theme. We competed for the best ethnic outfit of the evening. The different hues and styles made the evening stunning. Everyone flaunted the traditional wear in style. We had a musical evening with a live barbeque and a sumptuous dinner.
Finally, the day of leaving Munnar dawned; March 19. We all had breakfast in the morning and packed our backpacks. Most of us were pretty reluctant to leave Munnar as we were not ready to lose the bond we created together. Nonetheless, we vowed to stay connected. We boarded the buses around 10 AM and waved goodbye to Munnar.
When we reached Edapally in the evening, a surprise goody bag was waiting. It was an impressive and admirable gesture from our firm. Beinex has a culture of nurturing growth and spreading positivity, and employees’ comfort is the priority here.
In the evening, we had a wild-theme based gala party, and all got dressed up in sync with the theme, ‘Just Go Wild’. It was fun to watch everyone from the Manager to the employees dressed up in the same theme. We had an exhilarating DJ party manned by Darryl Gaulbert which made us all shake a leg to the tune. We danced and roared to the music. It was indeed wild!
The following day after breakfast, we met our founder Indumon Das, who had a chat with us regarding the journey of Beinex and his vision. It inspired us all to have a dream and pursue it fearlessly. Some of us accessed the infinity pool late afternoon and had great fun swimming and playing pool ball.
It was a blissful evening based on an ethnic wear theme. We competed for the best ethnic outfit of the evening. The different hues and styles made the evening stunning. Everyone flaunted the traditional wear in style. We had a musical evening with a live barbeque and a sumptuous dinner.
Finally, the day of leaving Munnar dawned; March 19. We all had breakfast in the morning and packed our backpacks. Most of us were pretty reluctant to leave Munnar as we were not ready to lose the bond we created together. Nonetheless, we vowed to stay connected. We boarded the buses around 10 AM and waved goodbye to Munnar.
When we reached Edapally in the evening, a surprise goody bag was waiting. It was an impressive and admirable gesture from our firm. Beinex has a culture of nurturing growth and spreading positivity, and employees’ comfort is the priority here.
 Yes, we had a fantastic time together. After this retreat, our rejuvenated and motivated minds are ready to bounce back to work with enhanced spirit. We are looking forward to more team building sessions in the future to meet each other more often.
In the evening, we had a wild-theme based gala party, and all got dressed up in sync with the theme, ‘Just Go Wild’. It was fun to watch everyone from the Manager to the employees dressed up in the same theme. We had an exhilarating DJ party manned by Darryl Gaulbert which made us all shake a leg to the tune. We danced and roared to the music. It was indeed wild!
The following day after breakfast, we met our founder Indumon Das, who had a chat with us regarding the journey of Beinex and his vision. It inspired us all to have a dream and pursue it fearlessly. Some of us accessed the infinity pool late afternoon and had great fun swimming and playing pool ball.
It was a blissful evening based on an ethnic wear theme. We competed for the best ethnic outfit of the evening. The different hues and styles made the evening stunning. Everyone flaunted the traditional wear in style. We had a musical evening with a live barbeque and a sumptuous dinner.
Finally, the day of leaving Munnar dawned; March 19. We all had breakfast in the morning and packed our backpacks. Most of us were pretty reluctant to leave Munnar as we were not ready to lose the bond we created together. Nonetheless, we vowed to stay connected. We boarded the buses around 10 AM and waved goodbye to Munnar.
When we reached Edapally in the evening, a surprise goody bag was waiting. It was an impressive and admirable gesture from our firm. Beinex has a culture of nurturing growth and spreading positivity, and employees’ comfort is the priority here.
Yes, we had a fantastic time together. After this retreat, our rejuvenated and motivated minds are ready to bounce back to work with enhanced spirit. We are looking forward to more team building sessions in the future to meet each other more often.
Top 4 Ways on How Marketing Leaders Use Alteryx AI & Analytics Automation for Business Success
Four Ways Alteryx Automation and AI Can Transform Your Marketing Strategy:
While there are numerous objectives marketing teams can achieve with data analytics, this blog highlights four ways Alteryx automation and AI can transform your marketing strategy:
1. Centralize Your Data
As the marketing landscape prepares for a cookie-less future, having a unified view of your data is essential. Staying ahead of customer needs, competition, and campaigns requires gathering all your data in one place.
With analytics automation, you can easily integrate data from various sources—whether cloud or on-premises, first-party data, or marketing applications like web analytics and CRMs—to gain a comprehensive view of your customers. This enables marketing teams to react to market shifts in real time.
Use case:
For example, a multinational retailer leveraged analytics automation to bring together data from all customer interactions, resulting in a 37x improvement in processing efficiency. This allowed them to better understand customer behavior across multiple channels.Unlike traditional spreadsheets, which have limitations on data capacity, analytics automation platforms offer limitless capabilities, allowing you to manage vast amounts of customer and product data in one place.
How Alteryx Helps:
• Drag-and-Drop Data Integration: Simplify complex data workflows with easy-to-use, drag-and-drop tools that eliminate manual coding and reduce time to insight.
• Automated Data Cleaning: Utilize pre-built data preparation tools to clean, standardize, and transform data in just a few clicks, ensuring high-quality data for analysis.
• Cluster Analysis: Automatically group similar data points (e.g., customer segments) using clustering tools, enabling precise targeting and personalization without manual intervention.
2. Enhance Your Marketing Campaigns
Marketing success depends on speed and agility, especially when it comes to predicting market trends and competitor behavior. Optimizing targeting, pricing, or strategy without the right insights becomes a challenge. Analytics automation helps you find the right combination of offers and tactics to increase conversions and boost revenue.
Use Case:
A retail chain with 500+ stores struggled to predict customer buying patterns and optimize promotions. By implementing analytics automation, they processed customer data in real time, enabling hyper-personalized marketing campaigns that boosted conversion rates by 35%.
They also used machine learning to predict demand and optimize inventory, preventing stockouts during key promotions. Additionally, they automated pricing analysis, reducing adjustment times from weeks to hours. By integrating spatial analytics, they could identify high-performing stores and strategically allocate resources, further enhancing their marketing and sales efforts. They also automated pricing analysis based on regional market dynamics, reducing adjustment times from weeks to hours and ensuring competitive pricing across all locations.
How Alteryx Helps:
• Predictive Modeling: Leverage machine learning models to forecast demand, optimize pricing strategies, and predict customer churn, allowing for proactive campaign adjustments. • Market Basket Analysis: Identify products that are frequently purchased together to optimize cross-selling and upselling opportunities, increasing revenue per customer. • Real-Time Analytics: Process large volumes of data in real-time to quickly adjust marketing strategies and promotional offers based on current performance metrics. • Spatial Analytics: By analyzing geographic data, marketing teams can optimize store placements, allocate resources more effectively, and improve overall sales performance.
3. Maximize Your Talent and Resources
Many marketing teams struggle to turn data into valuable business insights. According to Gartner, only 53% of marketing decisions are informed by data analytics. Limited staff and time often prevent teams from fully utilizing their data potential.
Analytics automation bridges this gap by enabling teams to achieve more with fewer resources. It automates the time-consuming tasks of data cleaning and preparation, allowing marketing teams to save significant hours and focus on more strategic projects.
Use Case:
For example, a leading digital advertising agency transitioned from using spreadsheets for social media analysis to implementing analytics automation. This resulted in a 99.5% faster analysis, saving 180 weekly analyst hours. By automating routine tasks, your team can dedicate more time to high-impact initiatives, ultimately enhancing overall business value.How Alteryx Helps:
• Self-Service Analytics: Empower non-technical users to perform complex data analyses without relying on IT or data science teams, accelerating time to insight. • Workflow Automation: Automate repetitive tasks like data cleansing, transformation, and reporting, significantly reducing manual effort and minimizing the risk of errors. • Scalable Solutions: Handle vast amounts of data effortlessly, allowing your team to focus on high-impact projects without being bogged down by data management issues.4. Achieve Immediate Results While Preparing for the Future
Marketing leaders often juggle the challenge of balancing short-term returns with long-term strategic goals. Analytics automation solutions can provide quick wins while also laying a foundation for future success.
By choosing a solution that is user-friendly and easy to implement, you can skip lengthy training sessions and start seeing results quickly. Moreover, the best analytics tools are designed with the future in mind, offering integration with cloud services and AI-driven insights.
Use Case:
For example, a premier company specializing in technology services, utilized analytics automation to analyze 250 broadcast campaigns, resulting in an 88% time savings and a 25% increase in time spent on advanced analytics. The right automation tools not only generate fast results but also ensure you're ready for future growth.How Alteryx Helps:
• Quick Implementation: Start generating insights rapidly with intuitive tools that require minimal training. Alteryx’s user-friendly interface means your team can hit the ground running without lengthy onboarding sessions. • Future-Ready Integration: Alteryx seamlessly integrates with cloud services, AI platforms, and advanced analytics tools, ensuring your marketing strategy evolves alongside technological advancements. • Comprehensive Analytics Suite: From spatial analysis to text mining, Alteryx provides a wide range of analytical tools that help you address complex business questions and prepare for emerging trends.
How Marketing Teams Can Benefit from Alteryx
With Alteryx, marketing teams can benefit from:
• Self-Service Analytics: A user-friendly, drag-and-drop interface, you can easily access and analyze data without technical expertise.
• Pre-Built Analytical Tools: Utilize pre-configured tools for market basket analysis, spatial analytics, and more without needing custom development.
• Seamless Integration: Integrate Alteryx with your existing marketing tech stack for a cohesive, end-to-end analytics solution.
Alteryx+ Beinex Offerings
Our Premier partnership with Alteryx empowers business users to automate manual data cleansing and transformation tasks in minutes through a simple visual workflow while incorporating the latest technological advancements.
Connect with us for a free demo: https://beinex.com/alteryx-partner/

Building a Sustainable Future for Your Business A Roadmap for Business Success in the 21st Century
What is ESG?
ESG stands for Environmental, Social, and Governance. It encompasses a company's commitment to operating in a way that considers its impact on the environment, society, and its own governance structure. • Environmental: This pillar focuses on a company's environmental impact, including its carbon emissions, resource consumption, and pollution prevention efforts. Key aspects include climate change mitigation, water conservation, waste reduction, and the transition to renewable energy sources. • Social: This pillar addresses a company's impact on society, encompassing human rights, labor practices, community engagement, and customer health and safety. It includes ensuring fair wages, safe working conditions, respecting human rights throughout the supply chain, and contributing positively to the communities in which the company operates. • Governance: This pillar focuses on a company's leadership, ethics, and transparency. Key aspects include board diversity, executive compensation, anti-corruption measures, and effective risk management.Why is ESG Relevant Today?
The relevance of ESG stems from a confluence of factors. Firstly, investors are increasingly prioritizing ESG factors in their investment decisions. Recognizing the long-term financial risks associated with environmental and social issues, investors are seeking companies that demonstrate strong ESG performance. Secondly, consumers are becoming increasingly aware of sustainability and ethical business practices. They are more likely to support companies that align with their values and prioritize environmental and social responsibility. Furthermore, regulatory scrutiny surrounding ESG issues is intensifying. Governments worldwide are implementing stricter environmental regulations and increasing pressure on companies to disclose ESG information. Finally, strong ESG performance enhances a company's reputation and attracts top talent. By demonstrating a commitment to sustainability and social responsibility, companies can build trust with stakeholders, improve their brand image, and differentiate themselves in the competitive marketplace.The Impact of ESG on Businesses
Integrating ESG principles into business operations can yield significant benefits: 1. Enhanced Financial Performance: • Improved Risk Management: By proactively identifying and mitigating environmental and social risks, companies can enhance their financial stability and reduce their exposure to potential losses. • Increased Access to Capital: Investors are increasingly allocating capital to ESG-aligned investments. This can lead to improved access to capital and potentially lower borrowing costs for companies with strong ESG performance. • Improved Operational Efficiency: Implementing sustainable practices, such as energy efficiency measures and waste reduction initiatives, can lead to cost savings and improved operational efficiency. 2. Enhanced Reputation and Brand Value: • Attracting and Retaining Customers: Consumers are increasingly choosing to support companies with strong ESG credentials. By demonstrating a commitment to sustainability and social responsibility, companies can attract and retain loyal customers. • Attracting and Retaining Talent: Top talent, particularly younger generations, are increasingly seeking employment with companies that prioritize ESG. Strong ESG performance can help attract and retain the most talented employees. 3. Driving Innovation: • Developing Sustainable Solutions: Integrating ESG considerations can drive innovation and the development of new products and services that address environmental and social challenges. This can lead to new revenue streams and competitive advantages. • Companies can further amplify their ESG initiatives by aligning themselves with external sustainability movements. For example, joining the Trillion Trees (1t.org) initiative demonstrates a commitment to large-scale environmental restoration efforts, specifically by contributing to the ambitious goal of conserving, restoring, and growing one trillion trees globally. By participating in this initiative, companies not only contribute to vital environmental restoration efforts but also gain valuable recognition for their commitment to climate action and biodiversity conservation. Similarly, aligning with Pledge 1% (pledge1percent.org) signifies a dedication to philanthropy and social responsibility. This initiative encourages companies to contribute 1% of their equity, employee time, product, or profit to charitable causes. By joining Pledge 1%, companies can actively support non-profit organizations working on critical social issues, such as poverty reduction, education, and healthcare. This demonstrates a commitment to making a positive social impact beyond their core business operations and fosters a strong sense of corporate social responsibility within the company. At Beinex, we are deeply committed to ESG principles and strive to integrate sustainability into all aspects of our business. We believe that strong ESG practices are not only essential for environmental and social responsibility but also crucial for long-term business success. We are actively exploring opportunities to align with external sustainability initiatives such as the Trillion Trees initiative and Pledge 1%. These partnerships will further solidify our commitment to environmental restoration and social impact, allowing us to contribute meaningfully to a more sustainable and equitable future. These external partnerships not only enhance a company's ESG profile but also provide valuable opportunities for collaboration, knowledge sharing, and collective impact. By joining forces with other like-minded organizations and individuals, companies can leverage their resources and expertise to address pressing global challenges and create a more sustainable and equitable future.Making a Net Positive Impact
To effectively integrate ESG into their business strategy, companies must set clear, measurable ESG targets, integrate ESG considerations into all aspects of their operations, and regularly track and report on their progress. Engaging with stakeholders, including customers, suppliers, employees, and investors, is crucial for understanding their expectations and incorporating their feedback into ESG initiatives. Going beyond mere compliance with regulations, businesses can strive to make a net positive impact on society and the environment. • Collaborative Partnerships: Collaborating with other businesses, NGOs, and government agencies to address systemic challenges and drive collective action on sustainability. • Leading by Example: Serving as a role model for other companies in the industry by demonstrating best practices in sustainability and social responsibility. • Investing in Innovation: Investing in research and development of innovative technologies and solutions that address environmental and social challenges.
Beinex Makes to the League of Top Consulting Firms for Cloud Services in the Middle East 2024
Our Top Cloud Engineering Services Include:
• Cloud Consulting • Cloud Security • Cloud Migration & Modernization and more Feel Free to Schedule a Call: https://beinex.com/cloud-engineering
Read More
Beinex Among Top BI Consulting Firms in the Middle East Beinex Ranked as Top Data Science Consulting Firms in the Middle EastAbout Beinex Cloud Services
By partnering with Beinex, a leading cloud engineering and enablement partner in the Middle East, you can leverage our expertise to optimize your cloud infrastructure, enhance performance, and ensure security and compliance. Our technical prowess allows us to design and implement tailored cloud solutions that align with your business needs, enabling you to maximize the benefits of cloud technology and drive innovation.
Partnering with industry-leading cloud technology providers like Google Cloud Platform, AWS, and Microsoft Azure to build scalable, secure, cost-effective solutions and deliver transformative cloud technology solutions. Beinex has also forged strong partnerships with Snowflake, Tableau, Alteryx, Alation, and Databricks. These collaborations enable us to offer comprehensive solutions that leverage the best-in-class capabilities of these platforms. We can provide our clients with cutting-edge technologies and expert guidance by working closely with our partners.
About Consultancy-me
Consultancy-me.com is a premier platform for those seeking to remain informed about the advisory and consulting industry. The website provides a comprehensive array of the latest news and trends across more than 60 industries and functional areas within the consultancy sector. Consultancy-me.com collaborates globally with over 150 prominent consulting firms and organizations.

Snowflake and GenAI: Revolutionizing Data Analytics
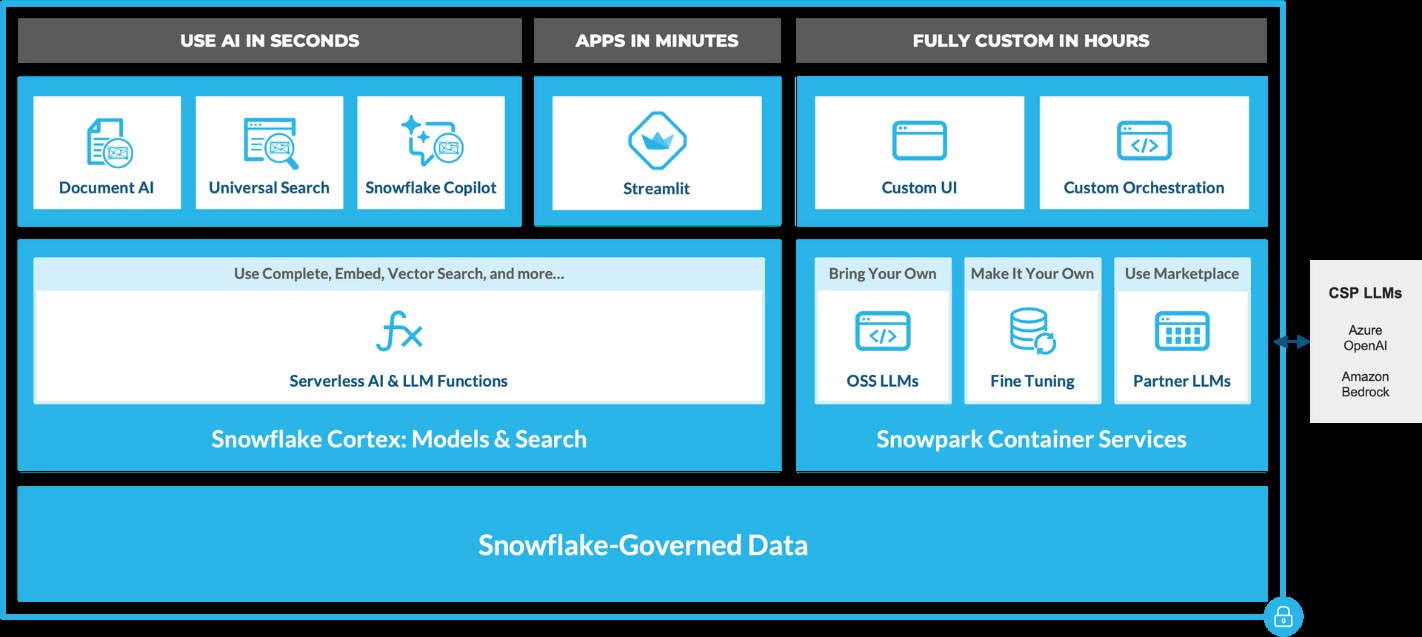
Snowflake Cortex: AI-Powered Data at Your Fingertips
Snowflake Cortex provides access to industry-leading AI models, including large language models (LLMs) and vector search functionality. These serverless tools simplify everyday analytics and AI development, all within a single line of SQL or Python.
 Source: https://www.snowflake.com/en/blog/use-ai-snowflake-cortex/
Key benefits include:
• Instant Access to AI Models: Snowflake users can leverage specialized machine learning and LLM models without managing expensive infrastructure. • Enhanced Data Insights: With Cortex, users can analyze vast datasets using Snowflake’s powerful AI capabilities, unlocking strategic insights to improve decision-making. • Simplified AI App Development: By removing technical barriers, Cortex democratizes AI access, enabling users of all skill levels to build AI applications.
LLM-Based Models for Unstructured Data (in private preview):
• Answer Extraction: Extract key information from unstructured datasets. • Sentiment Detection: Identify the sentiment in textual data. • Text Summarization: Create concise summaries of lengthy documents for quicker insights. • Translation: Perform large-scale text translation efficiently.ML-Based Models (available soon):
• Forecasting: Automatically forecast time series based on historical data, adjusting for seasonality and scaling. • Anomaly Detection: Detect outliers in time series data, useful for monitoring data pipelines. • Contribution Explorer: Identify key factors contributing to changes in metrics between two time intervals. • Classification: Categorize data into predefined classes to offer recommendations based on trends.
General Purpose Models for Broader Use Cases:
• Complete: Generate text completions using state-of-the-art open-source LLMs like Llama 2. • Text2SQL: Convert natural language queries into SQL, powered by Snowflake’s LLM, similar to the Snowflake Copilot feature. These serverless functions offer out-of-the-box capabilities that can be integrated into analytics workflows and app development in Snowflake. For example, with just a few lines of code, developers can embed these functions into chatbots using Streamlit. This allows Python-savvy users to build secure and powerful LLM applications quickly, often within hours.
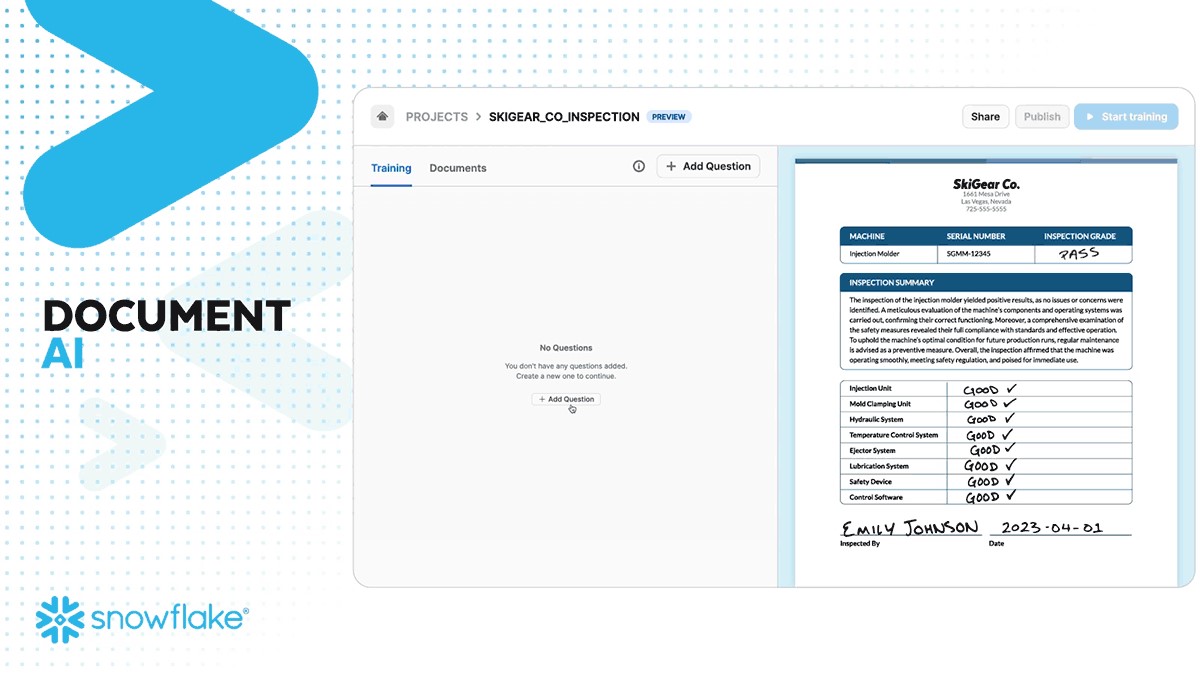
Document AI
Document AI (currently in private preview) leverages large language models (LLMs) for seamless data extraction. By utilizing a pre-trained model and a user-friendly interface, customers can process various document types—such as PDFs, Word files, text files, and even screenshots—to quickly obtain answers to their queries. This capability can be scaled to build pipelines that automate data extraction, significantly reducing manual effort and saving time.
 Source: https://www.snowflake.com/en/blog/use-ai-snowflake-cortex/
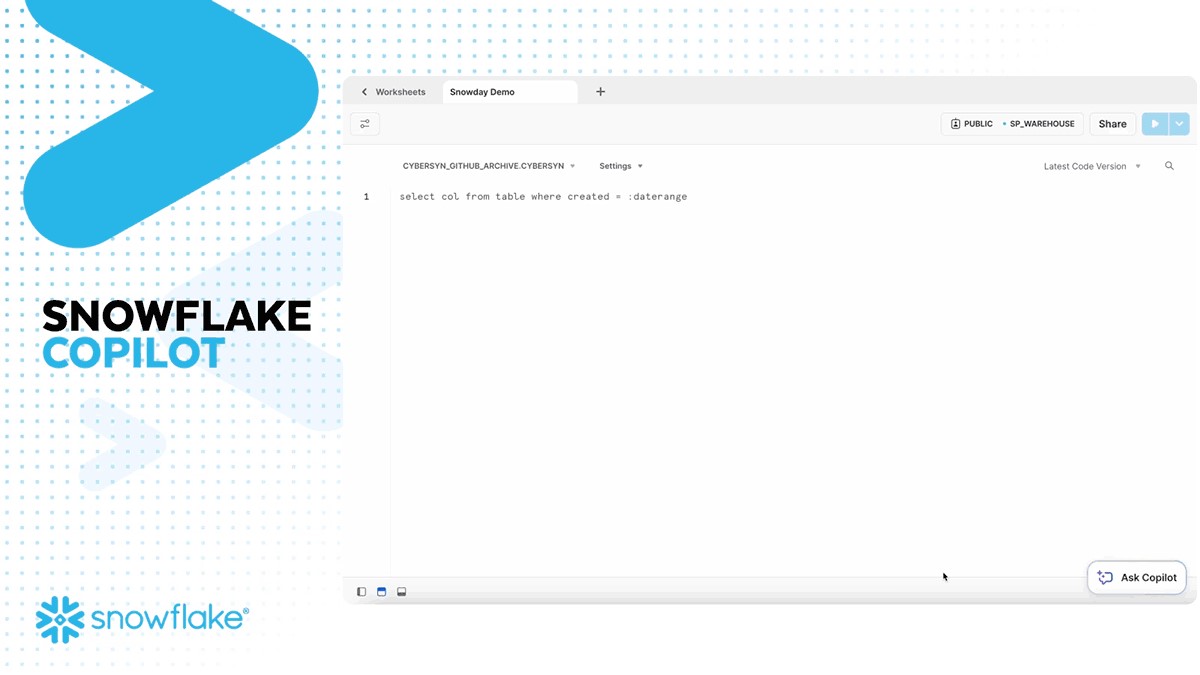
Snowflake Copilot: Your AI-Powered SQL Assistant
Snowflake recently introduced Snowflake Copilot, an AI-driven solution that makes SQL query generation faster and more efficient. With Snowflake Copilot, users can ask data-related questions in plain English, and the AI will generate SQL queries to deliver the desired insights.
Key Features of Snowflake Copilot:
• Text-to-SQL: Users can interact with their data using natural language, eliminating the need for complex SQL coding. • Enhanced Accuracy: The AI continuously refines its understanding of user queries, providing more accurate SQL code suggestions. • Data Exploration: Ask open-ended questions about your data and receive detailed insights without writing complex queries.
The Future of Generative AI with Snowflake
Snowflake is pushing the boundaries of Generative AI with its continuous development of AI tools like Snowflake Cortex AI and Snowflake Copilot. These innovations pave the way for a future where natural language becomes the primary interface for data analysis, enabling businesses to extract more value from their data while maintaining robust governance.
By integrating AI capabilities directly into the data platform, Snowflake empowers users to streamline workflows, reduce processing times, and unlock new levels of productivity—all without needing deep AI expertise.
A Transformative Partnership for the Future
Generative AI, coupled with Snowflake’s powerful data platform, is a game-changer for businesses looking to innovate and scale. Whether it’s enhancing productivity, improving decision-making, or driving customer engagement, Snowflake’s AI solutions are built to transform how enterprises interact with their data.
As AI continues to evolve, so will Snowflake's offerings, bringing more capabilities, deeper insights, and greater efficiencies to businesses worldwide. Ready to experience the future of data analysis with Snowflake and AI? The journey has just begun!
Snowflake + Beinex Partnership
Beinex is a Snowflake Services Partner Premier Tier, and the partnership reaffirms Beinex’s commitment to delivering exceptional data solutions and positions the company at the forefront of industry advancements. Harnessing the true potential of the data, partnership drives innovation and success in the digital era.
Belonging to Snowflake Services Partner Premier Tier, Beinex leverages Snowflake’s advanced capabilities and seamlessly integrates them into its comprehensive data solutions. This enables Beinex to accelerate the pace of Digital Transformation for its clients, providing them with the tools necessary to extract maximum value from their data and thrive in an increasingly data-centric world.
Connect with us for a free demo: https://beinex.com/contact-us/